This document discusses factors related to estimating water demand and supply for a municipality. It covers:
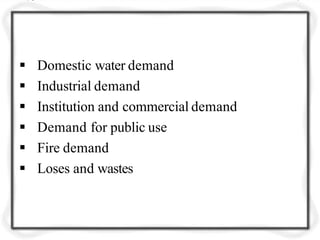
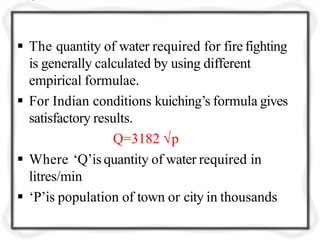
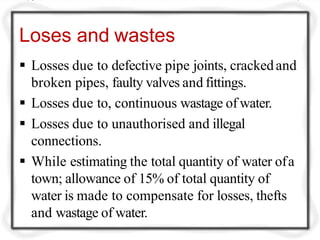
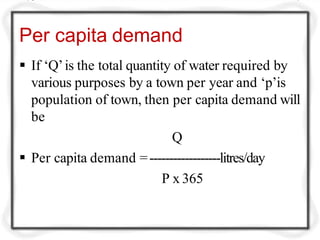
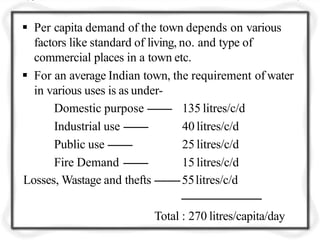
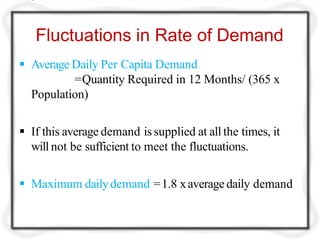
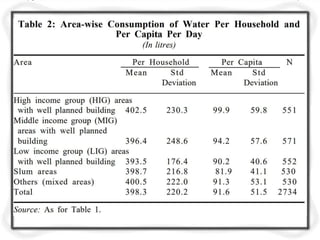
1) Types of water demands including domestic, industrial, institutional, public use, fire demand, and losses/waste. The total demand is calculated as the per capita demand multiplied by the population.
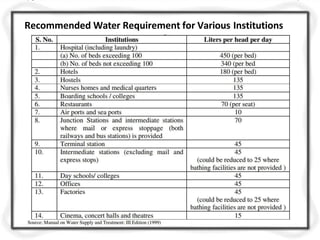
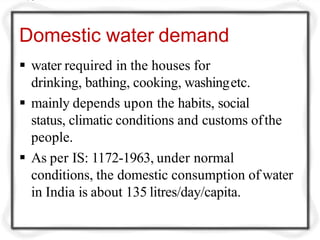
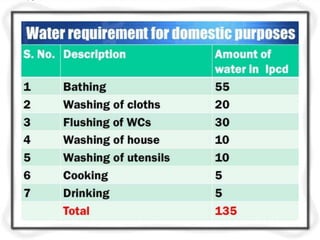
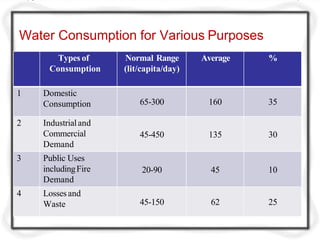
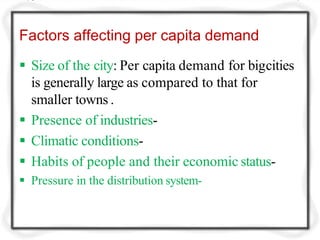
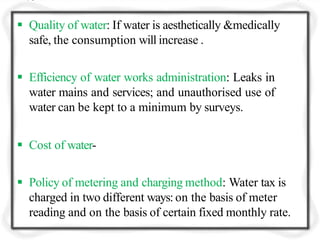
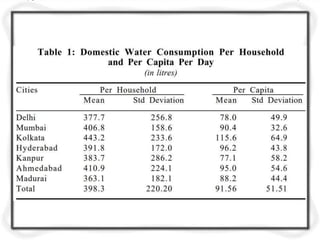
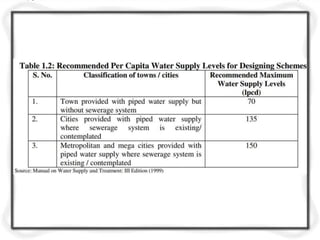
2) Factors that affect per capita demand such as habits, climate, economic status, and efficiency of the water system. Recommended per capita demands for various uses are provided.
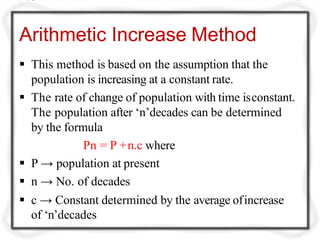
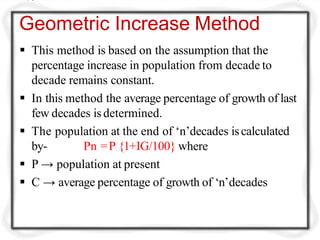
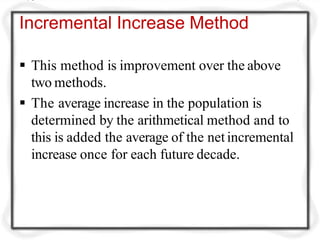
3) Population forecasting methods to estimate future population for design periods, including arithmetic, geometric, and incremental increase methods.