Download to read offline
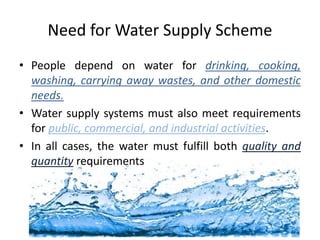
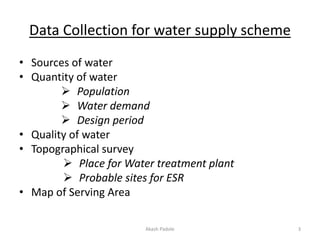
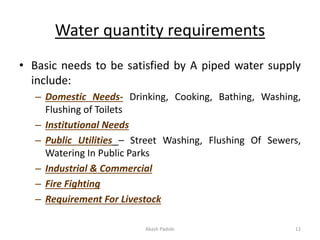

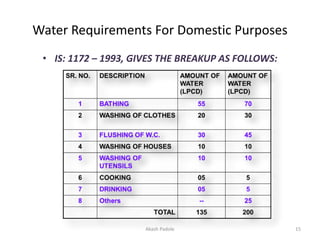
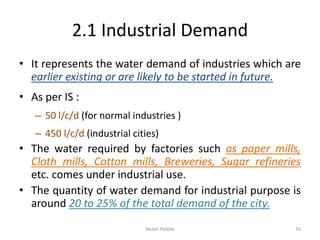
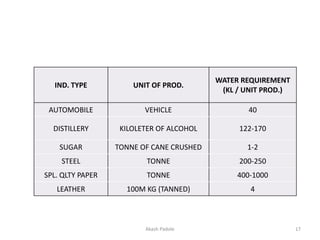
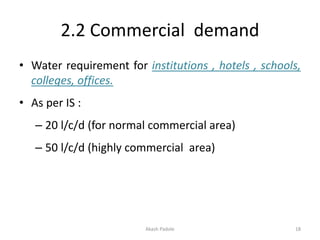
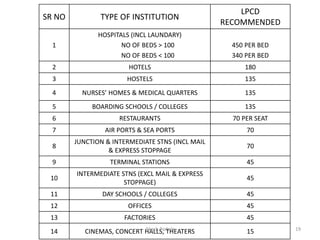

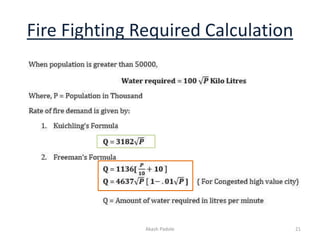


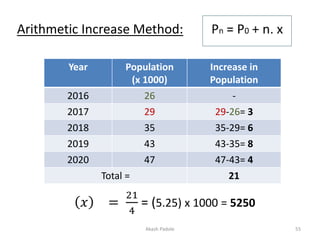

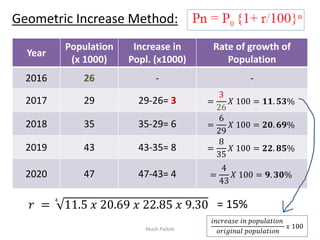
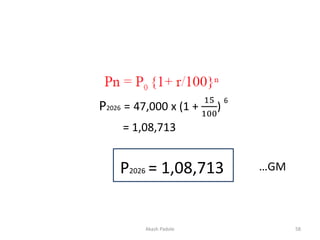
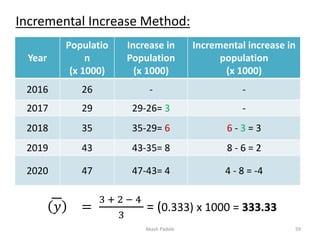


The document discusses the importance of water supply systems in meeting various domestic, public, and industrial needs, emphasizing the significance of water quality and quantity. It outlines the data collection process for designing water supply schemes, including sources of water, demand estimation based on population, and various types of water demand. Additionally, it covers methods for forecasting population growth and their implications on water demand projections.