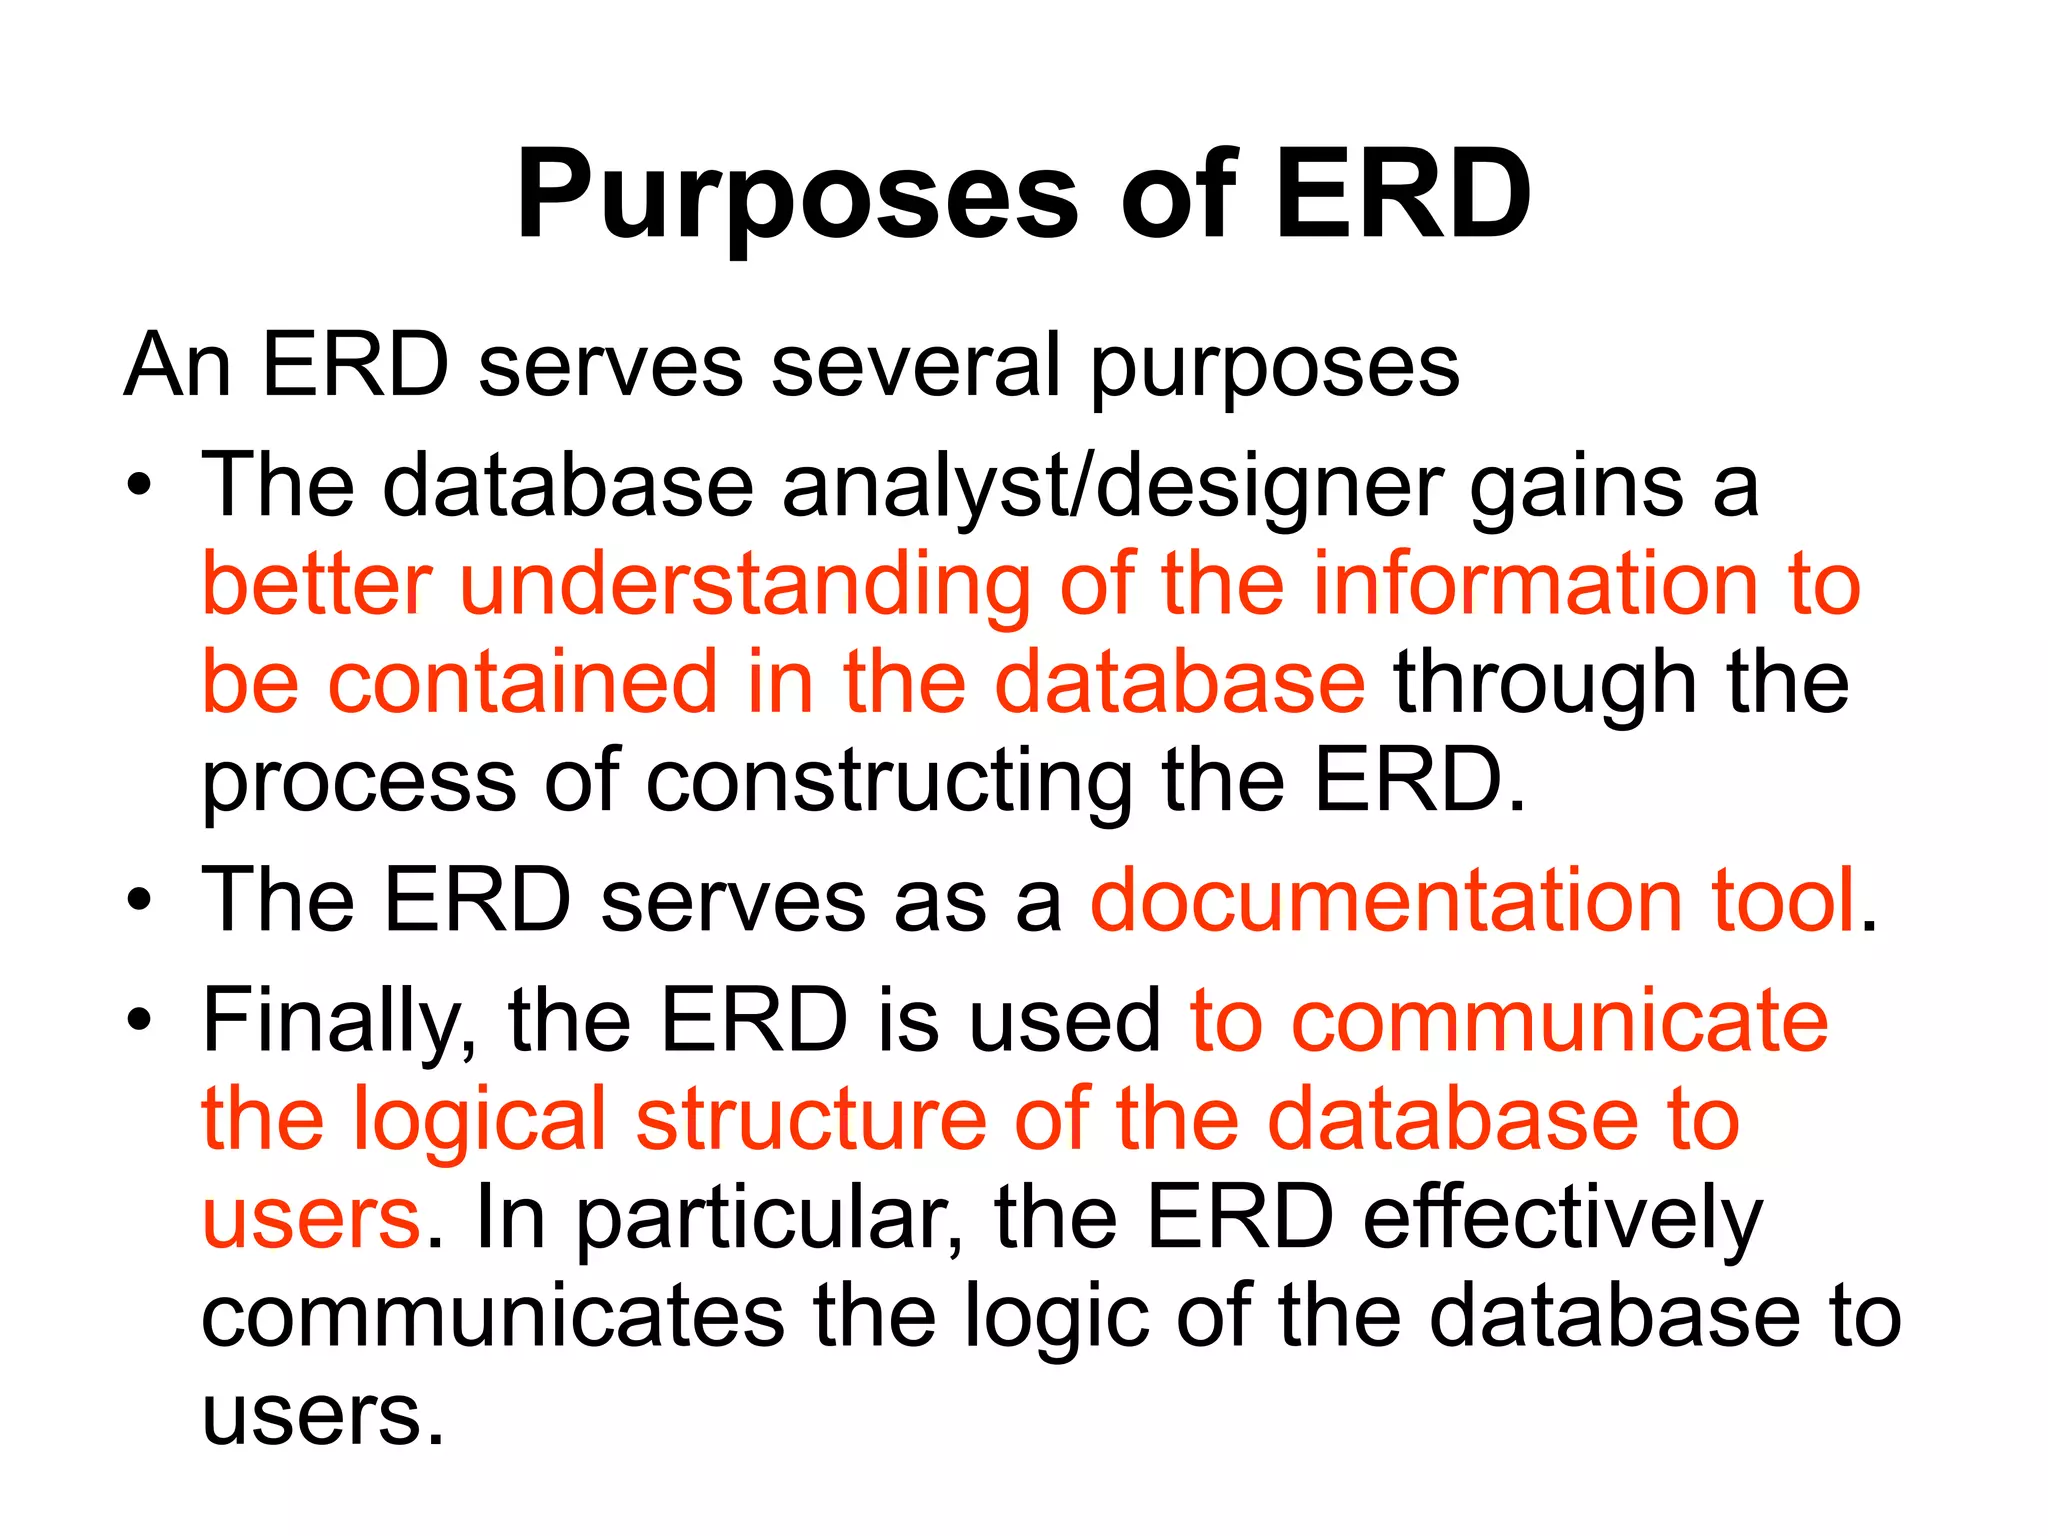
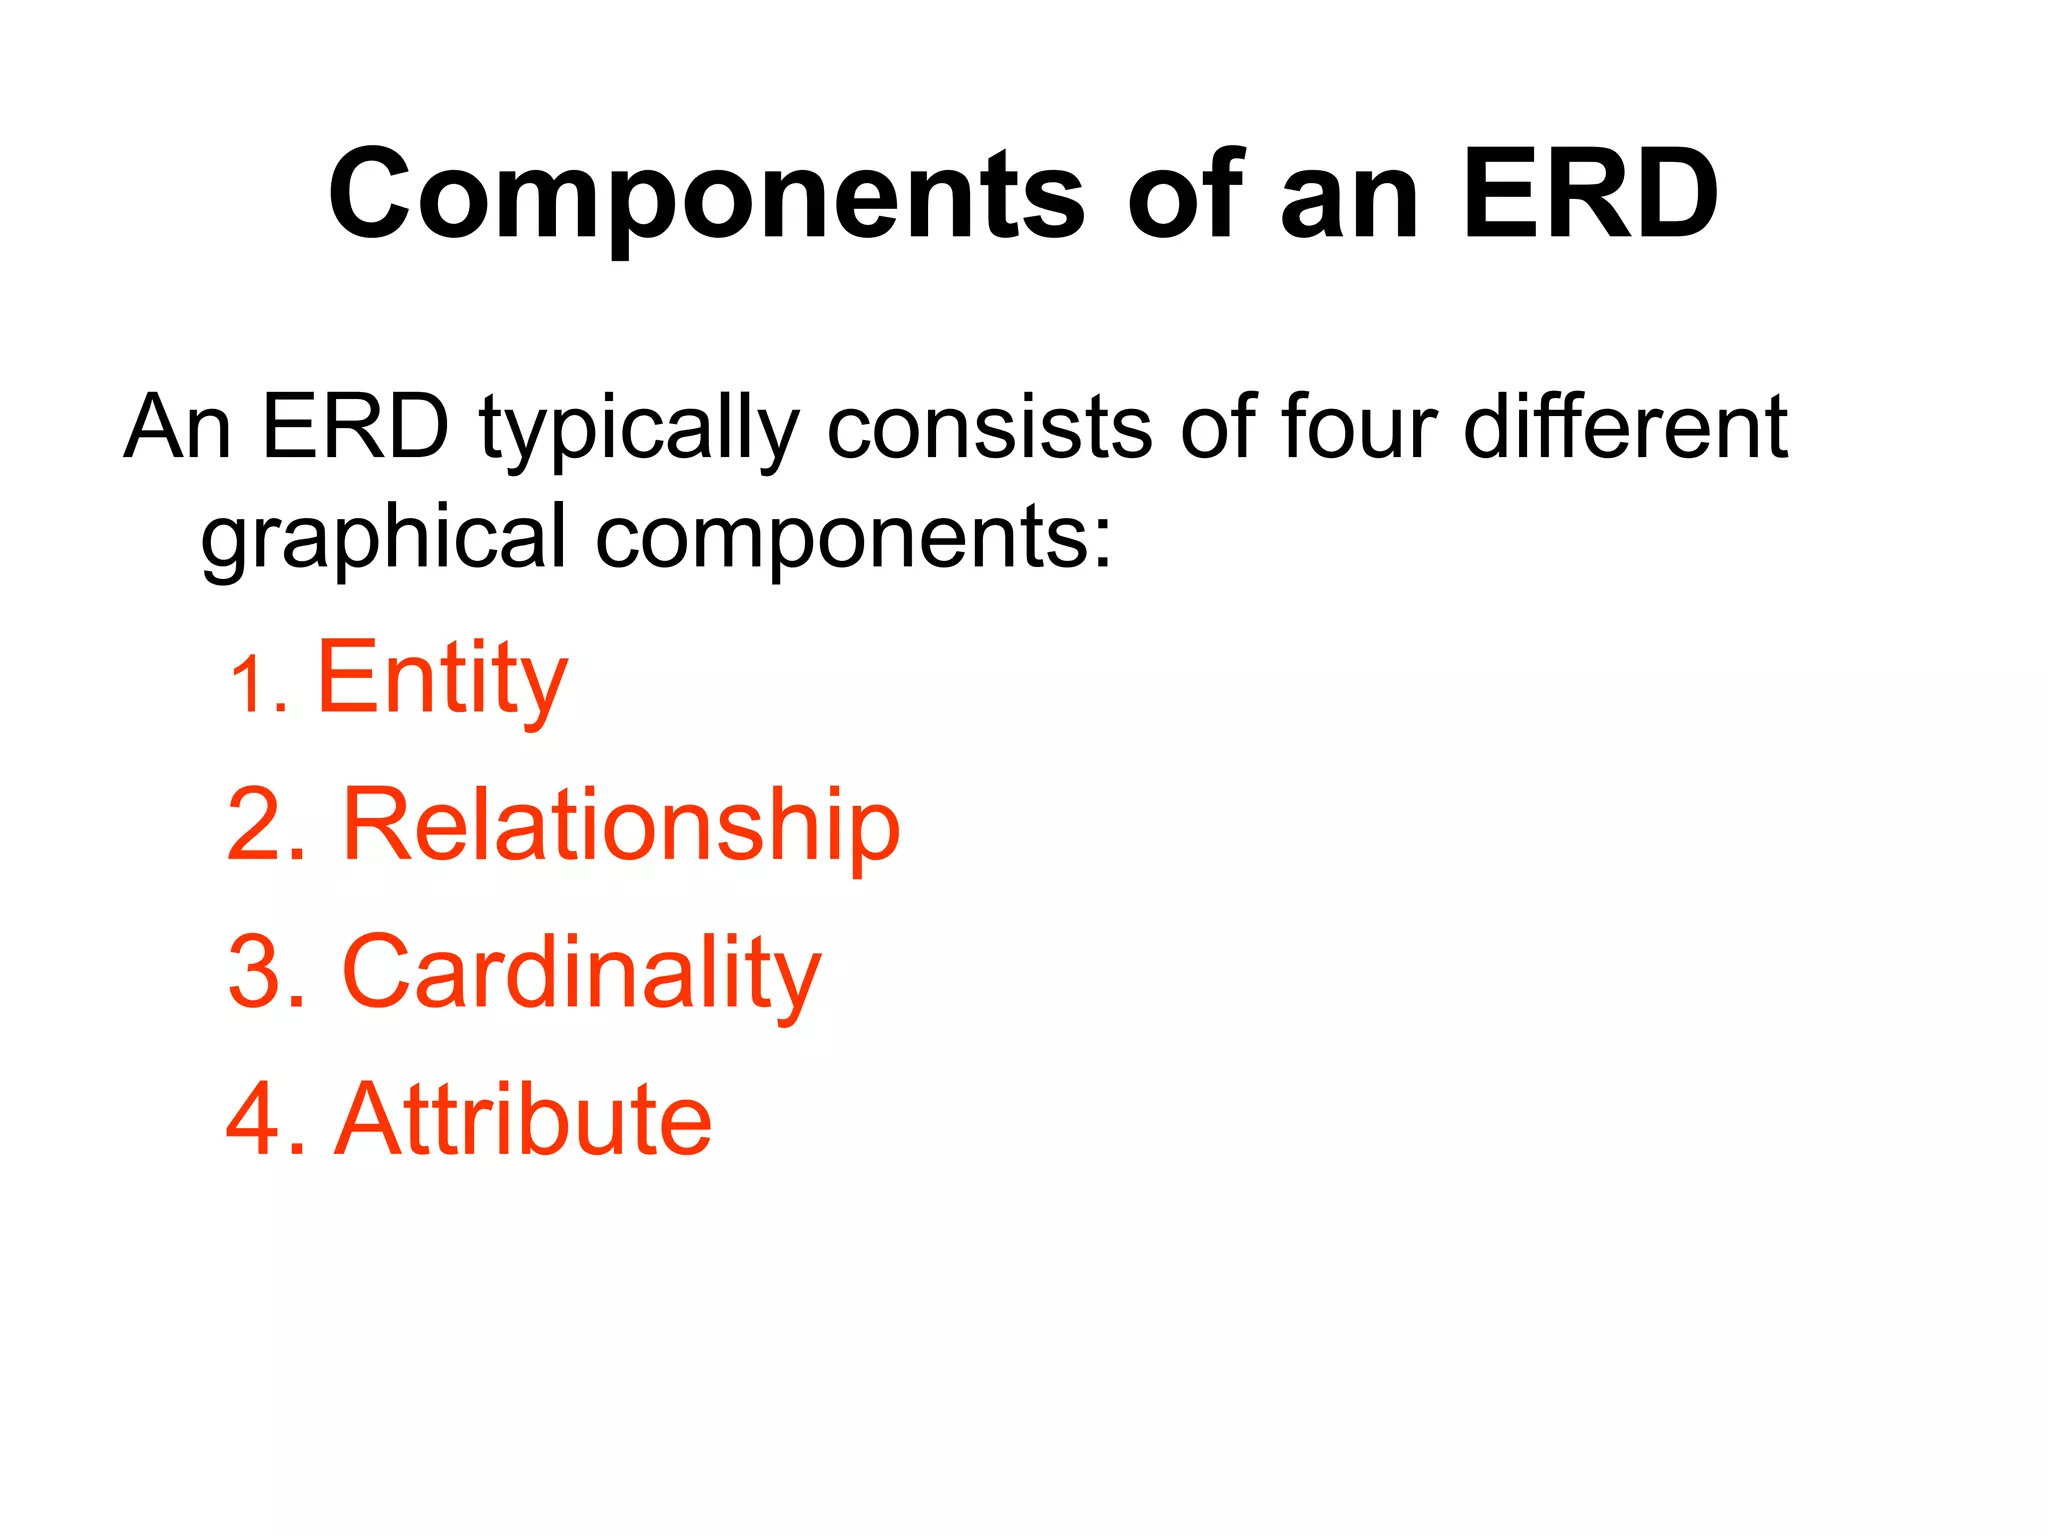
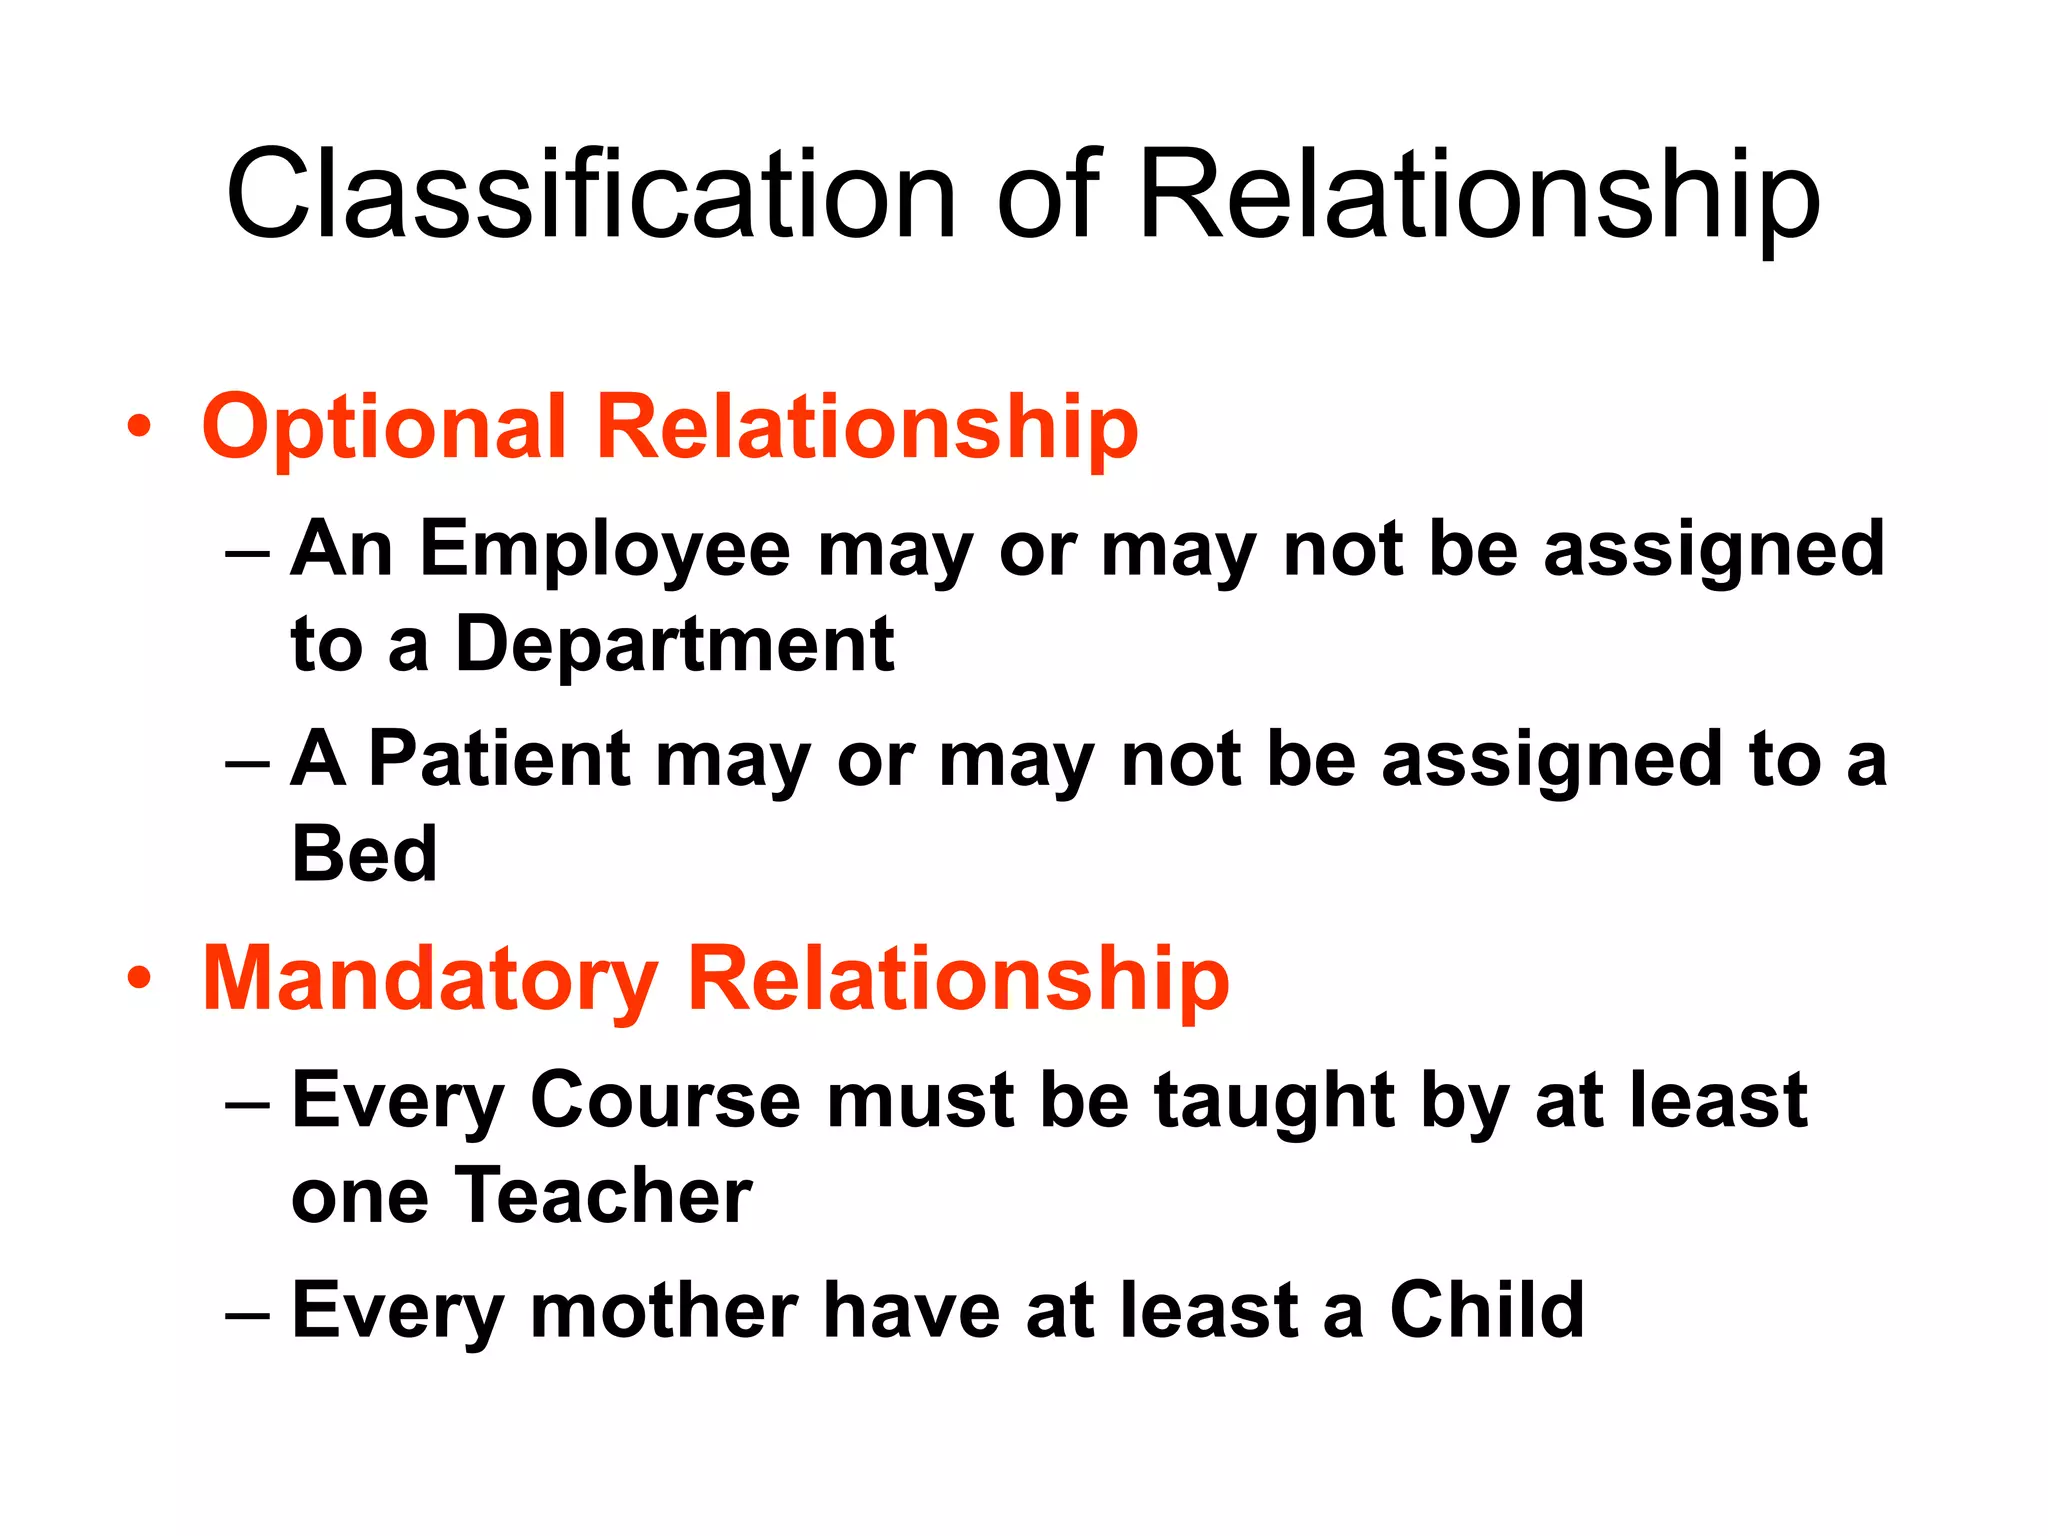
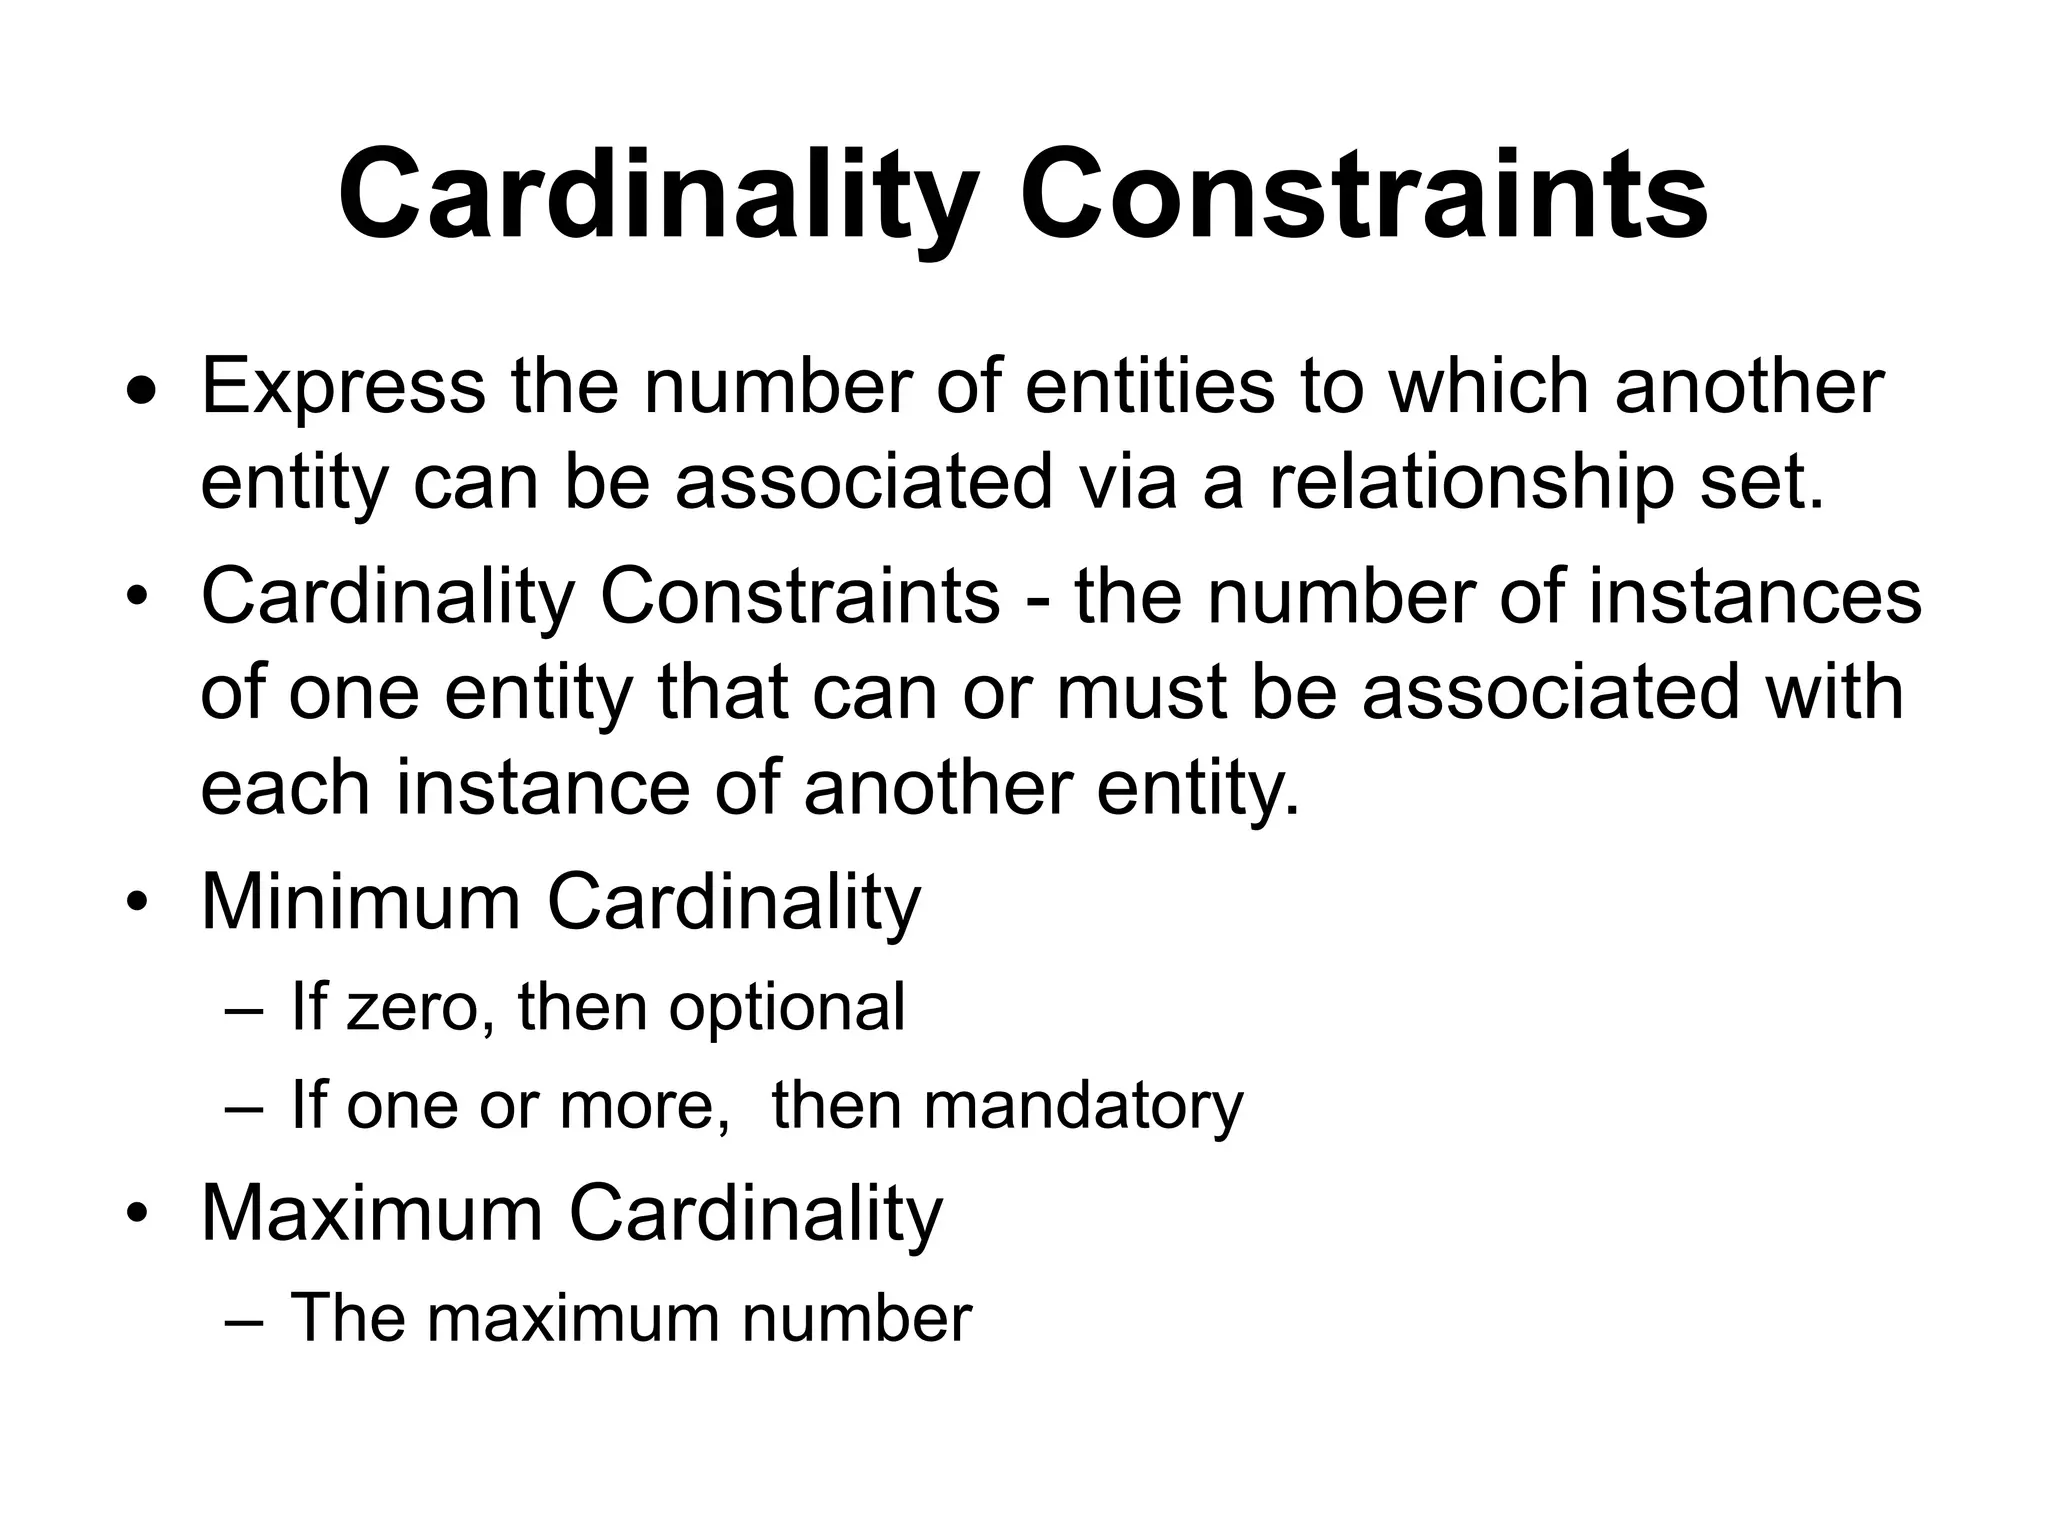
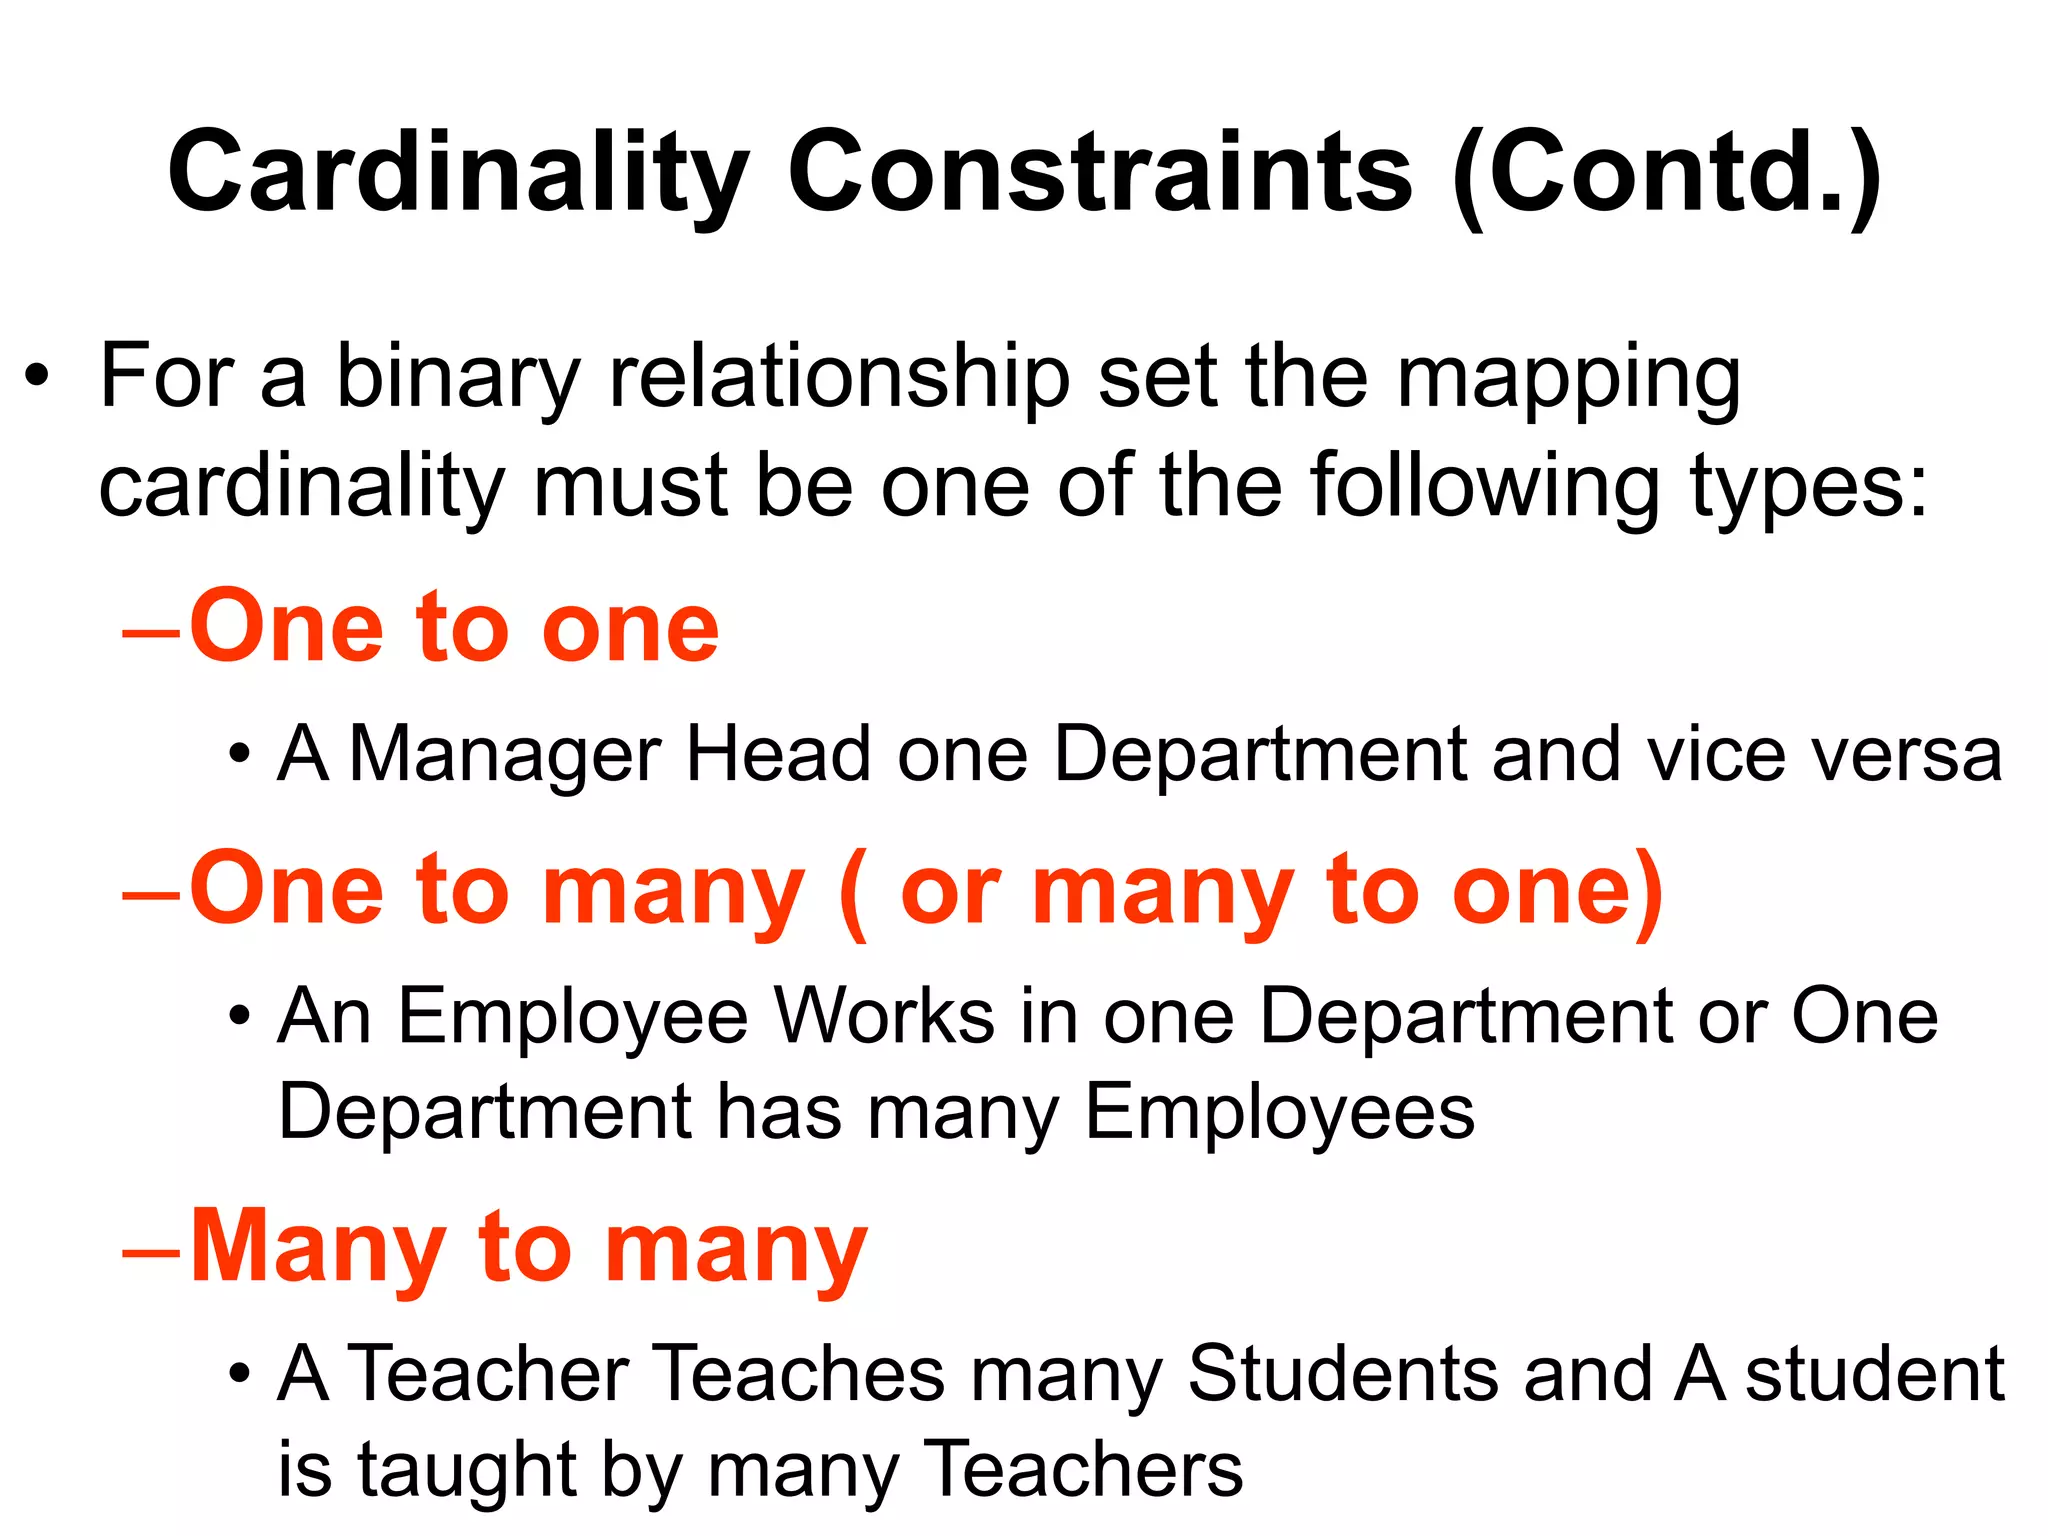
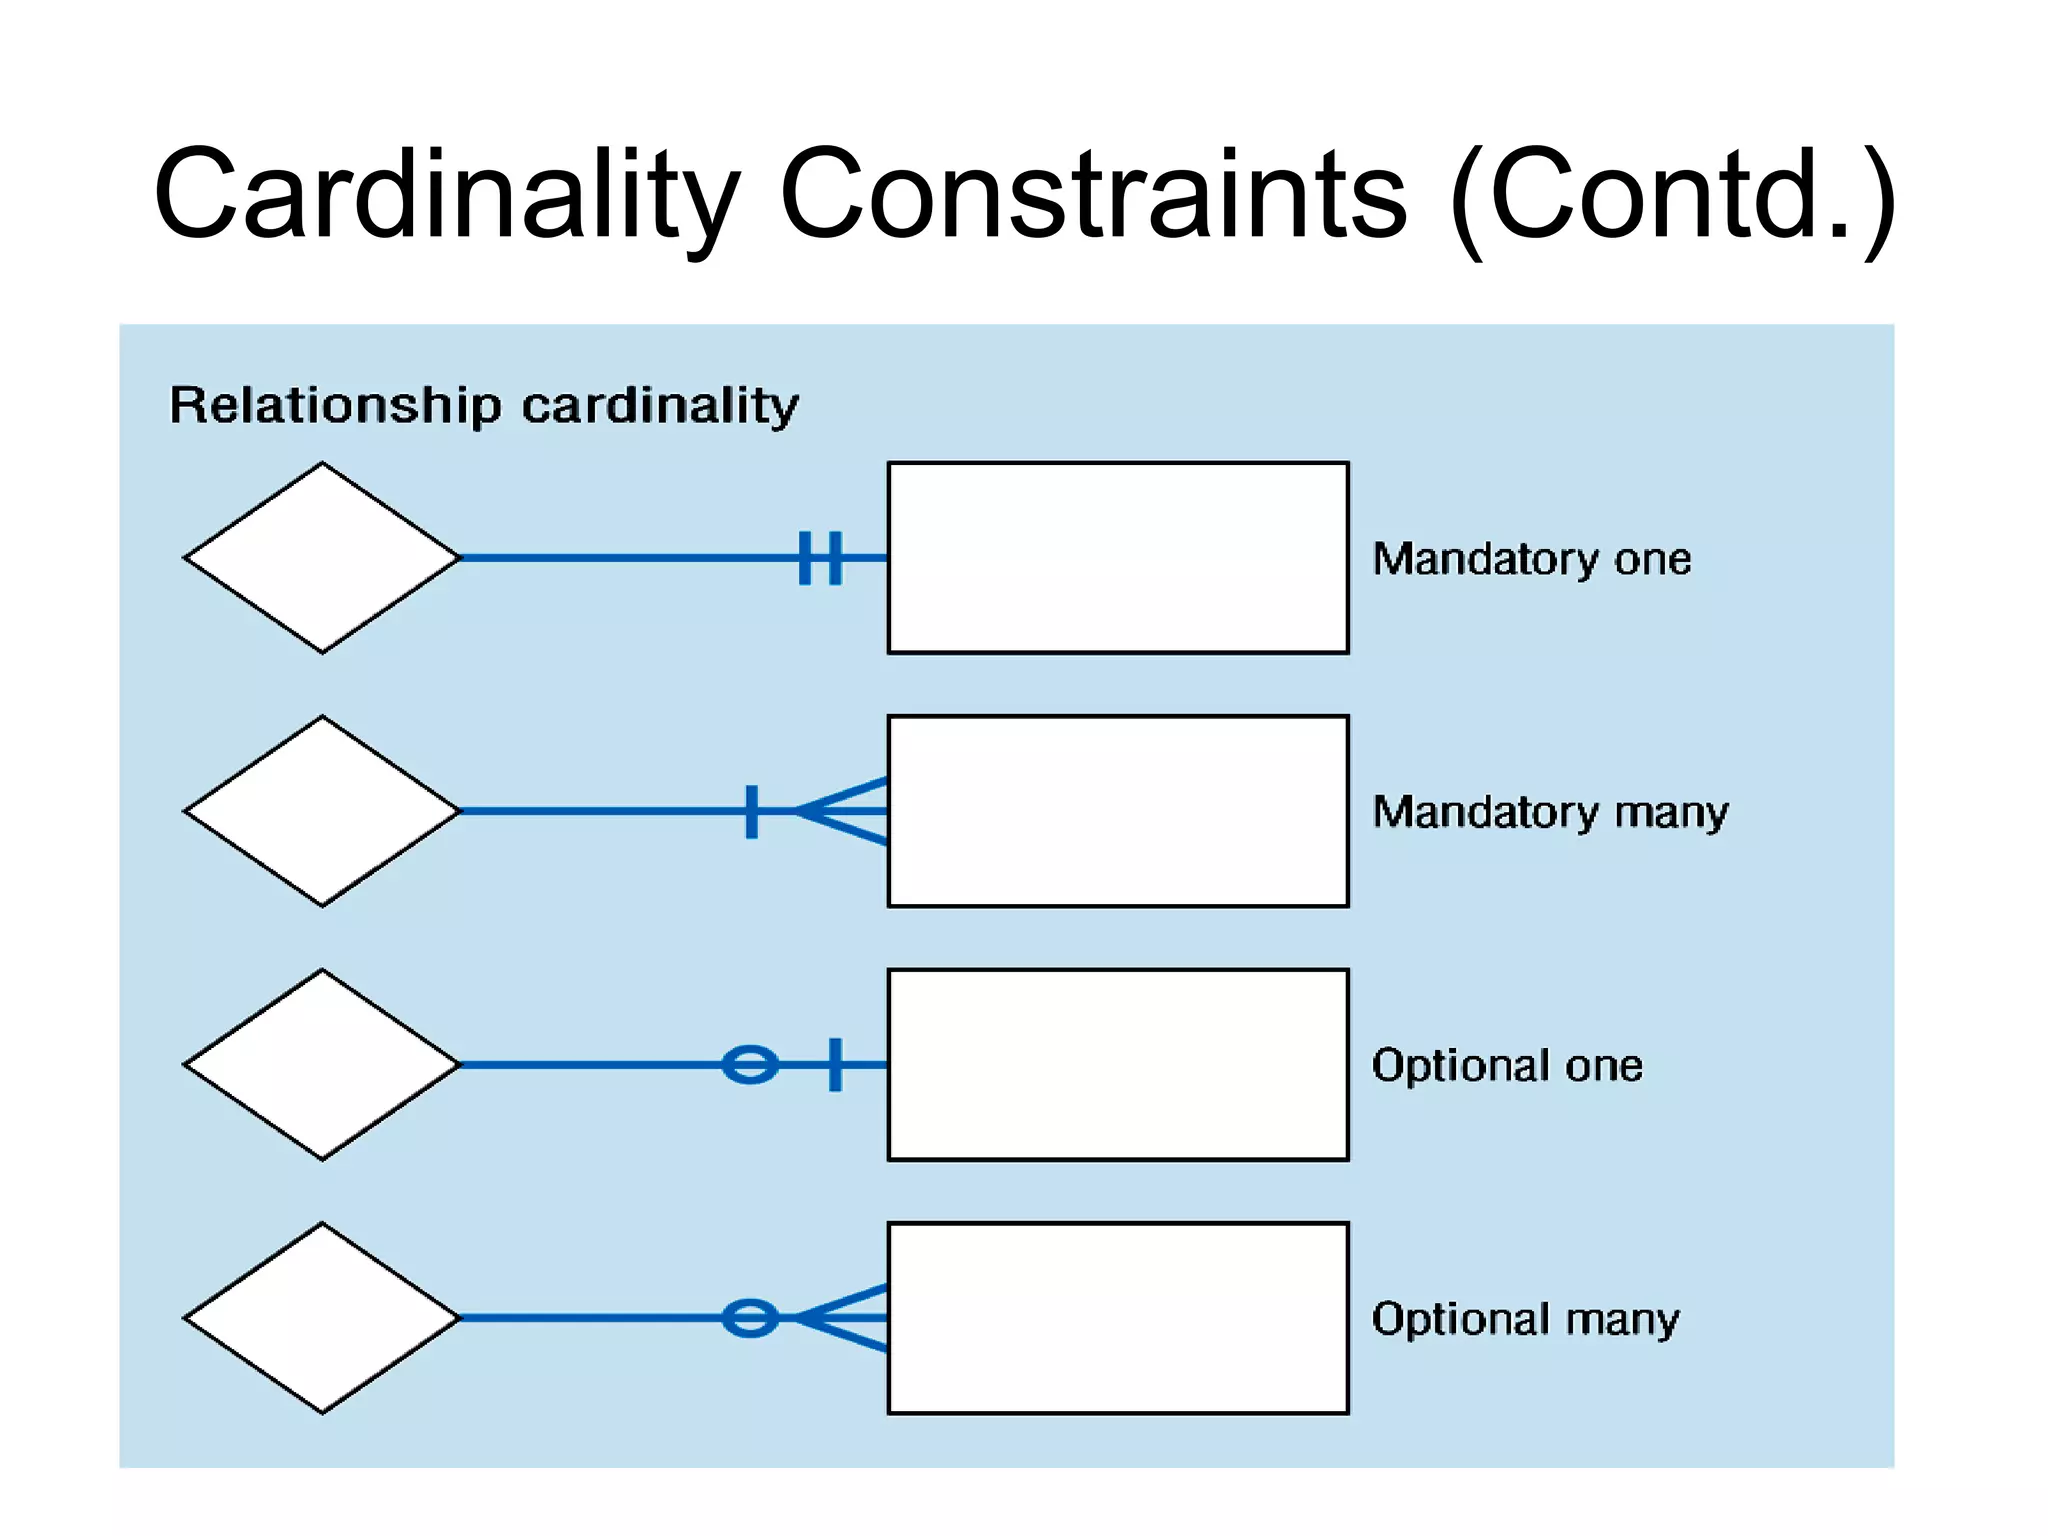
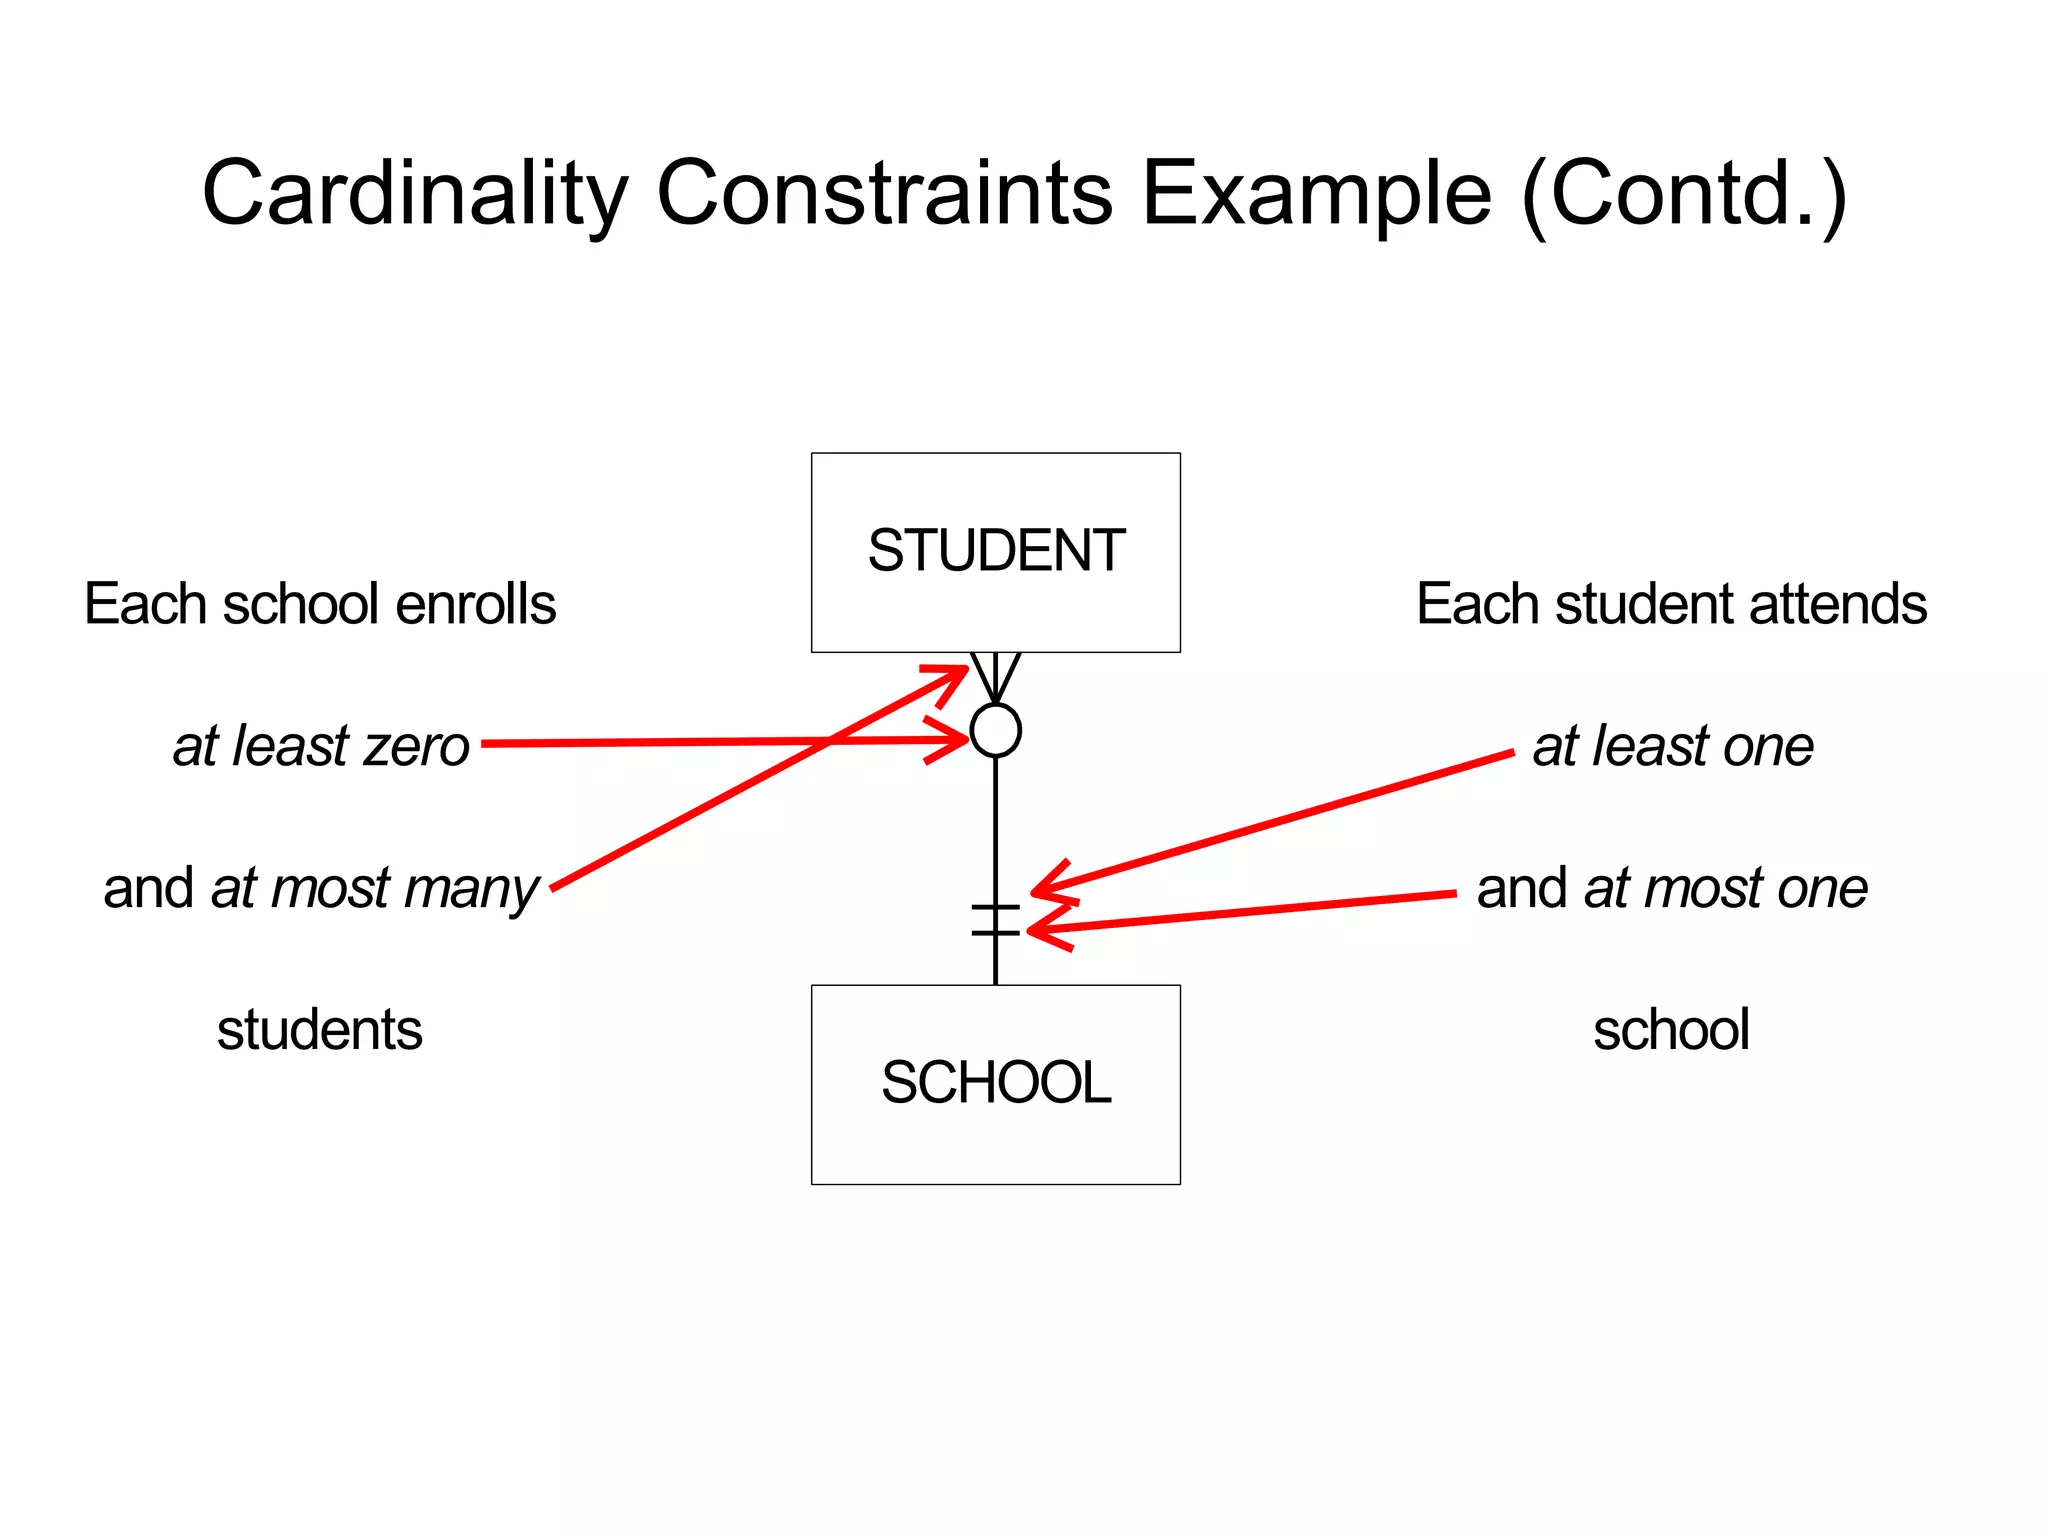
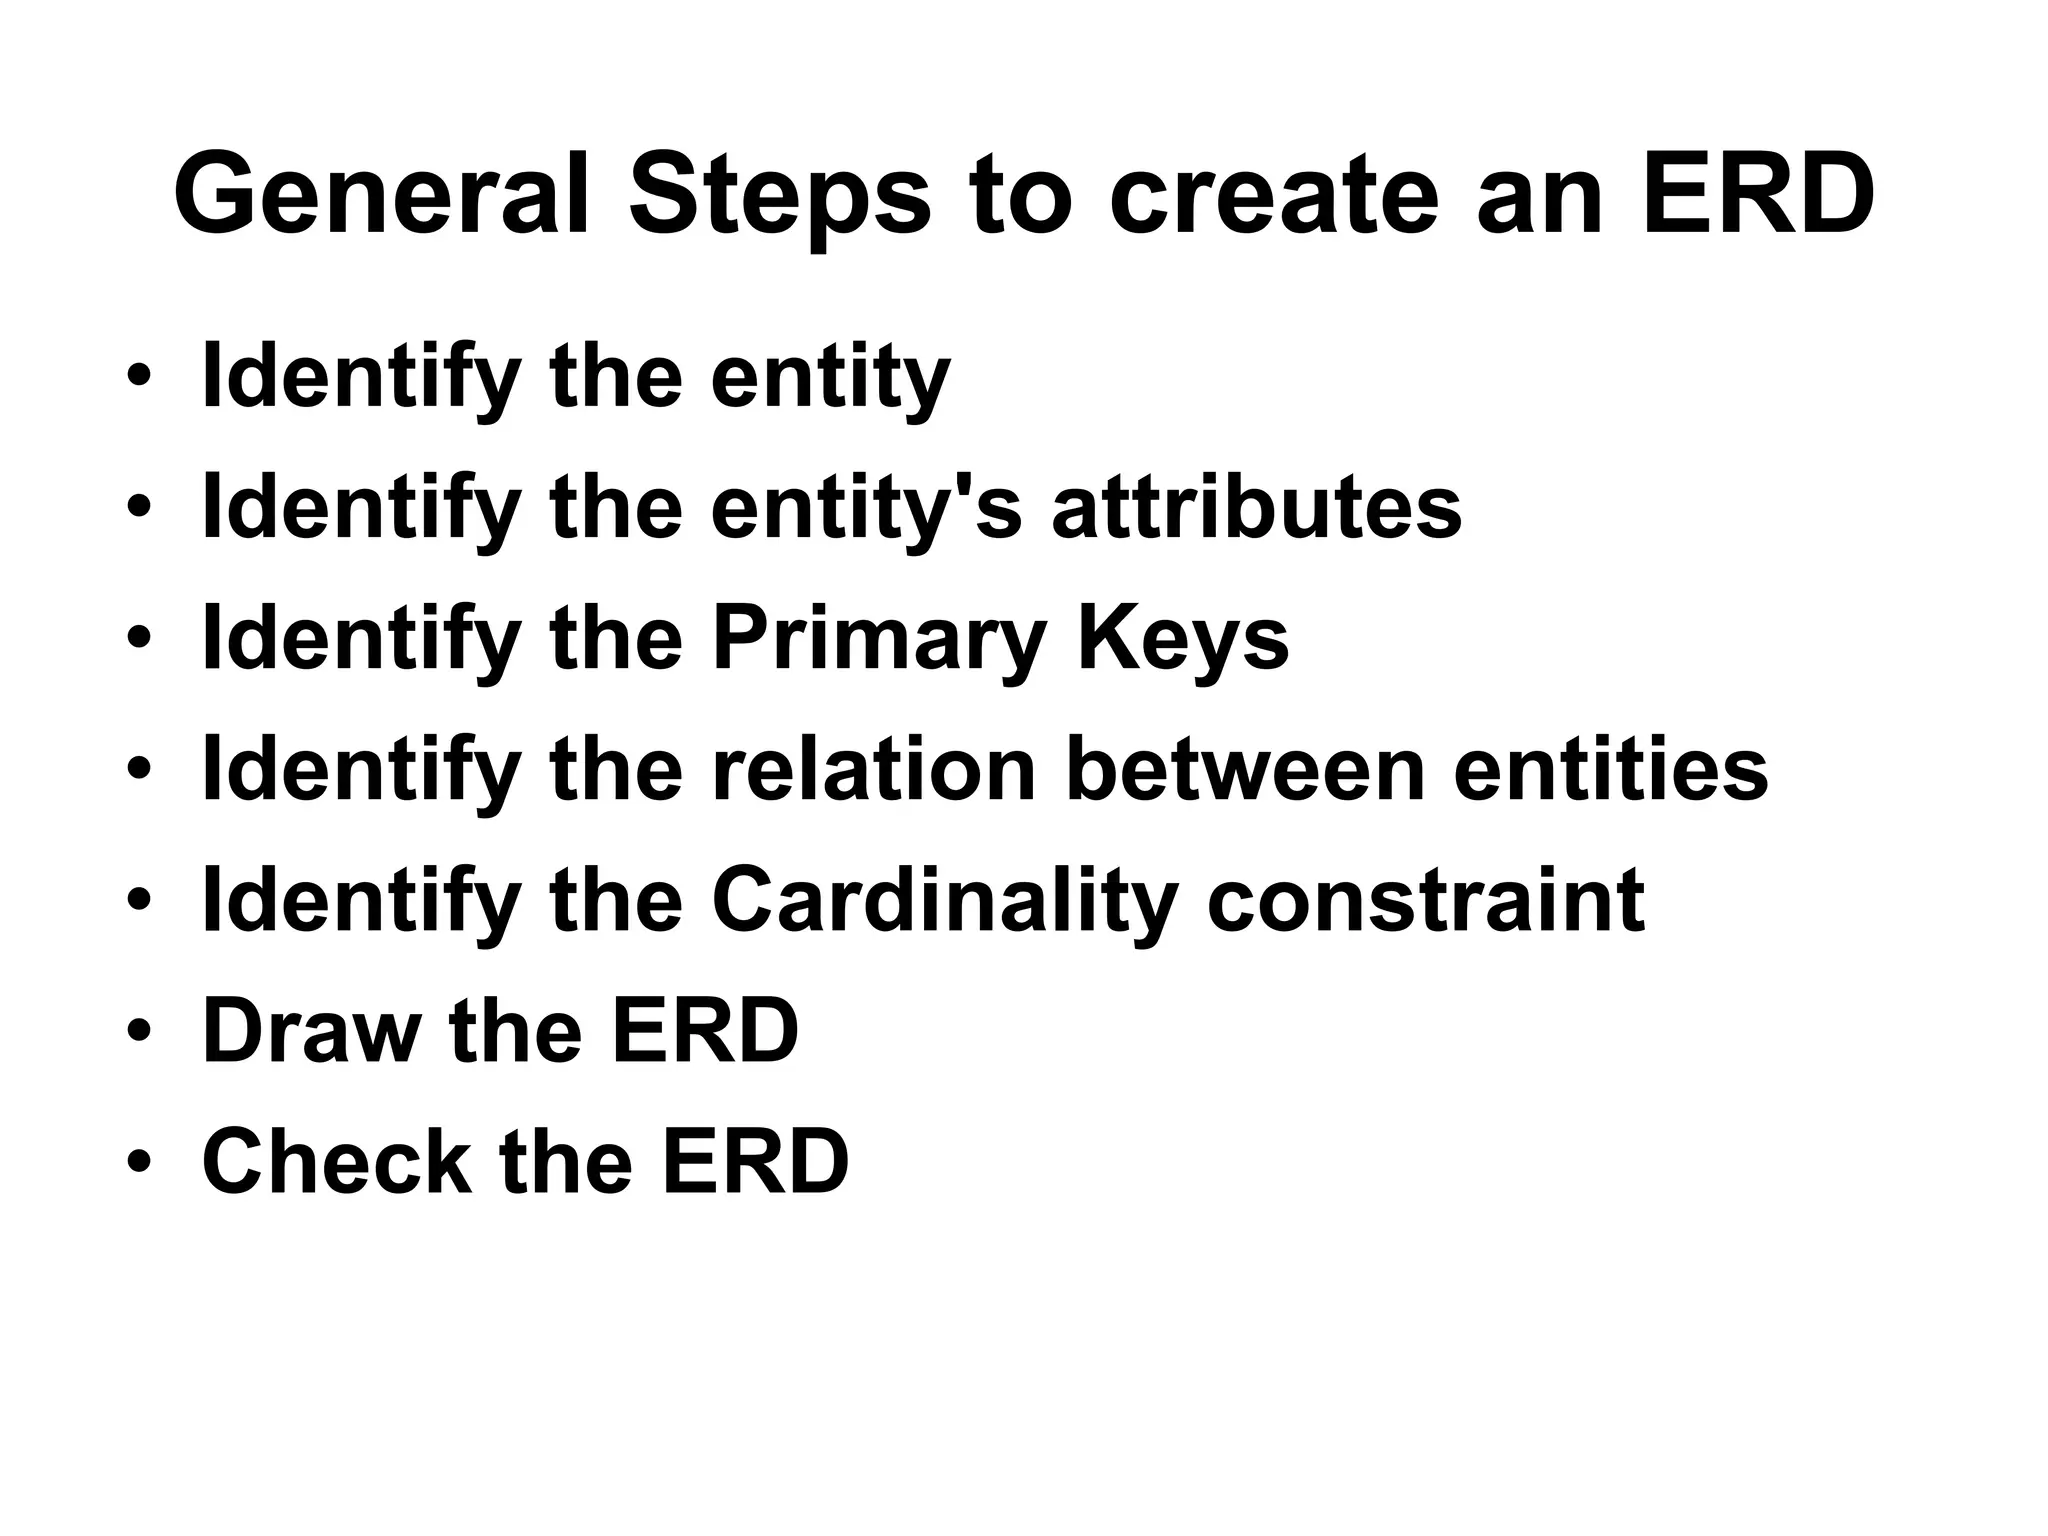
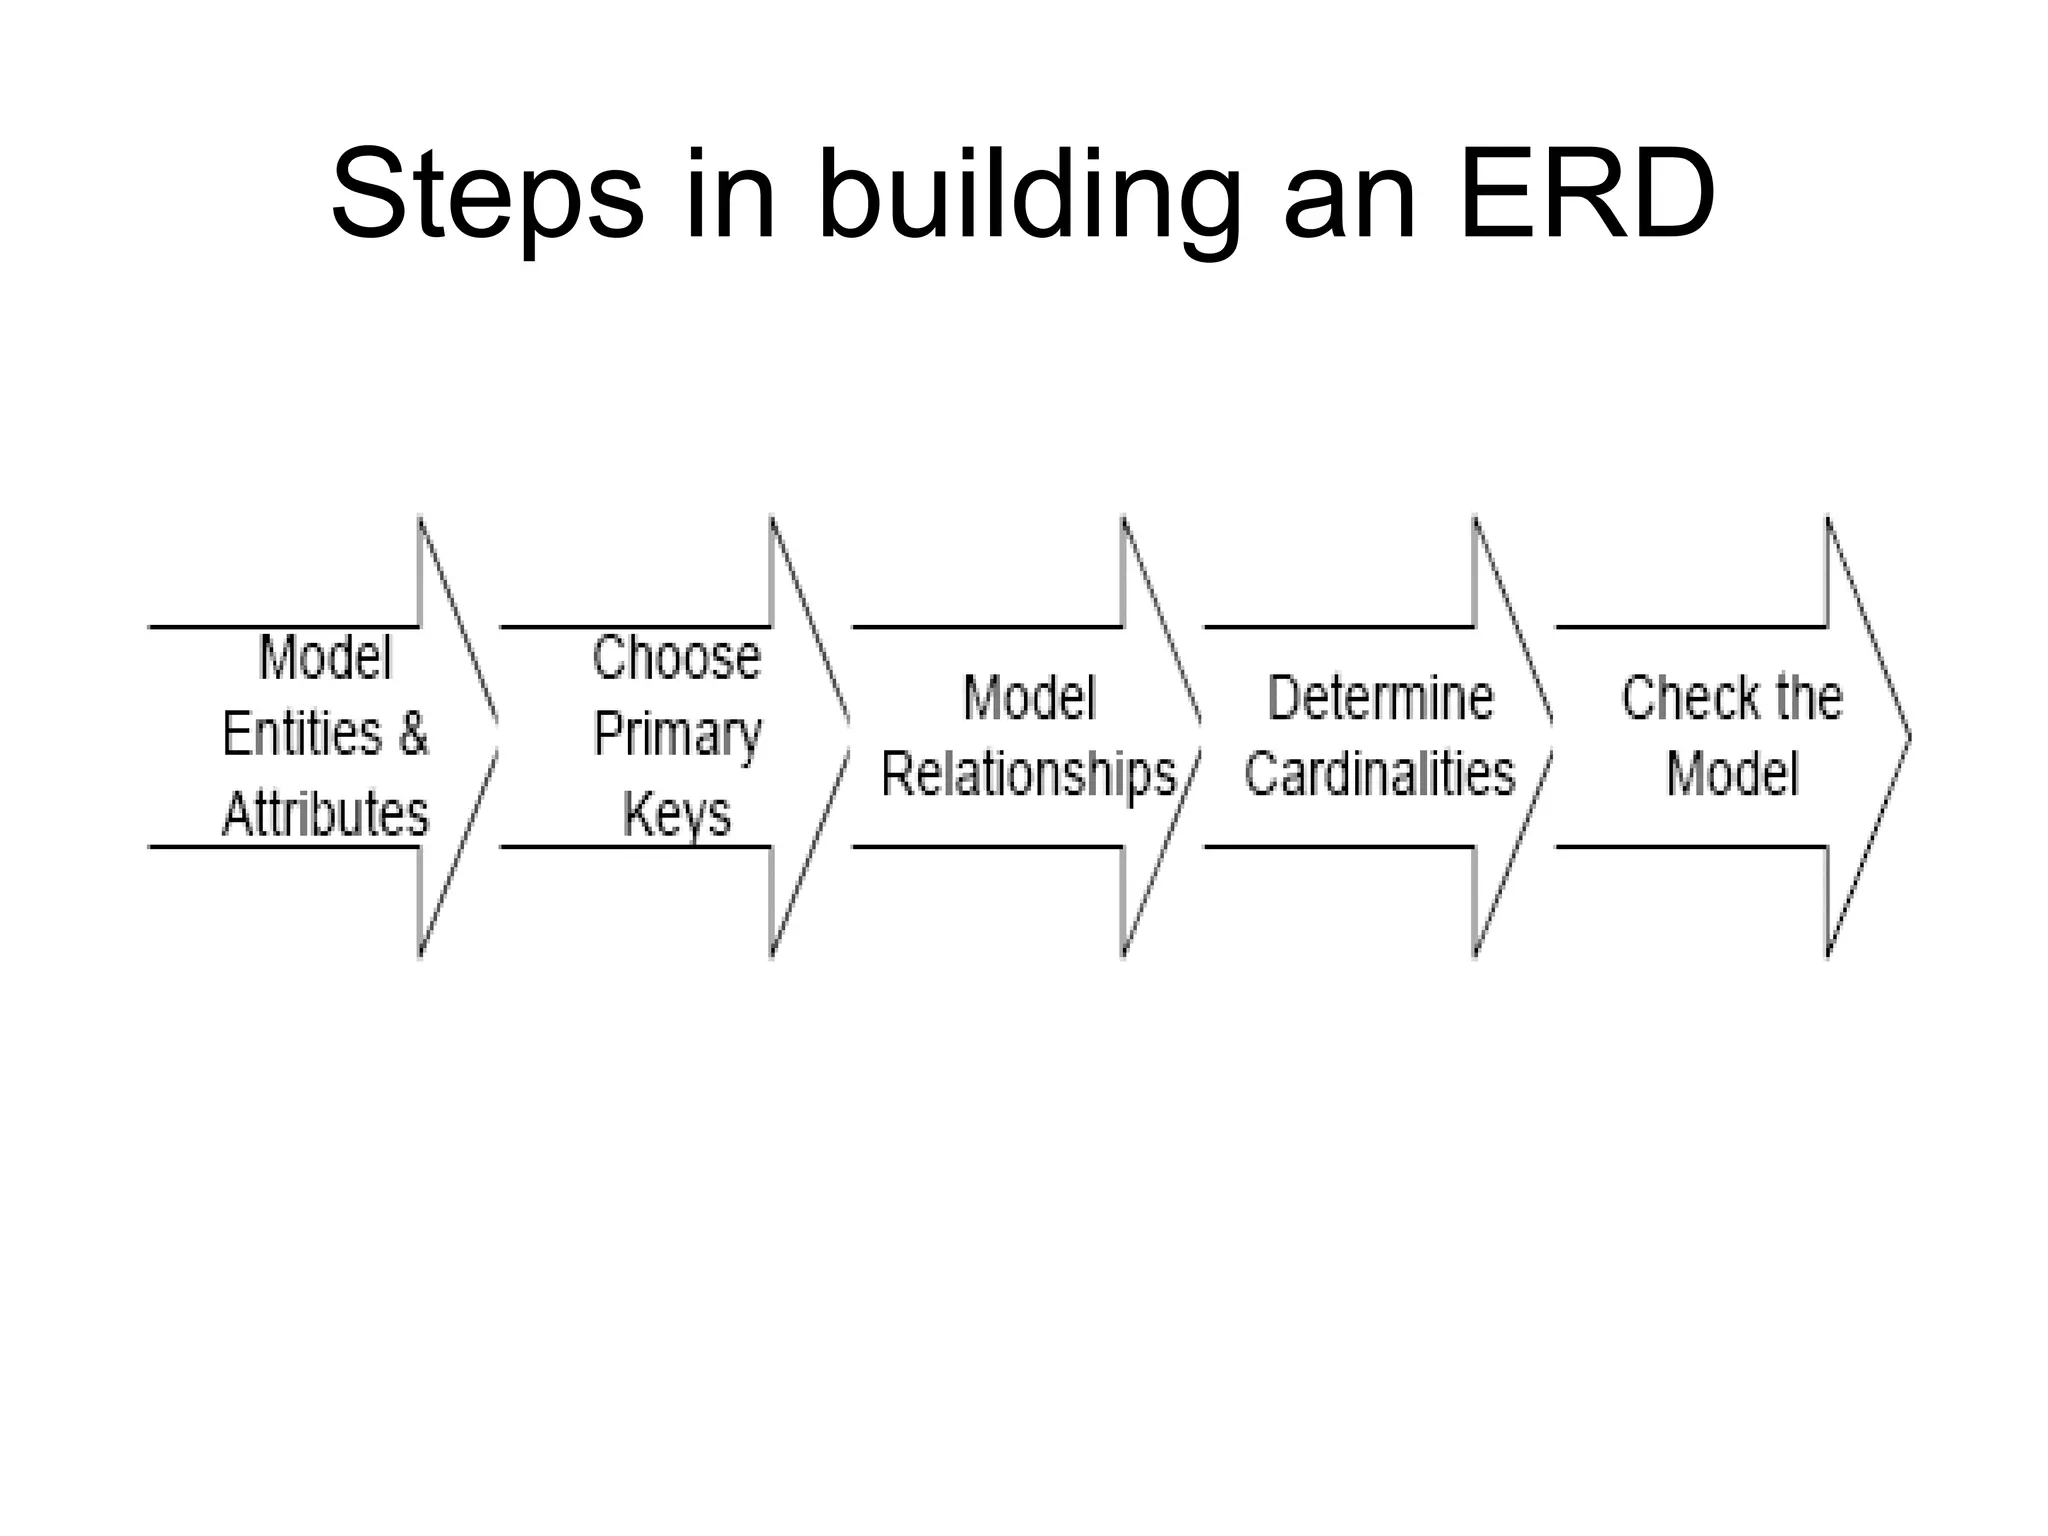
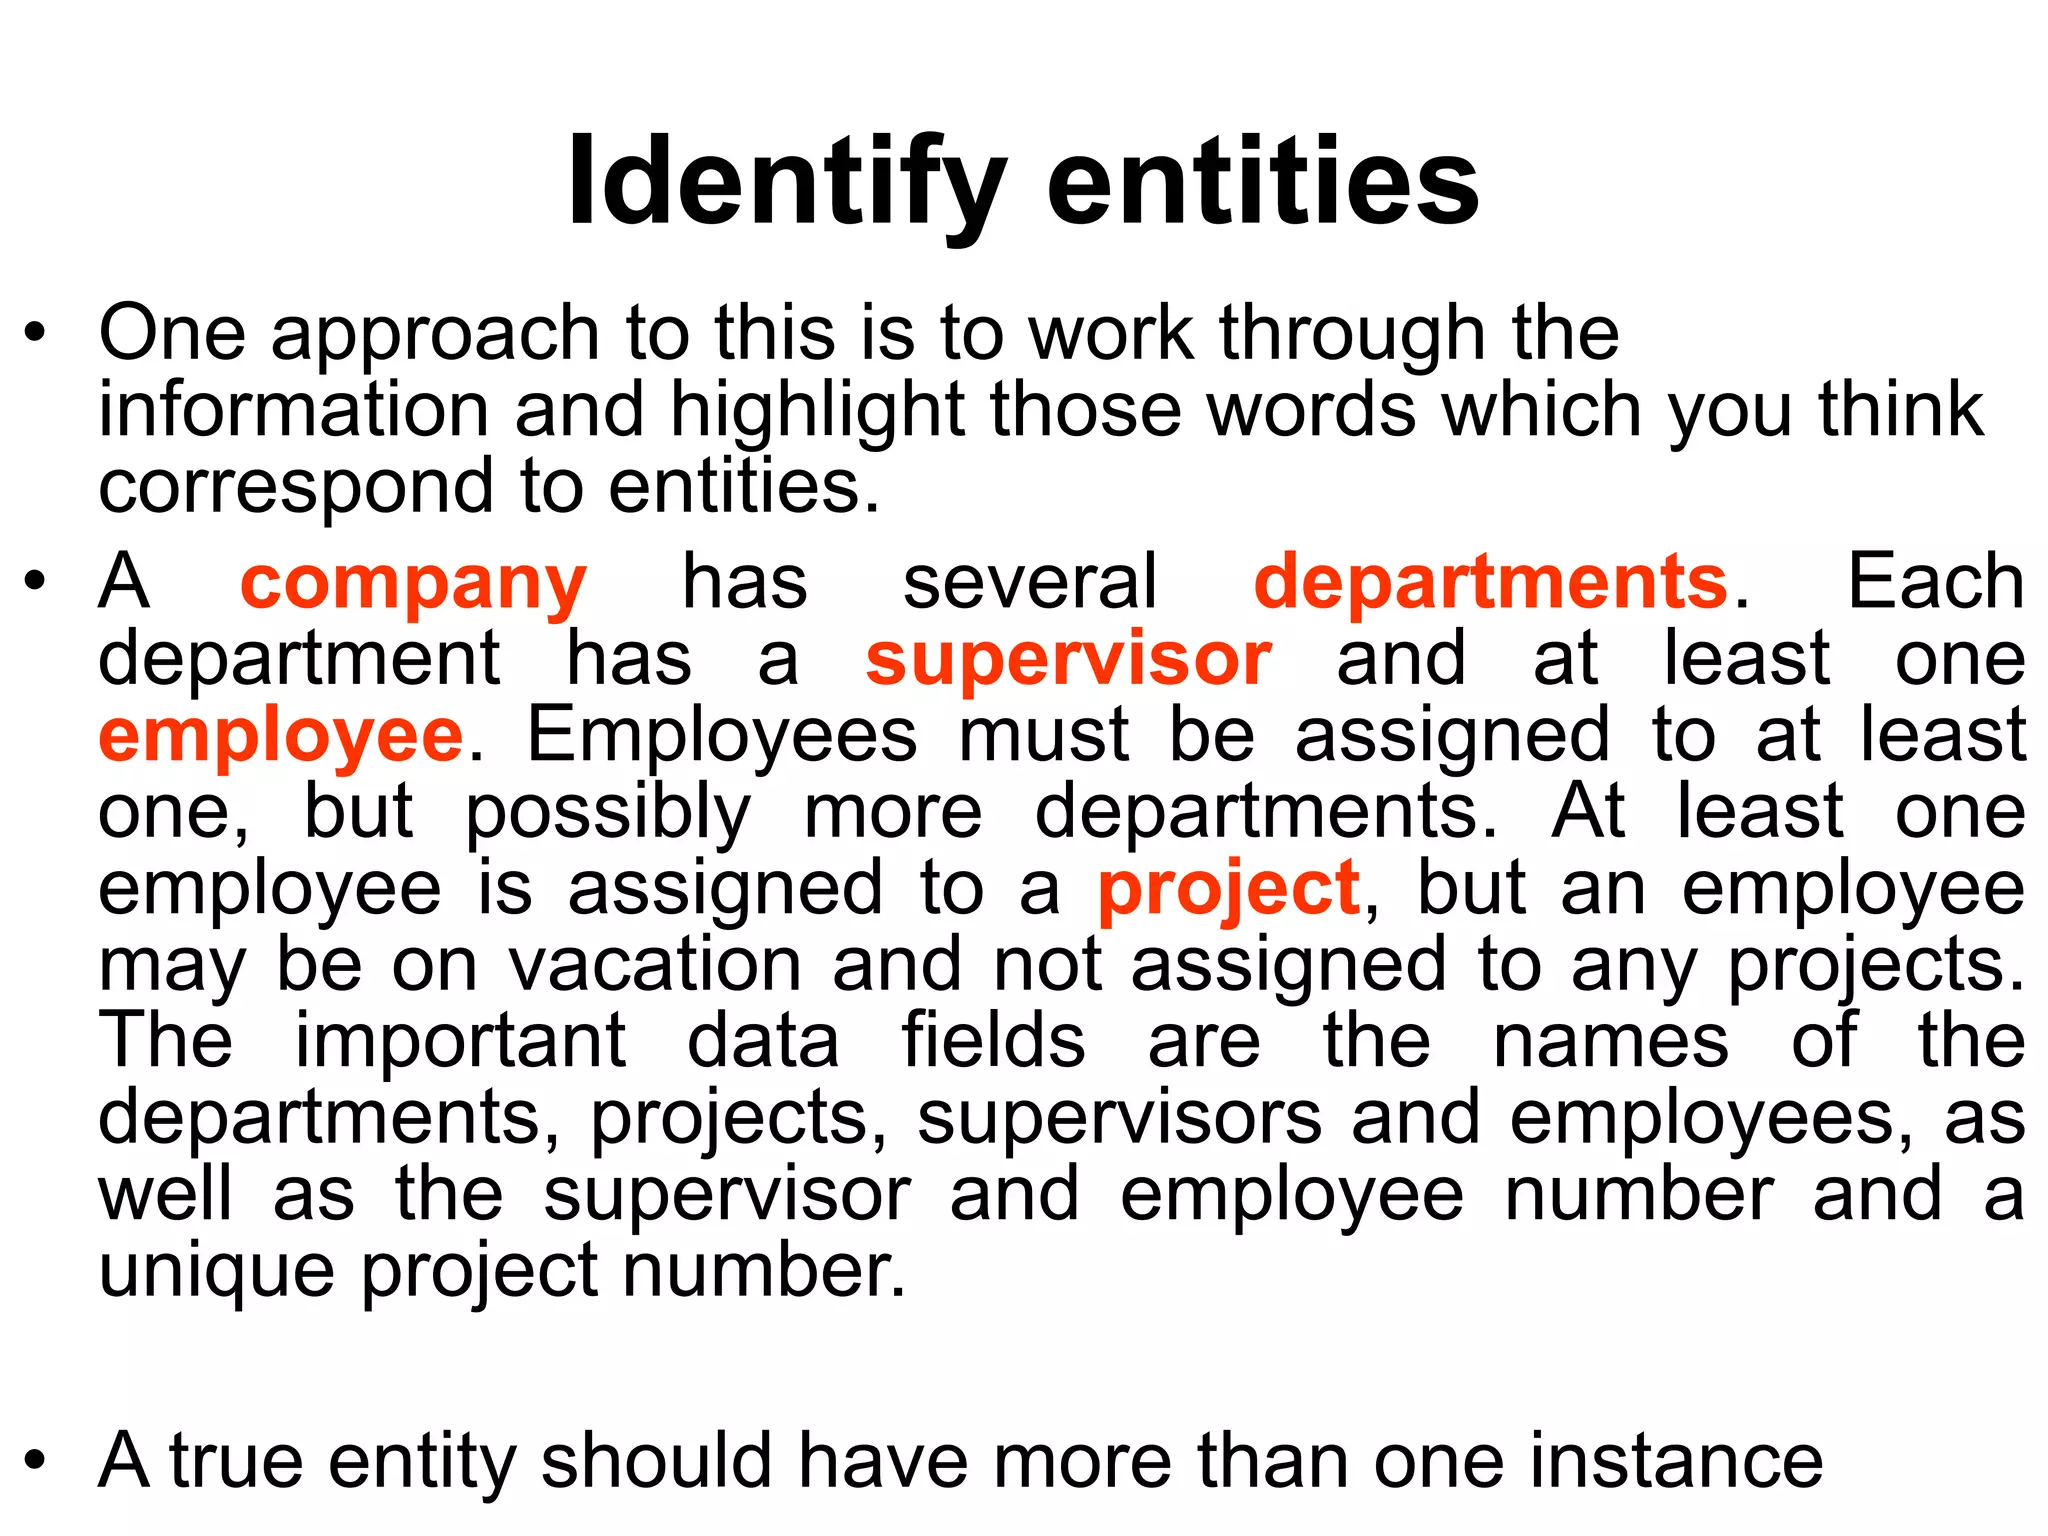
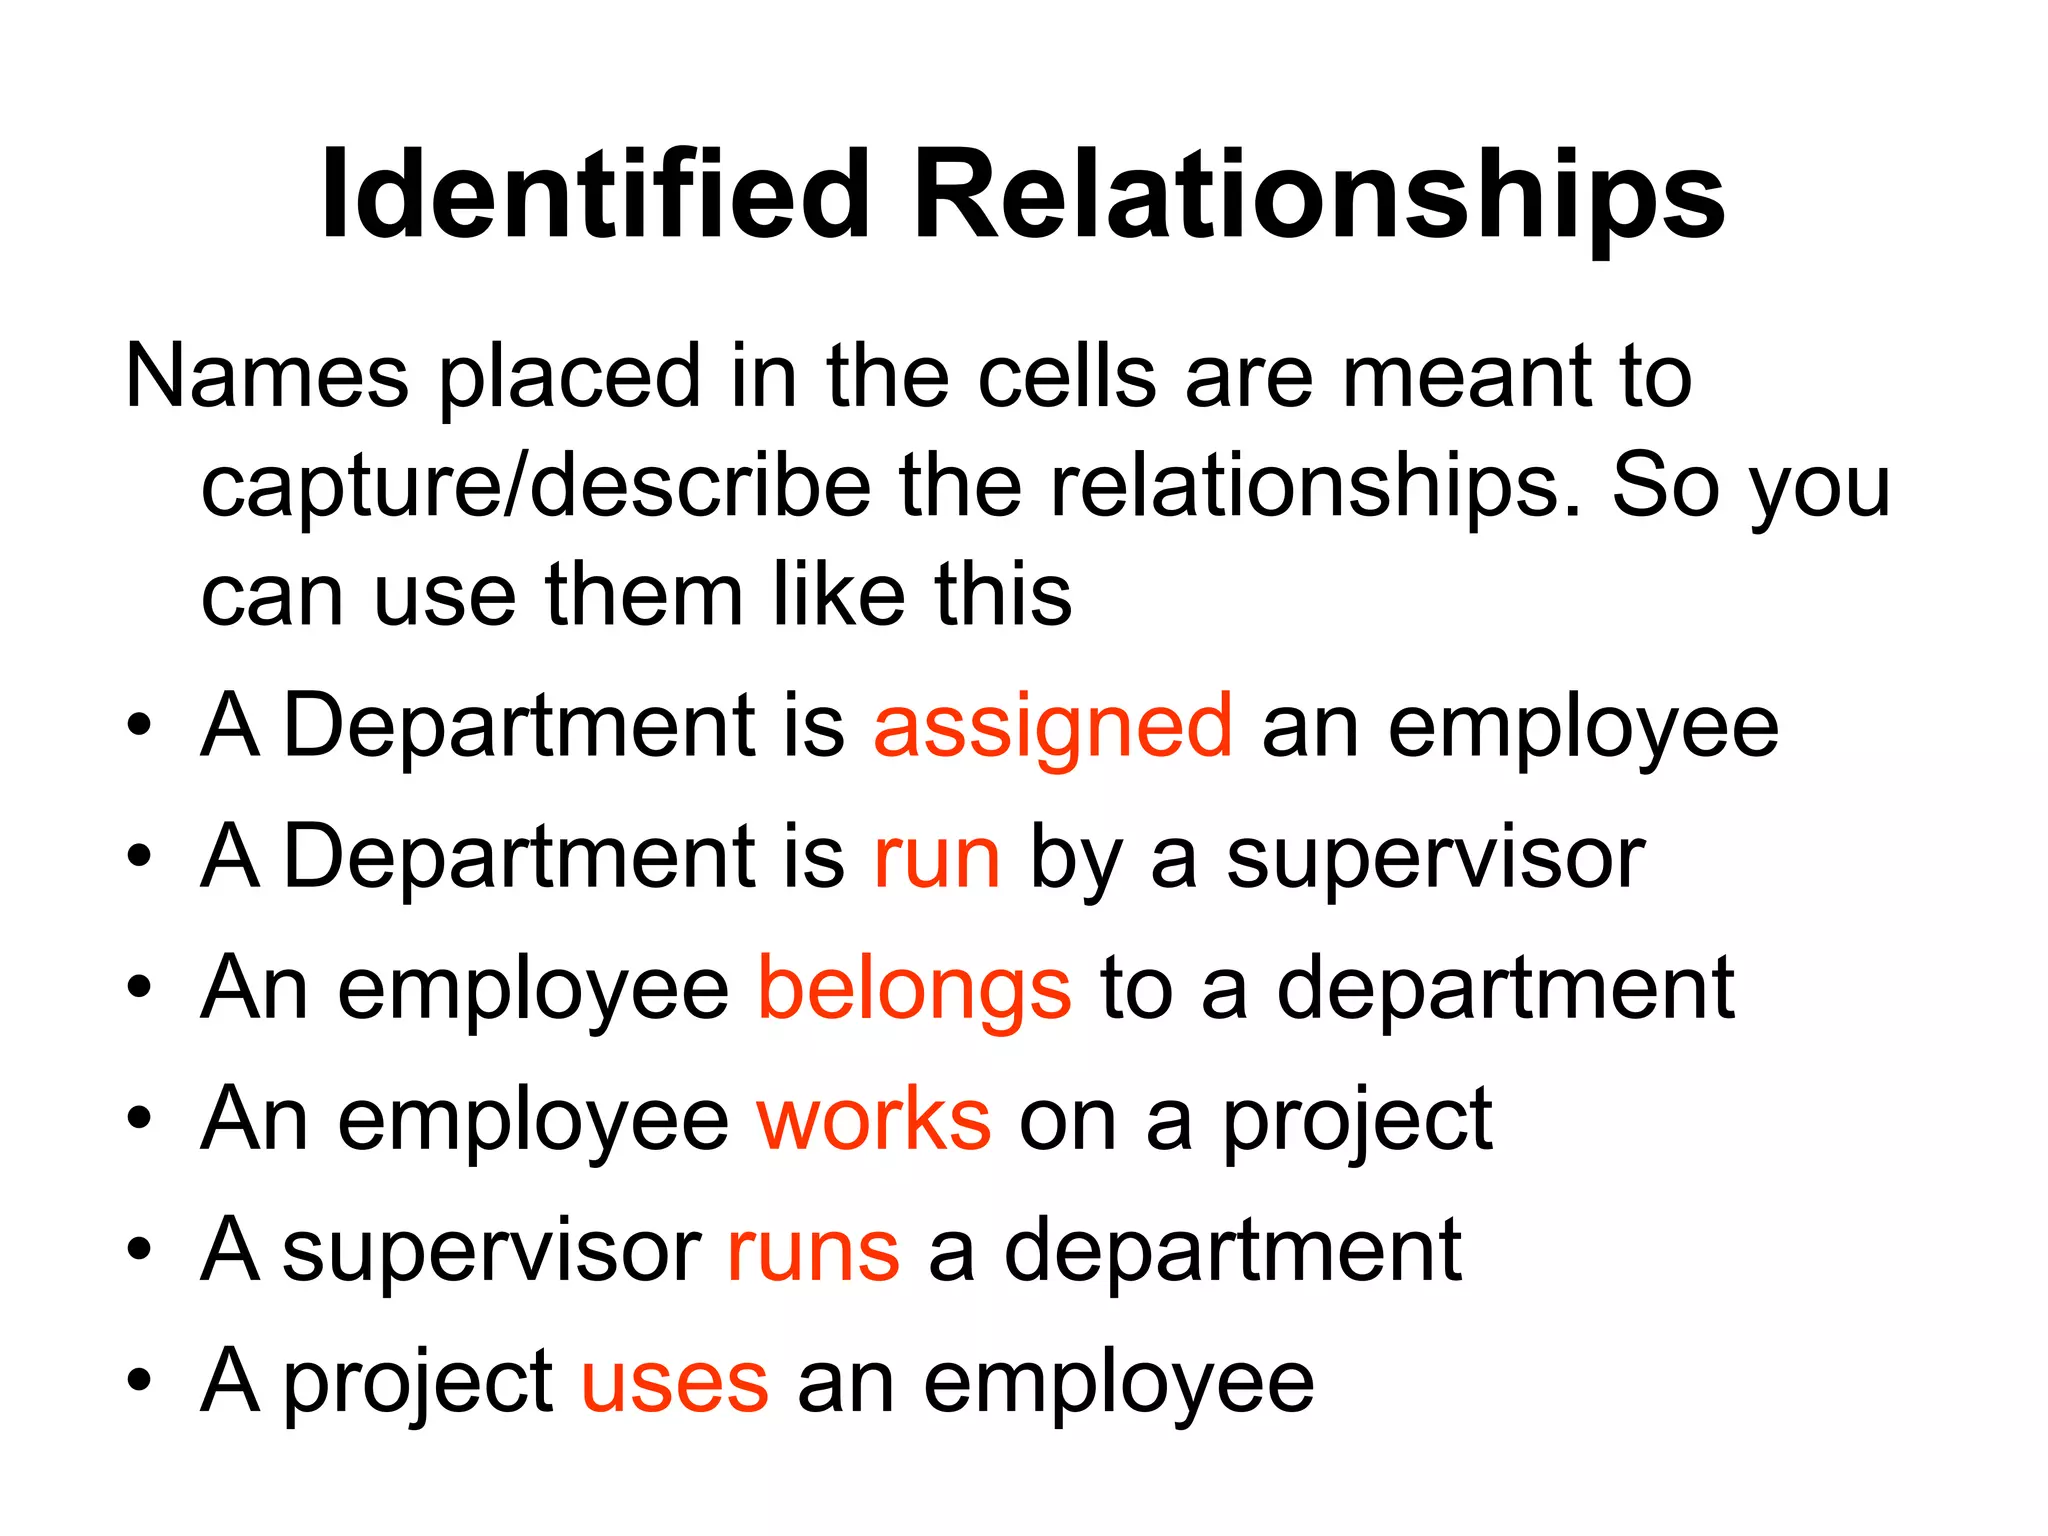
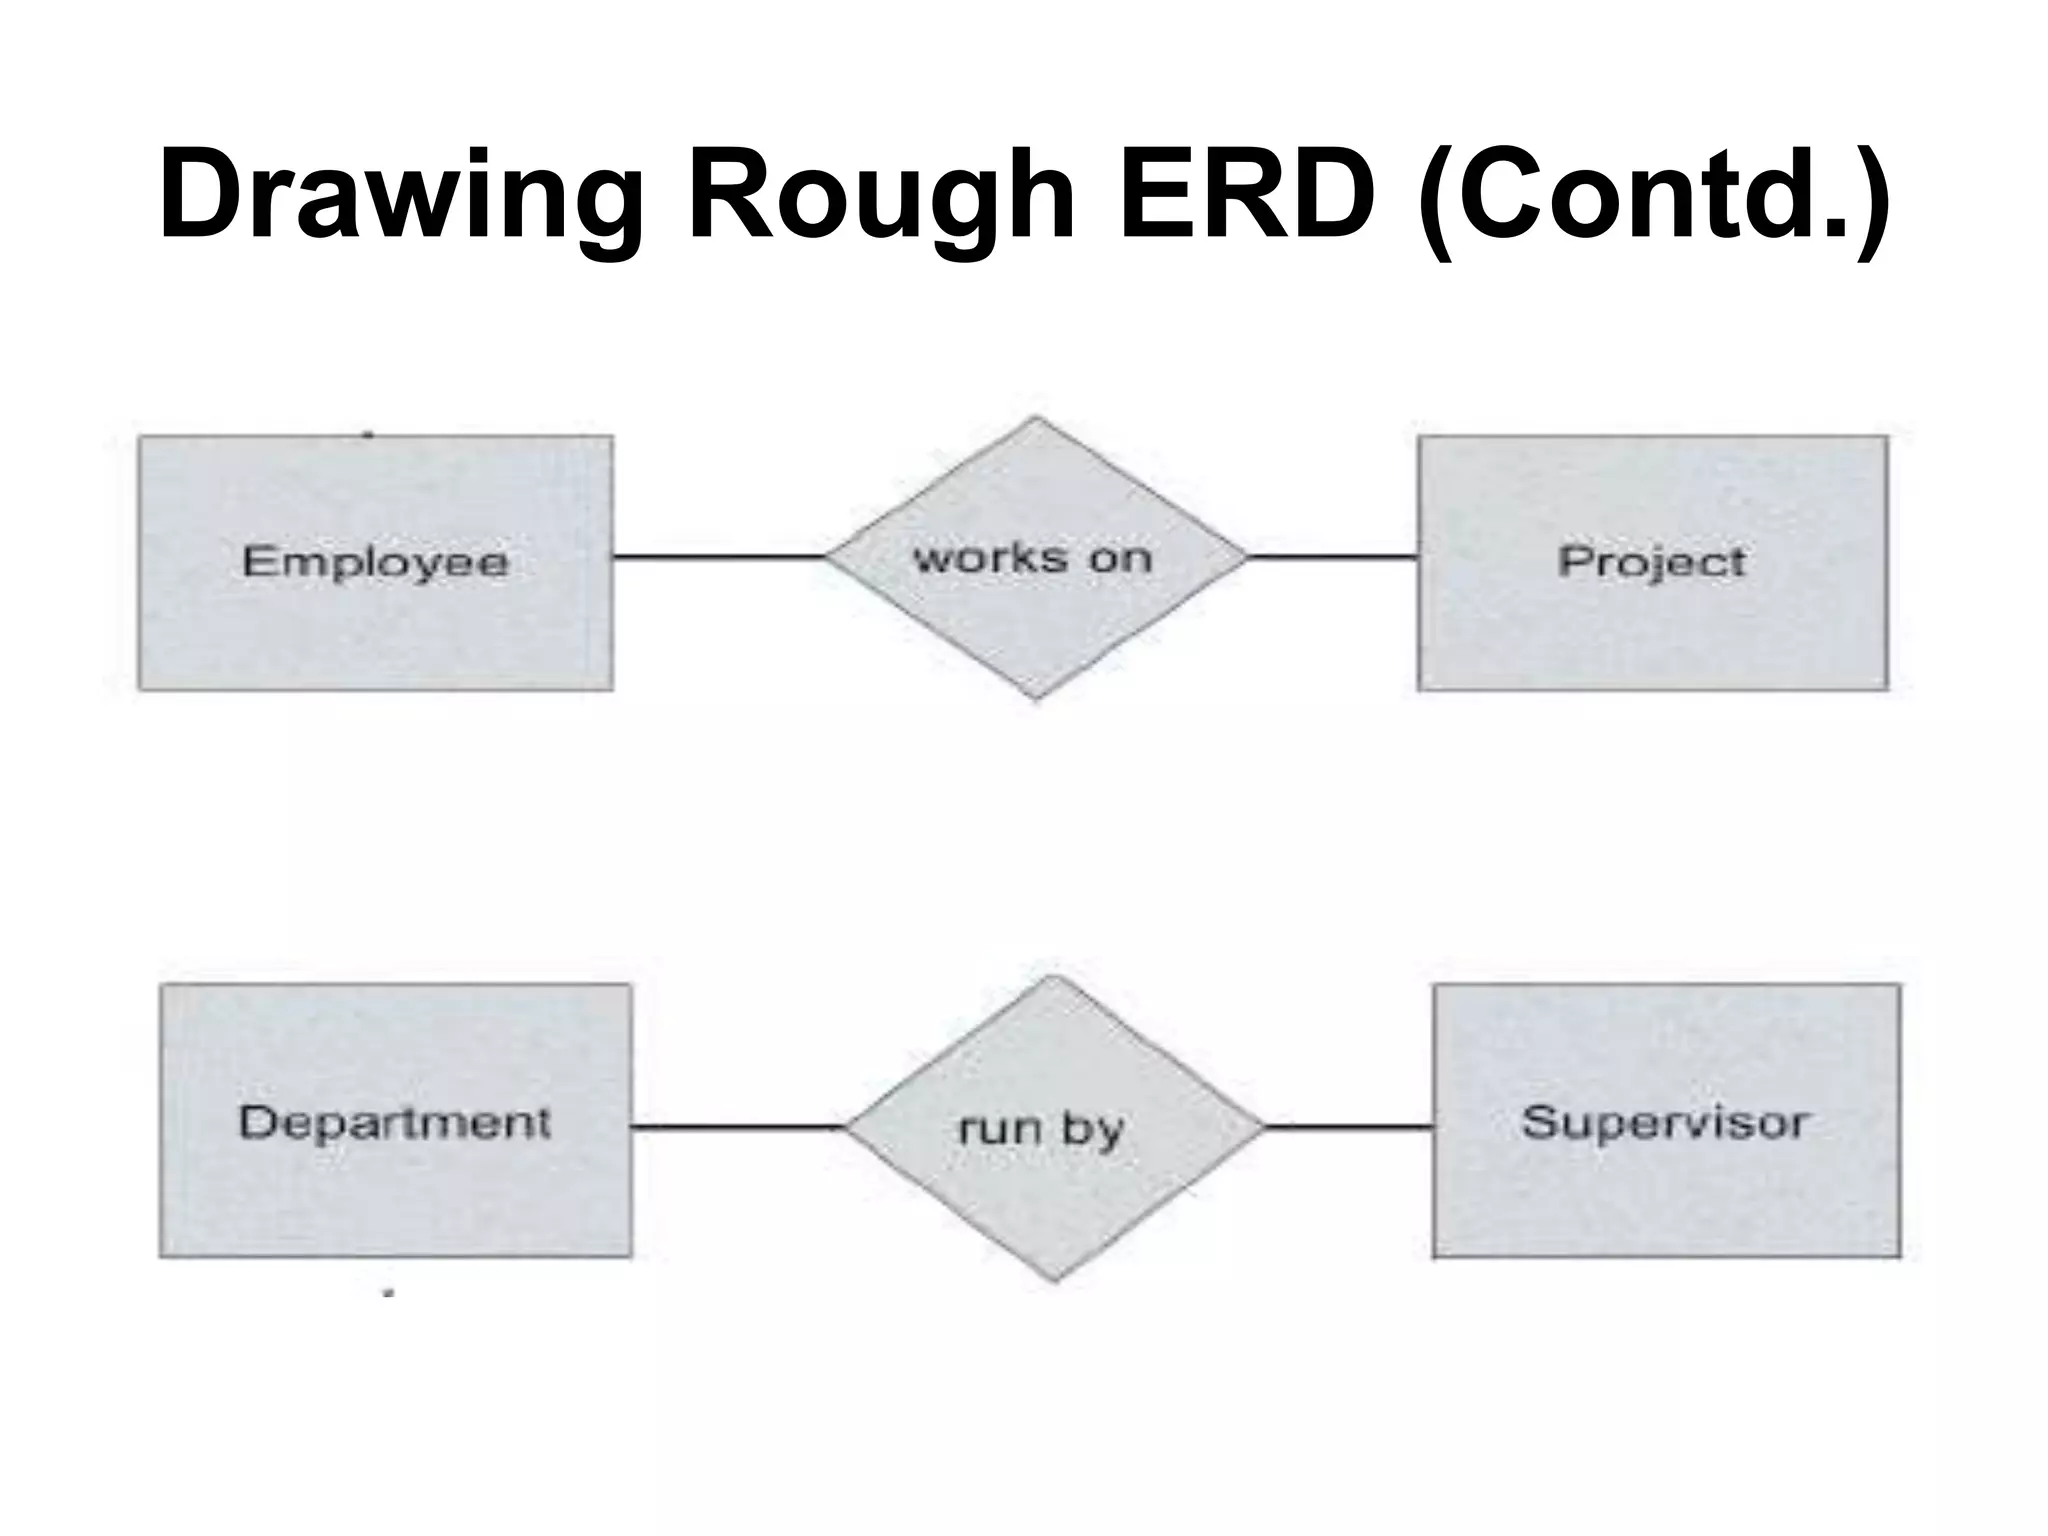
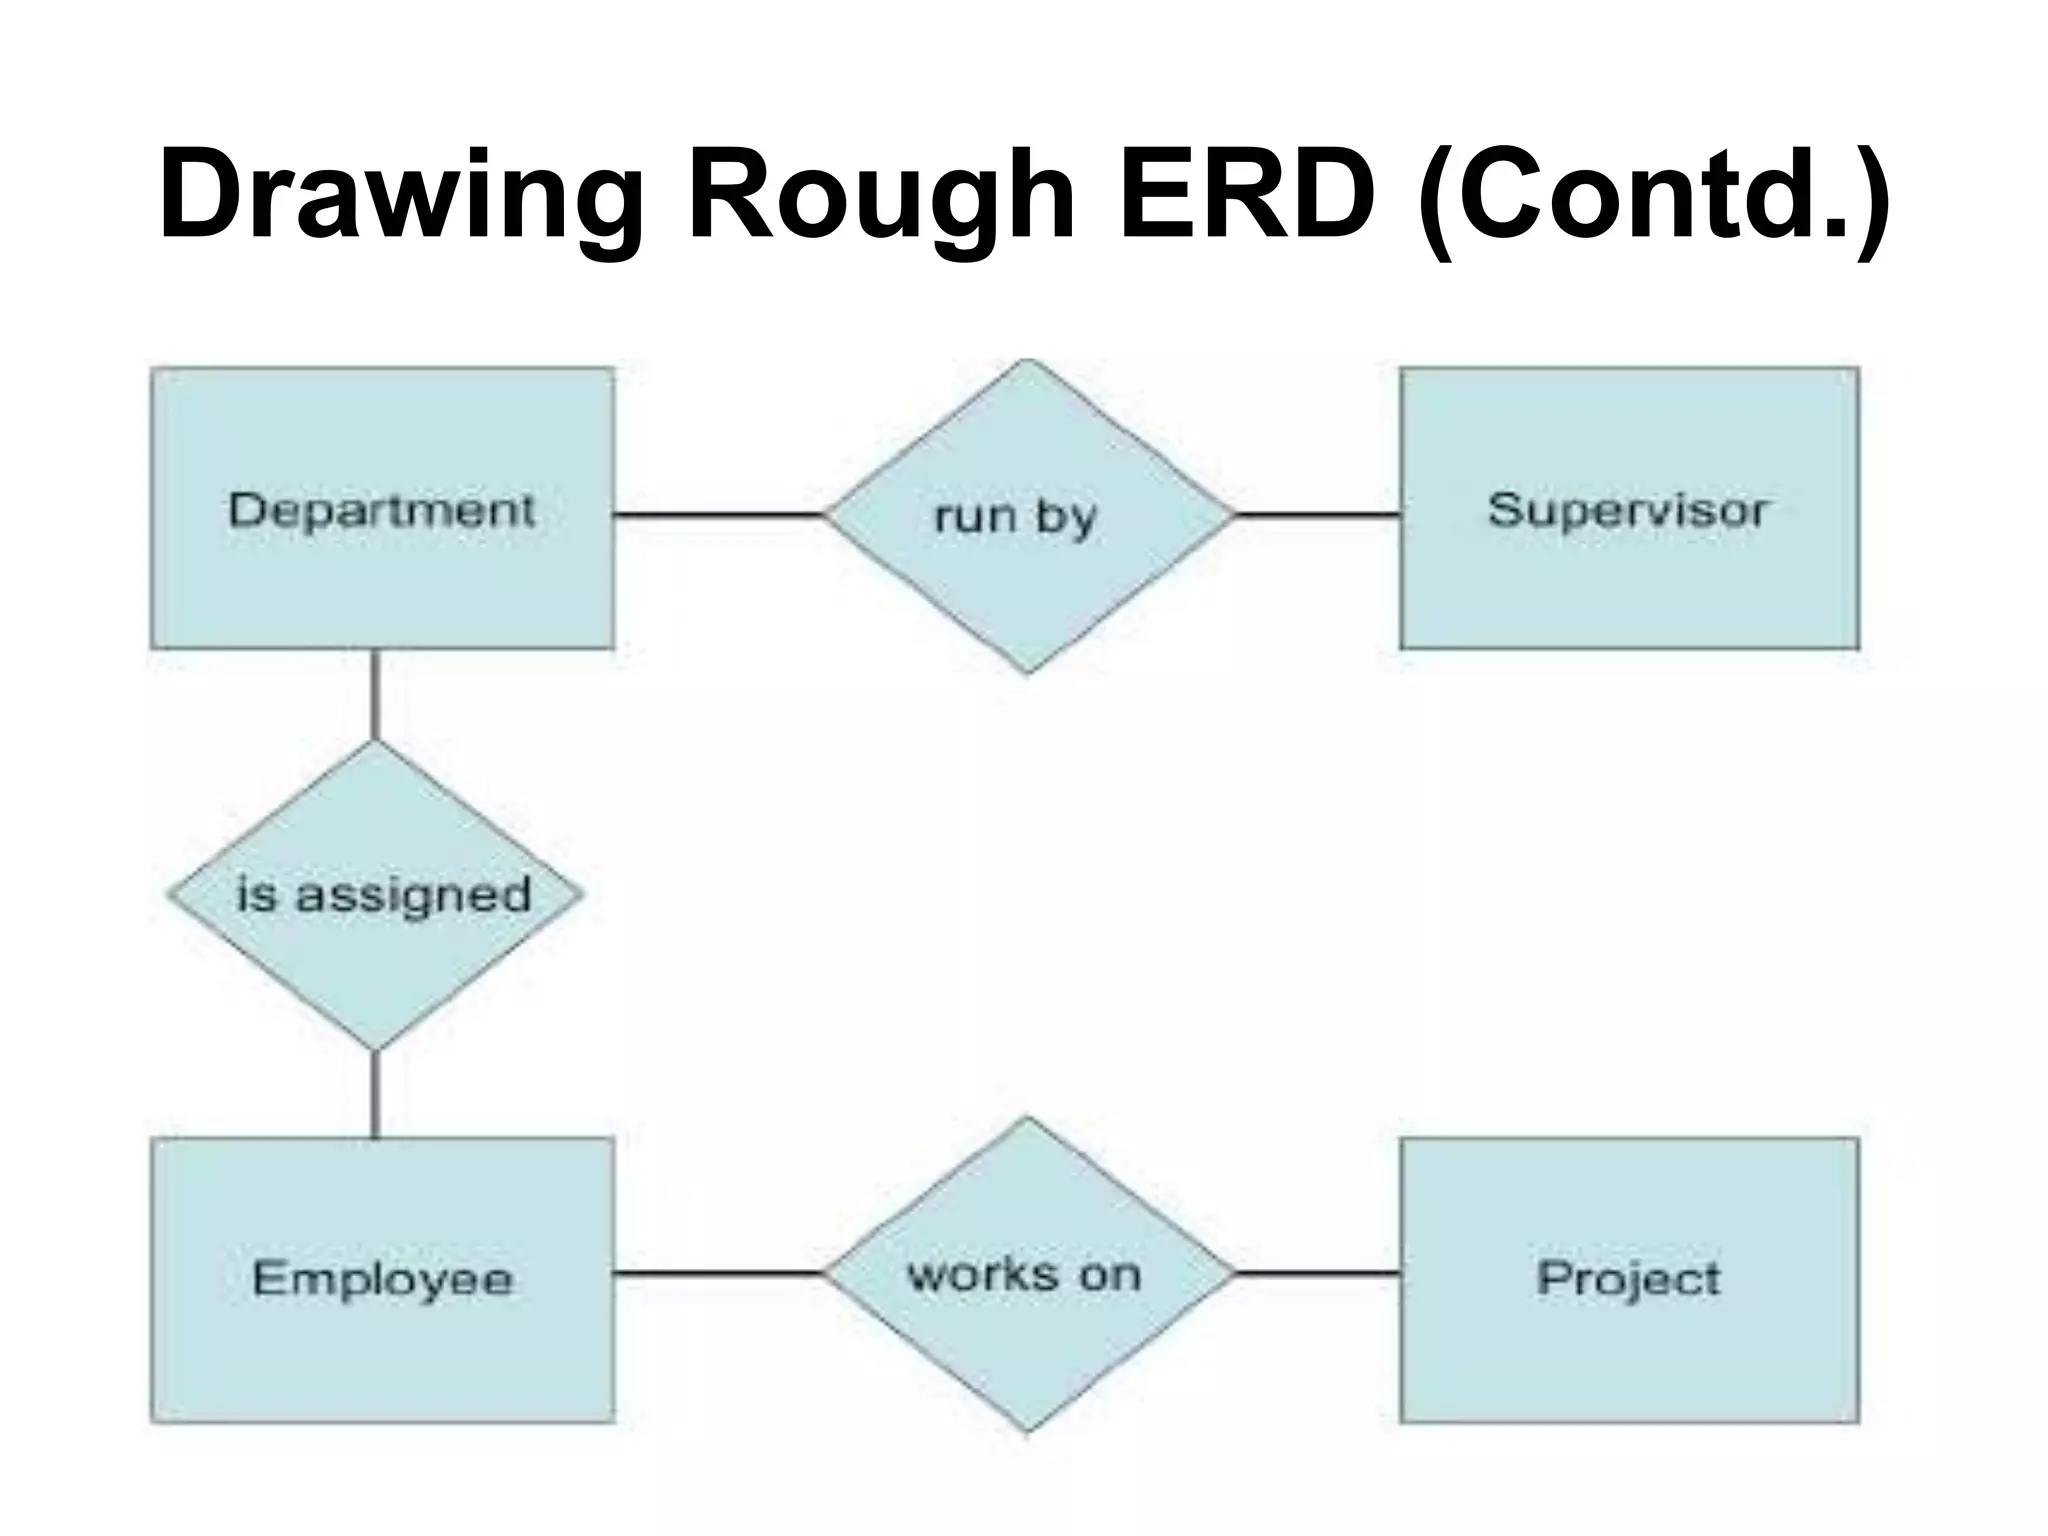
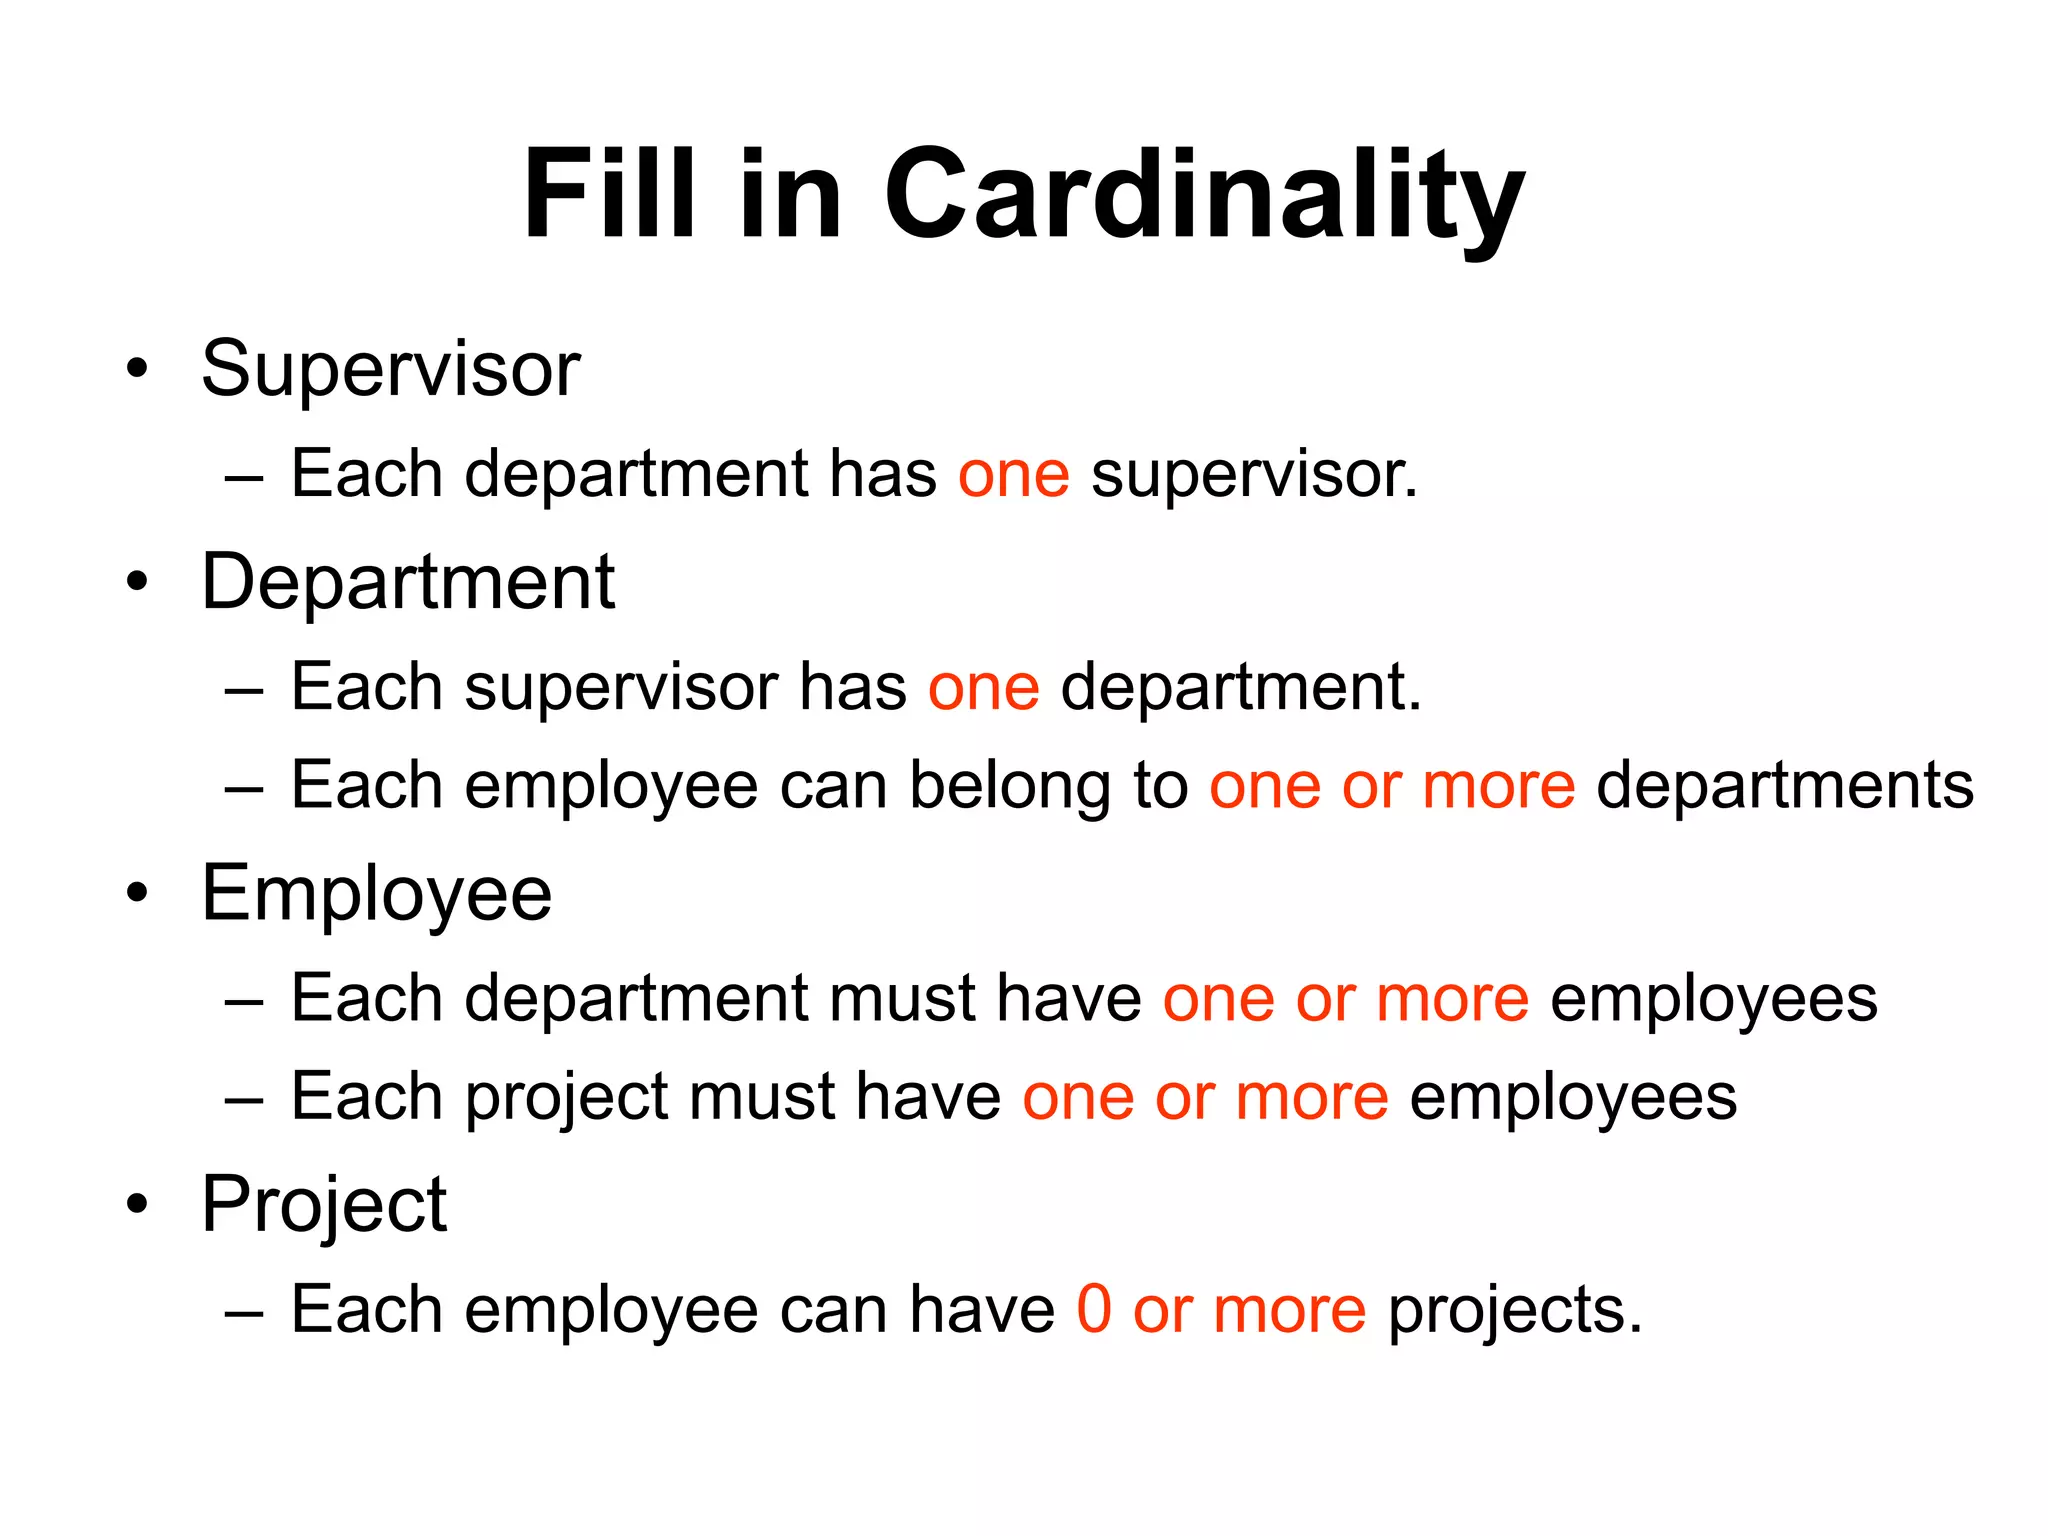
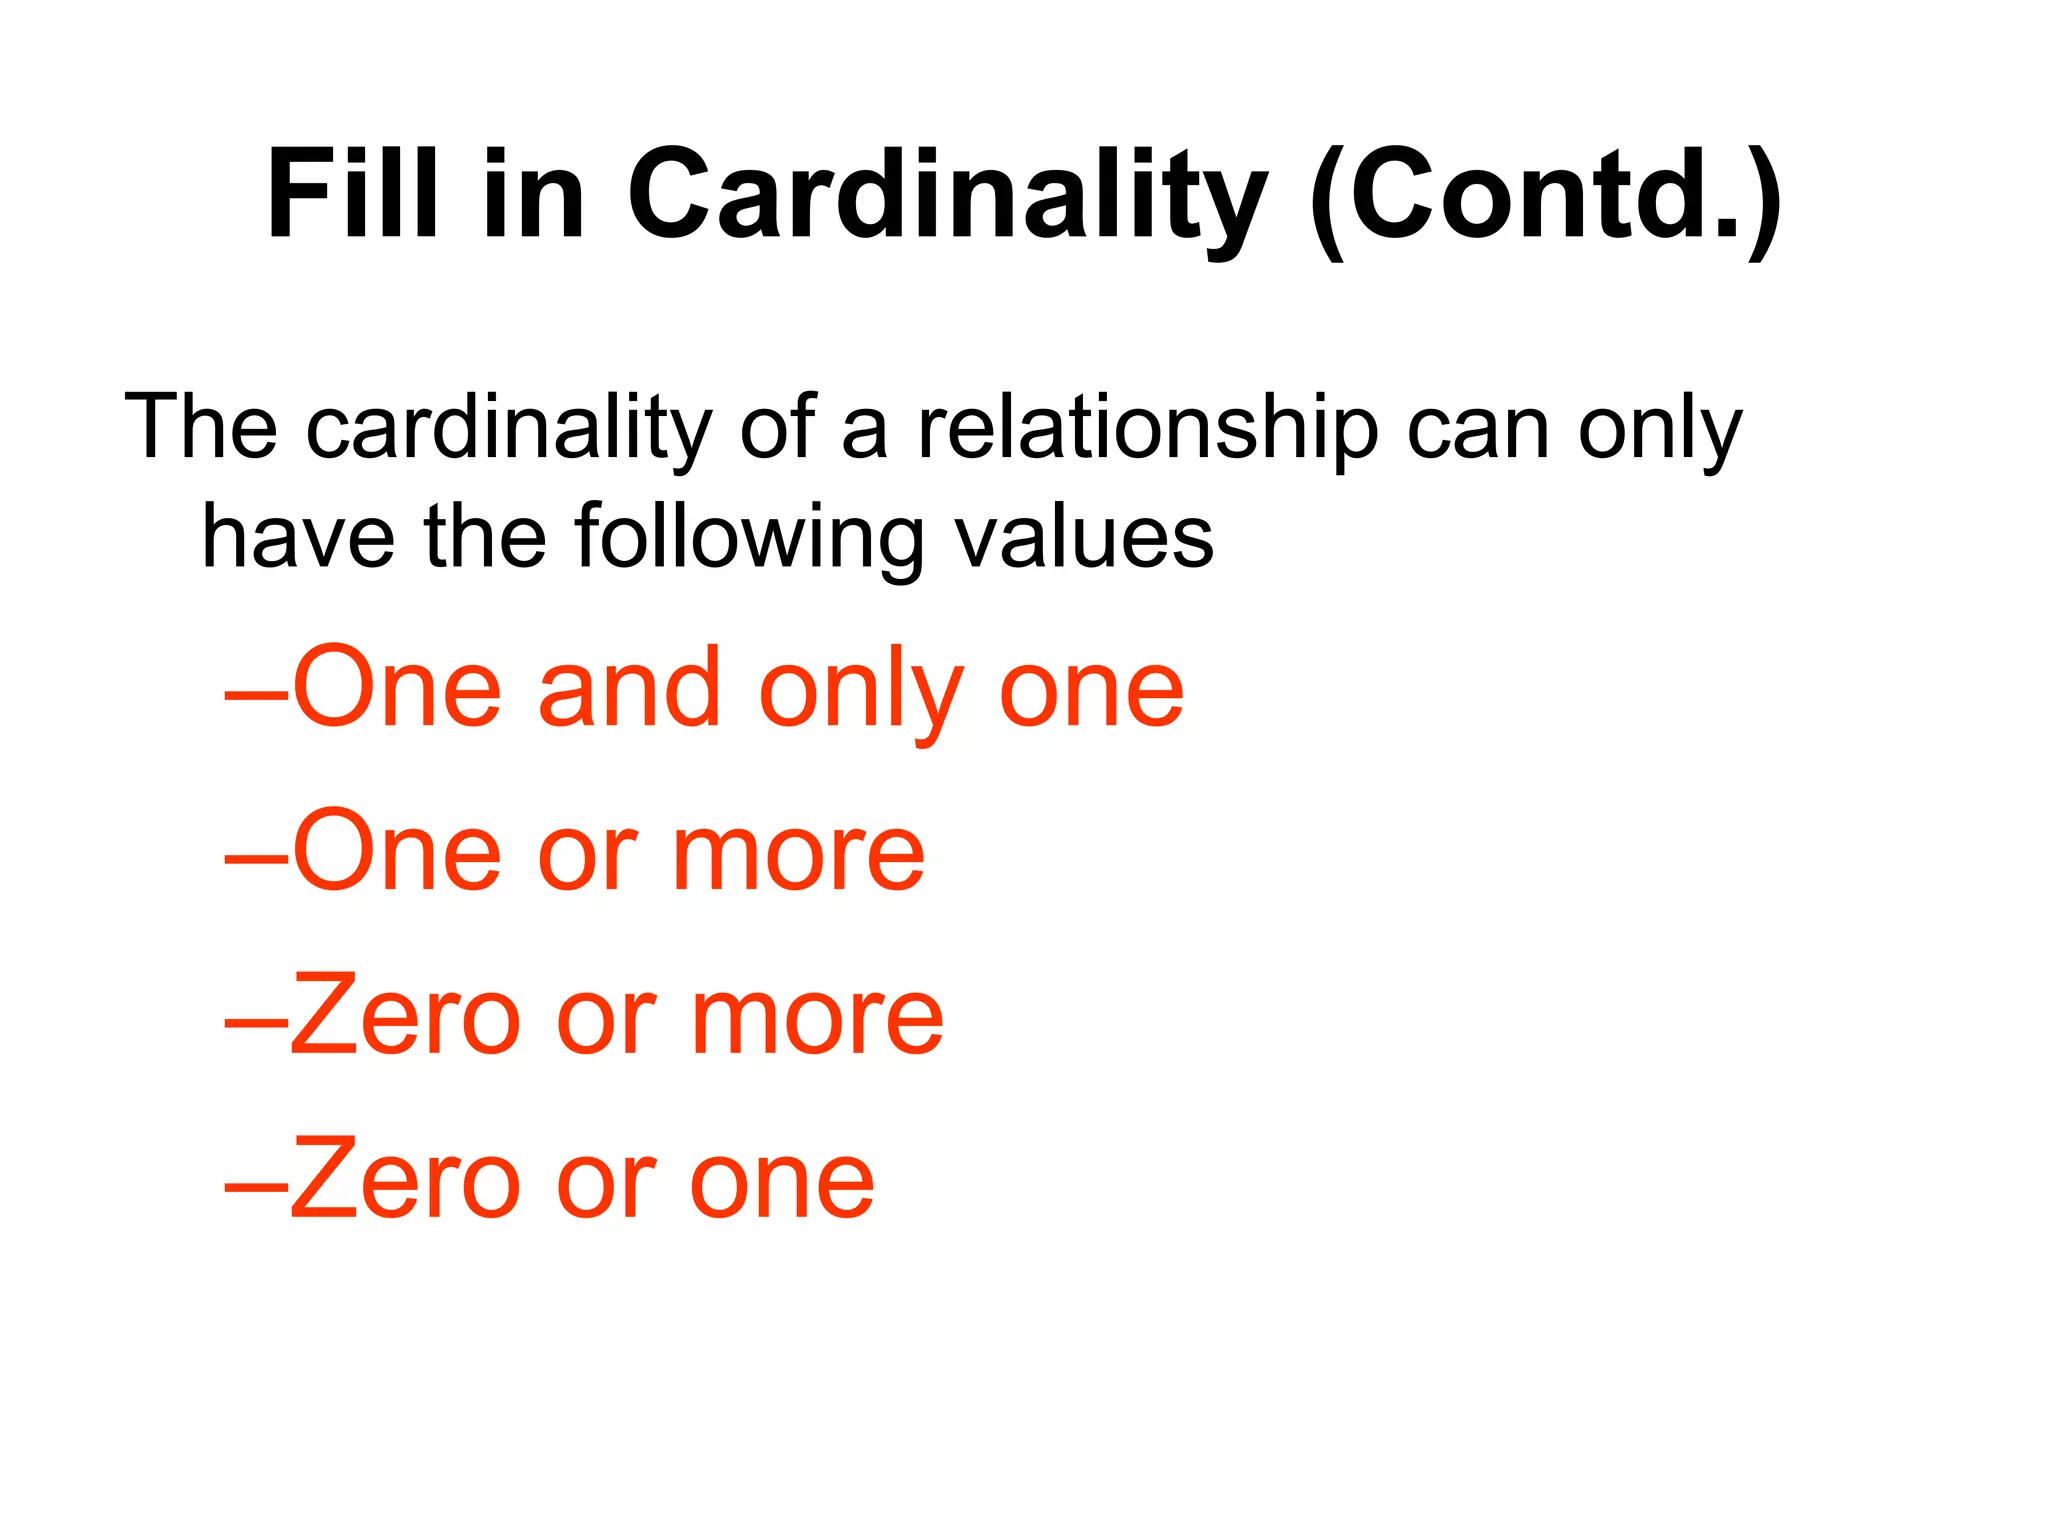
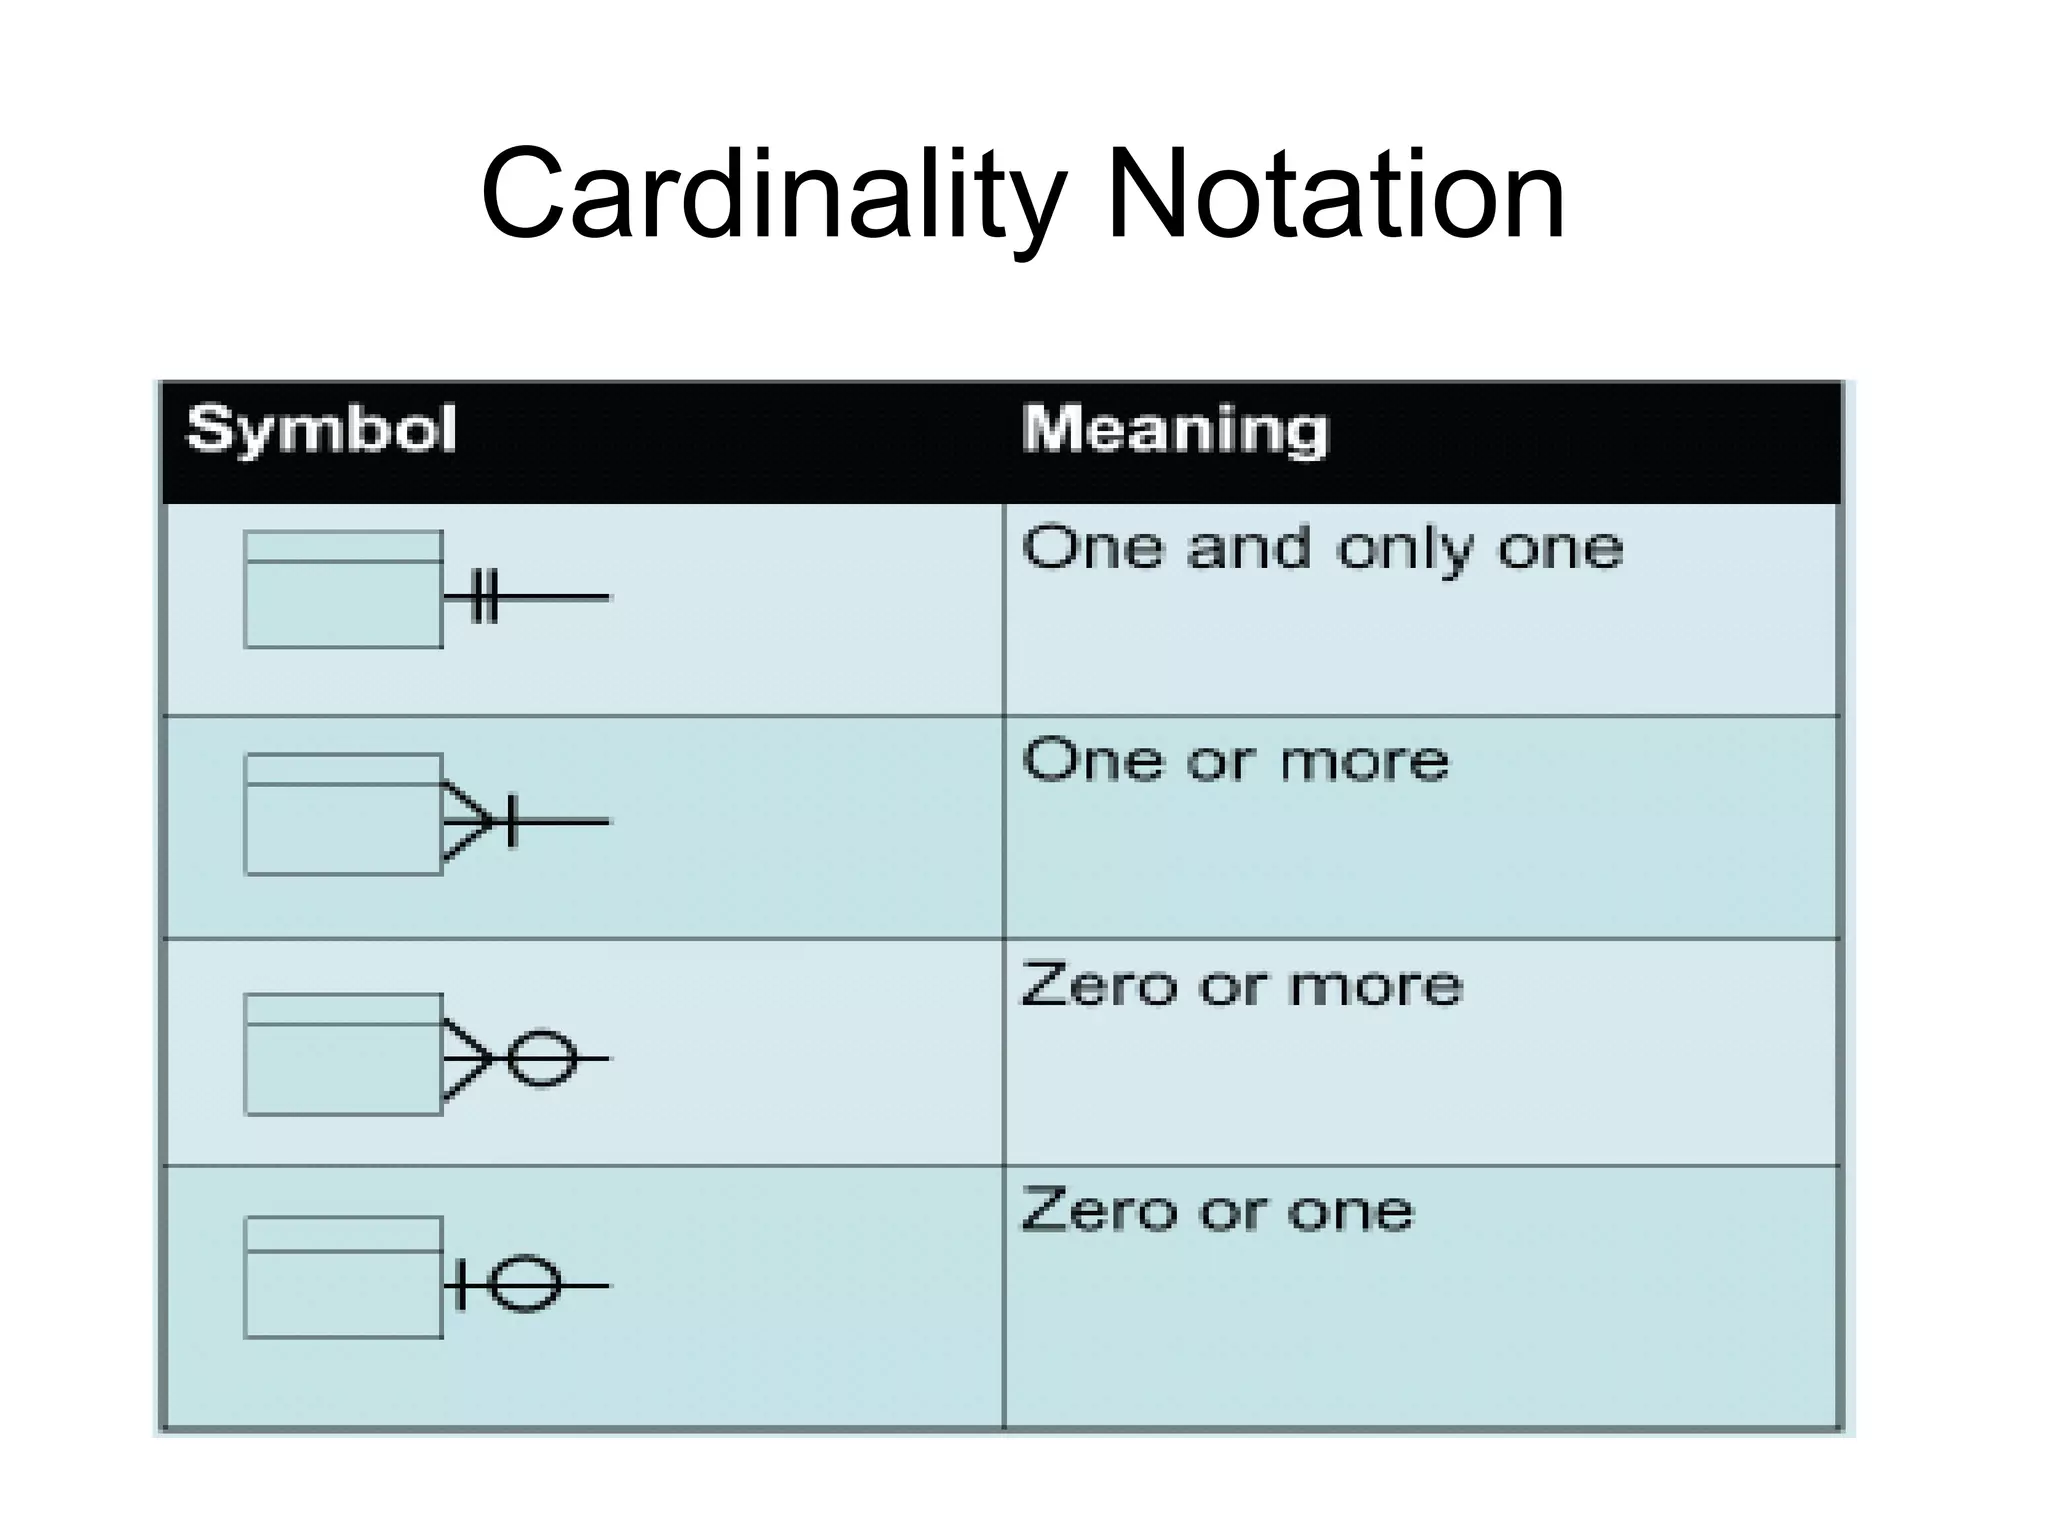
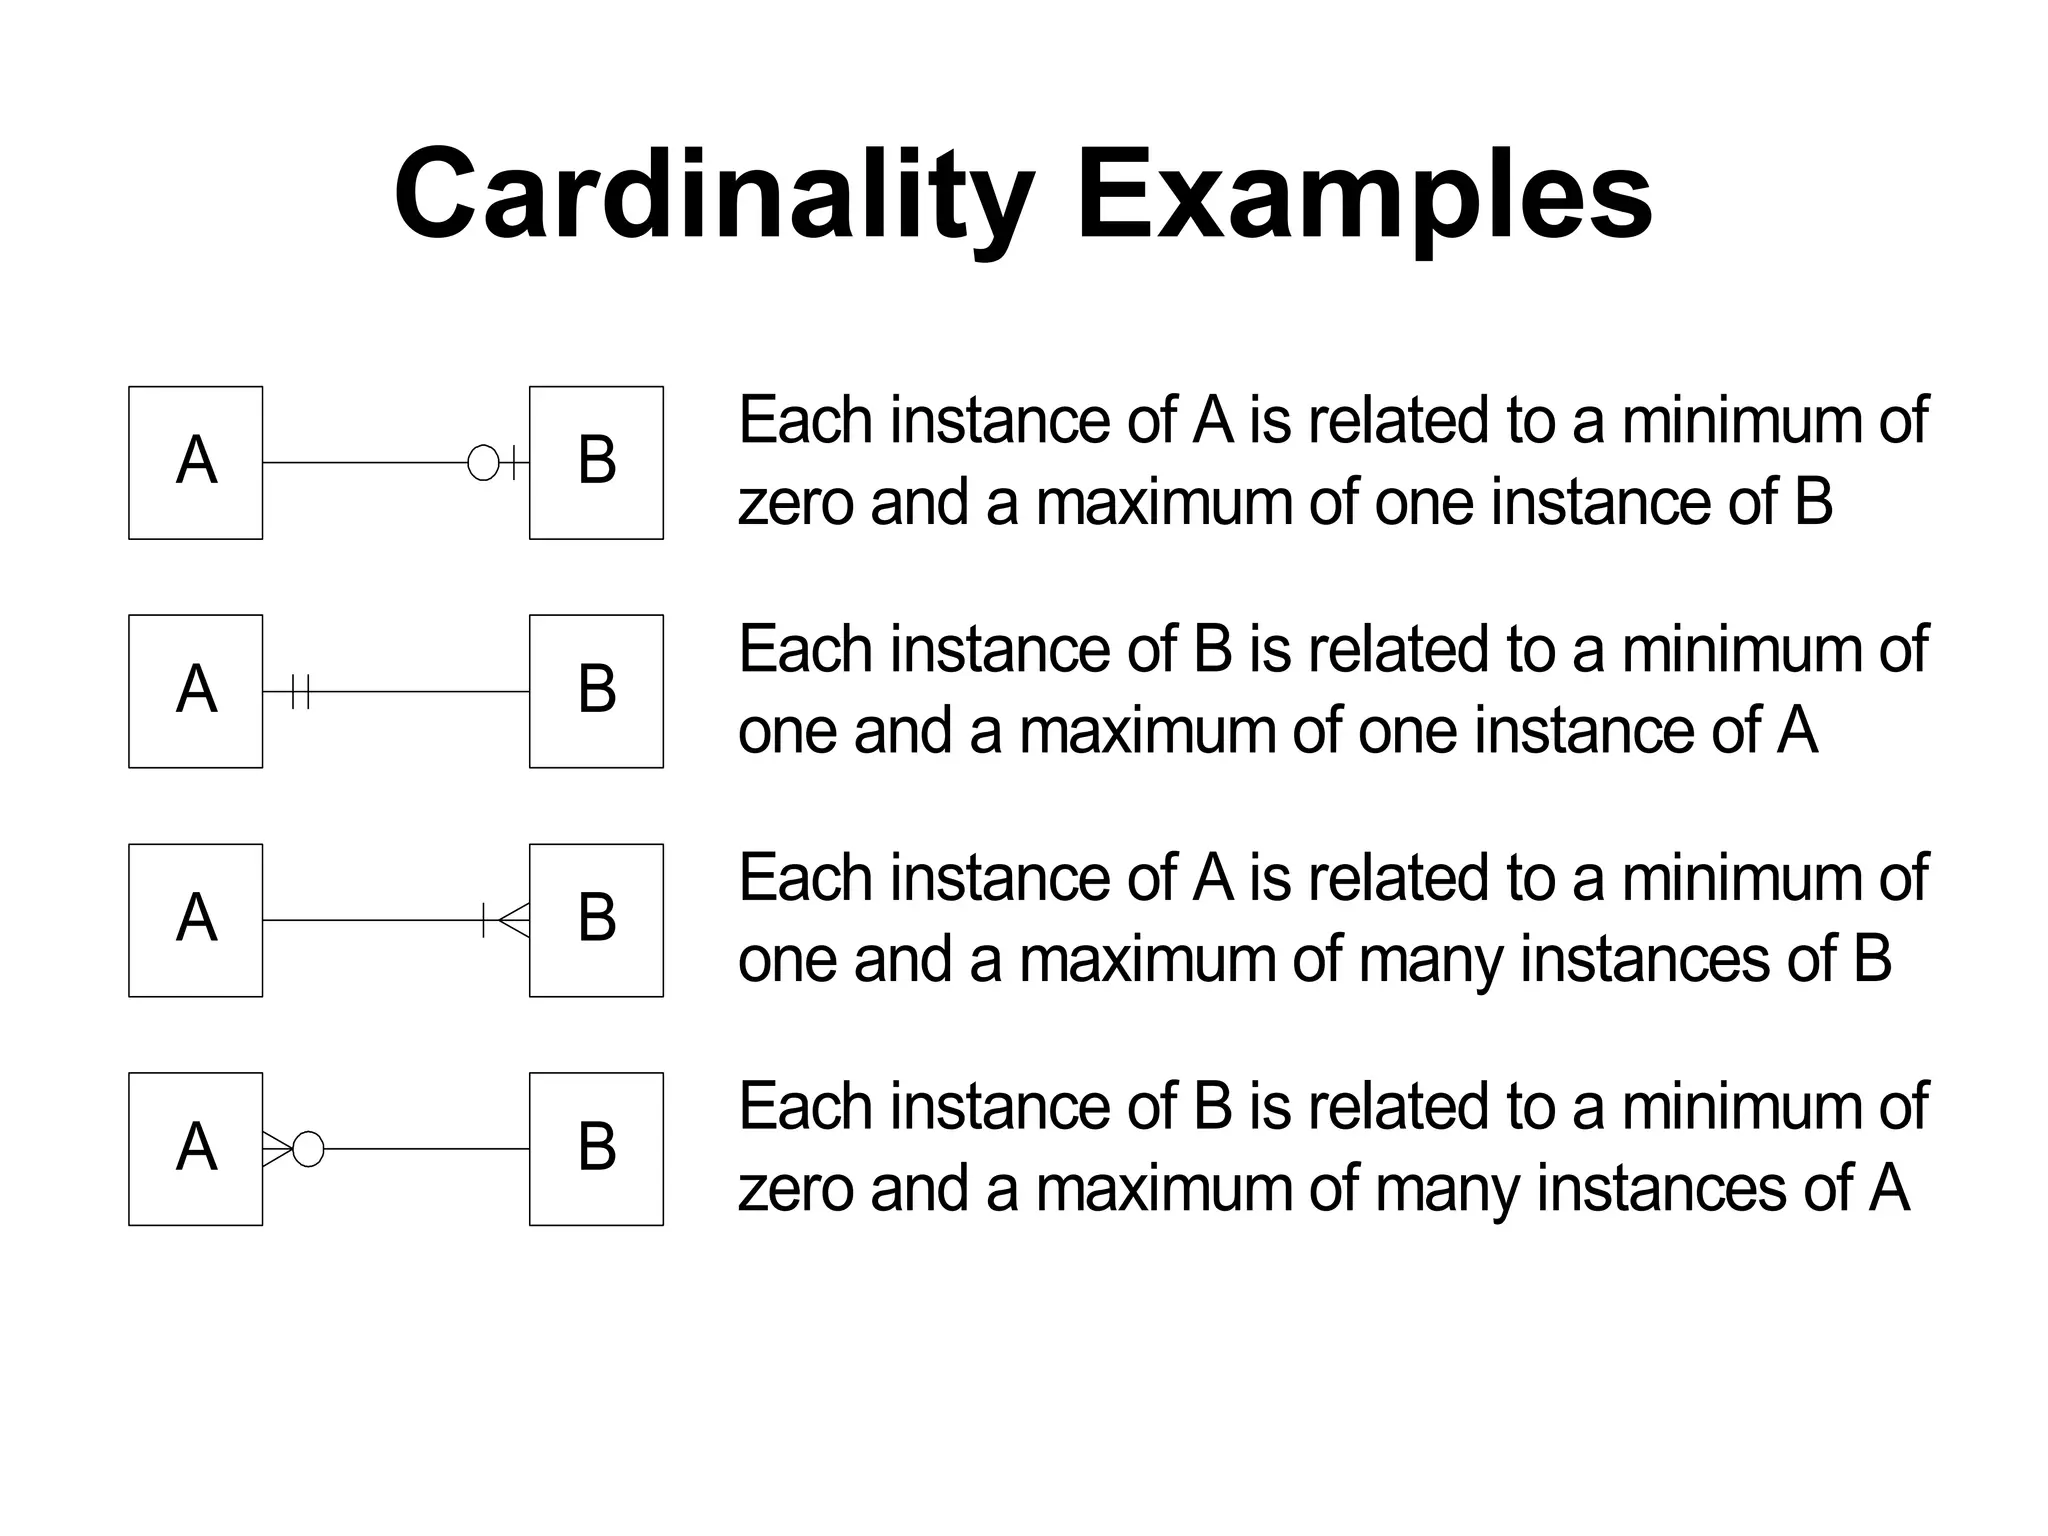
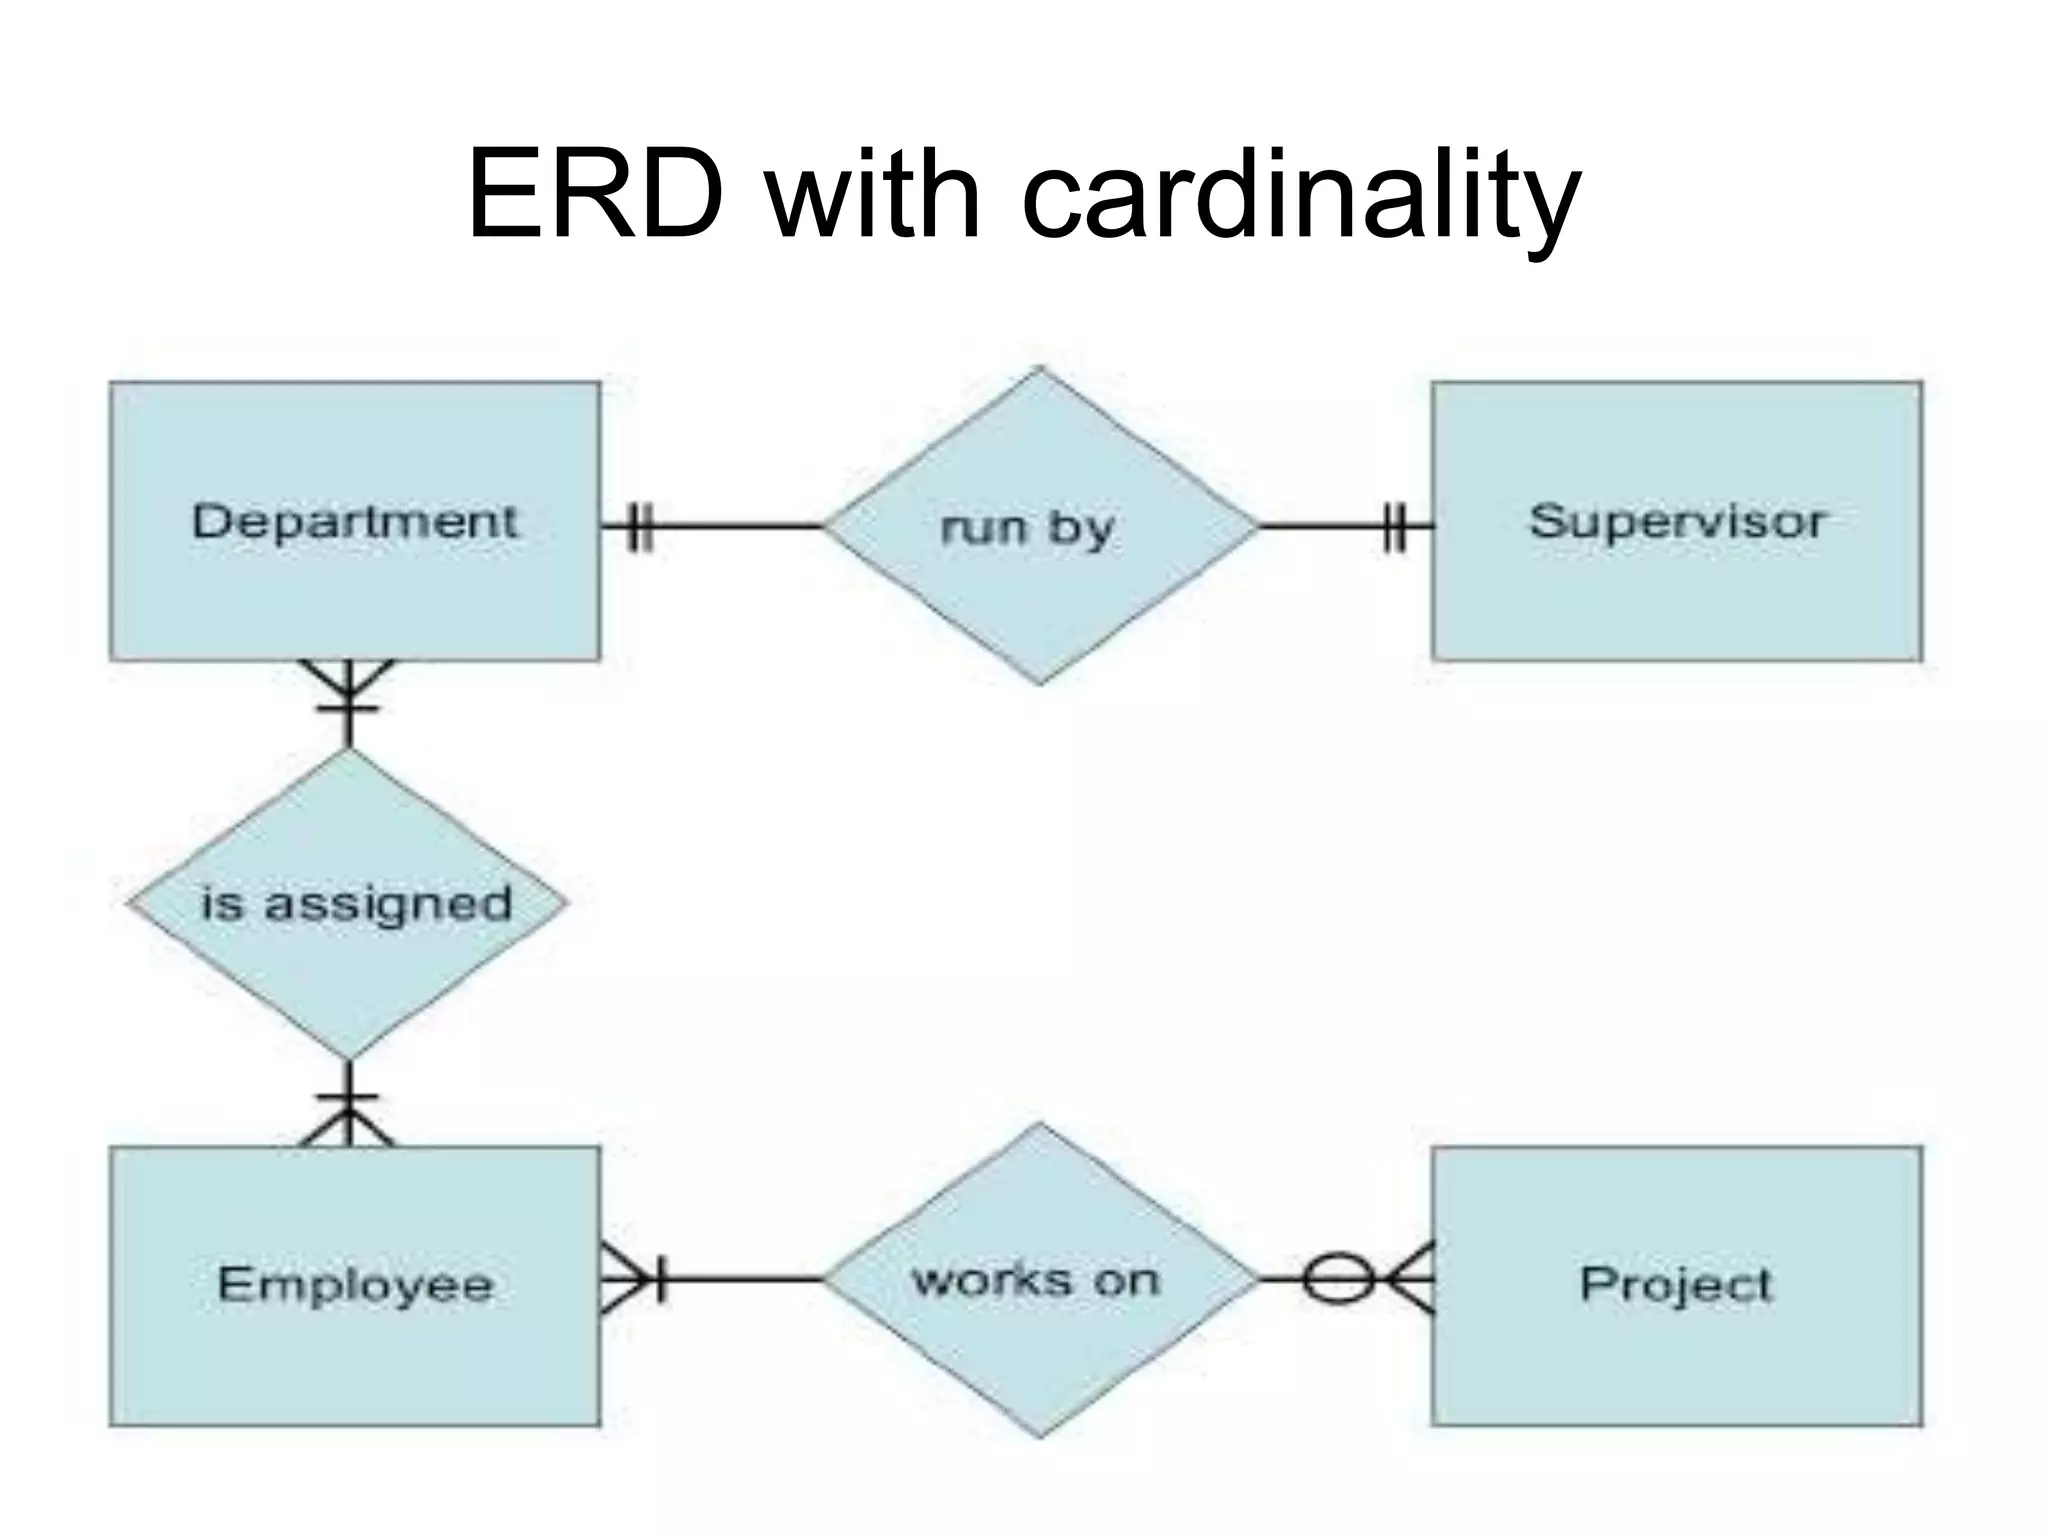
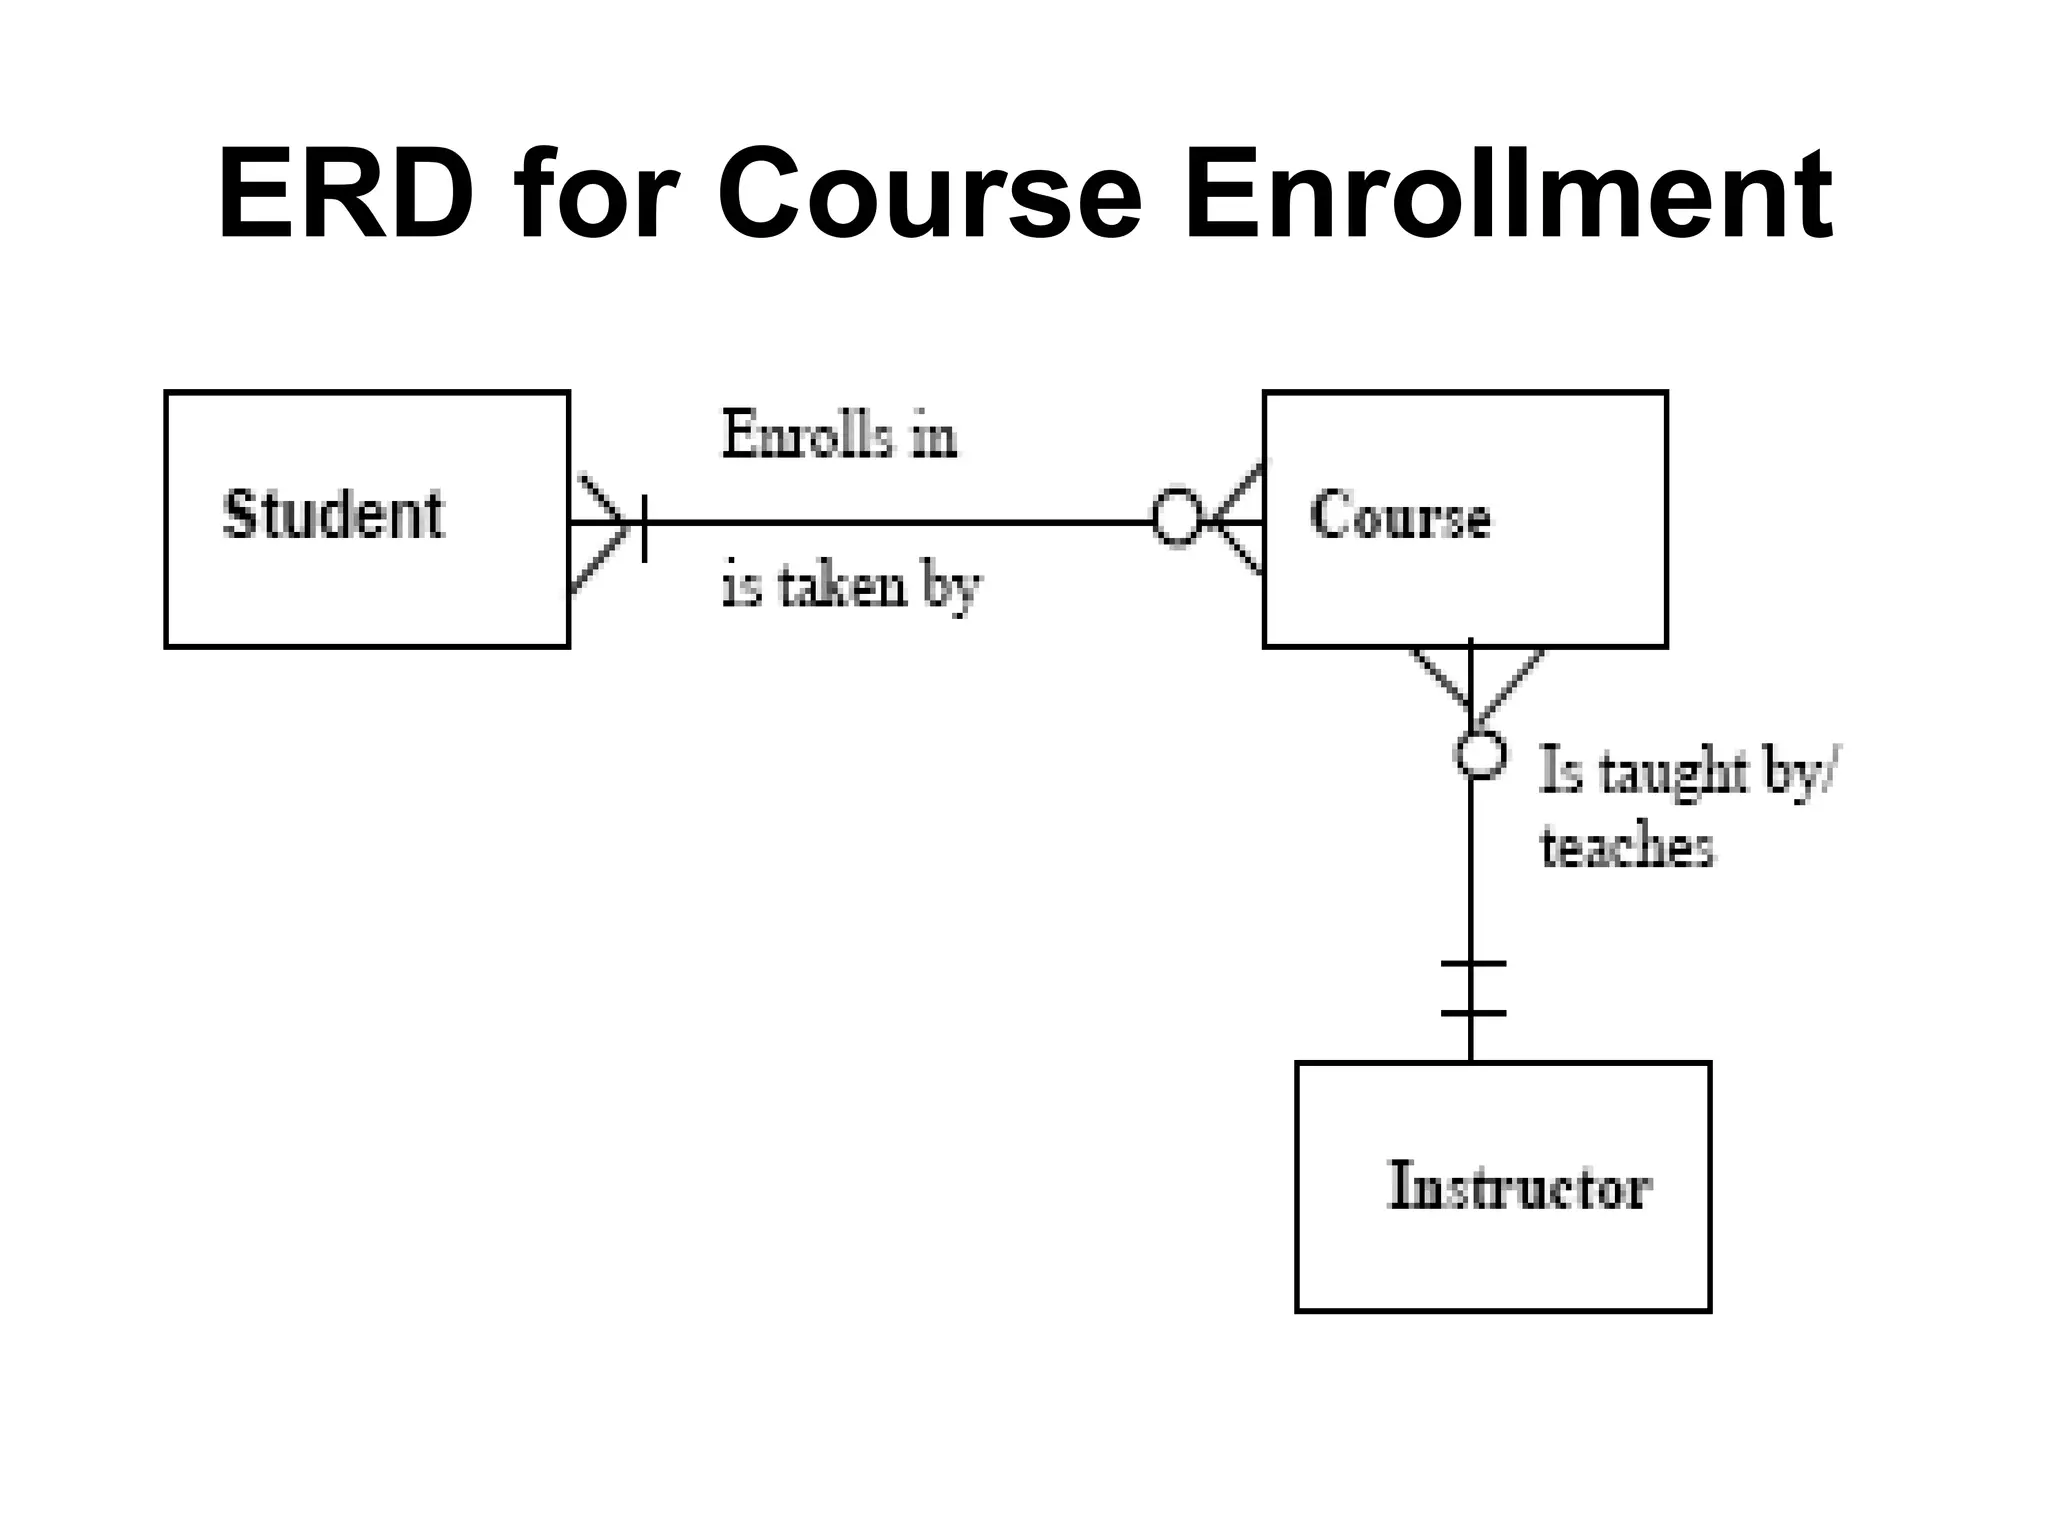
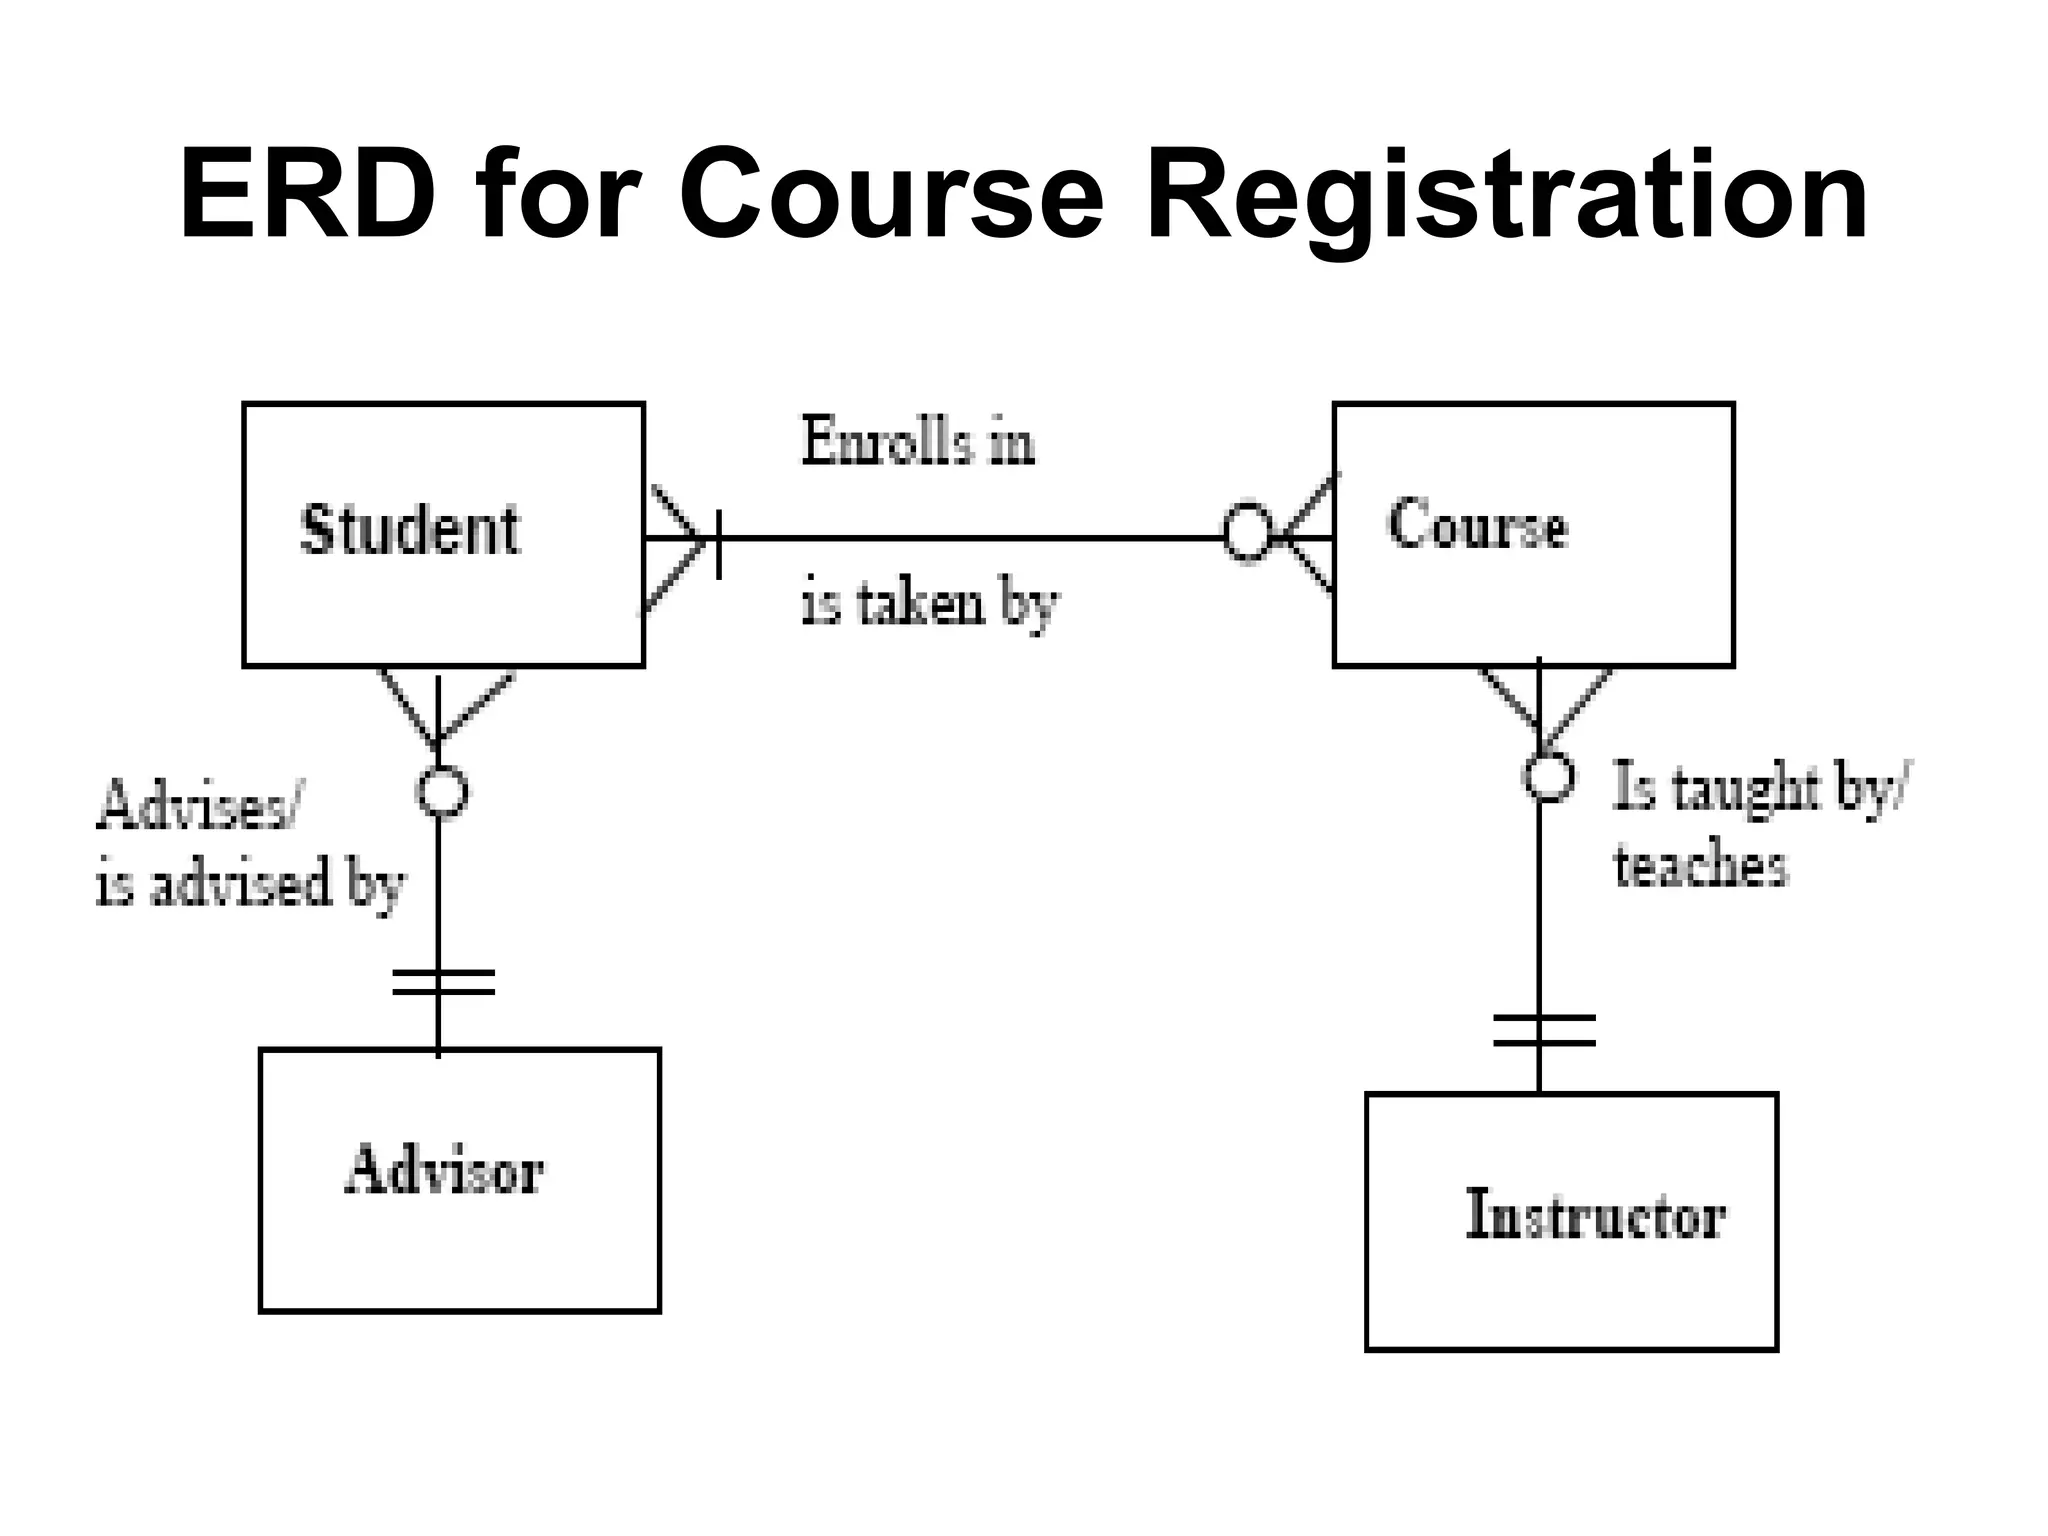
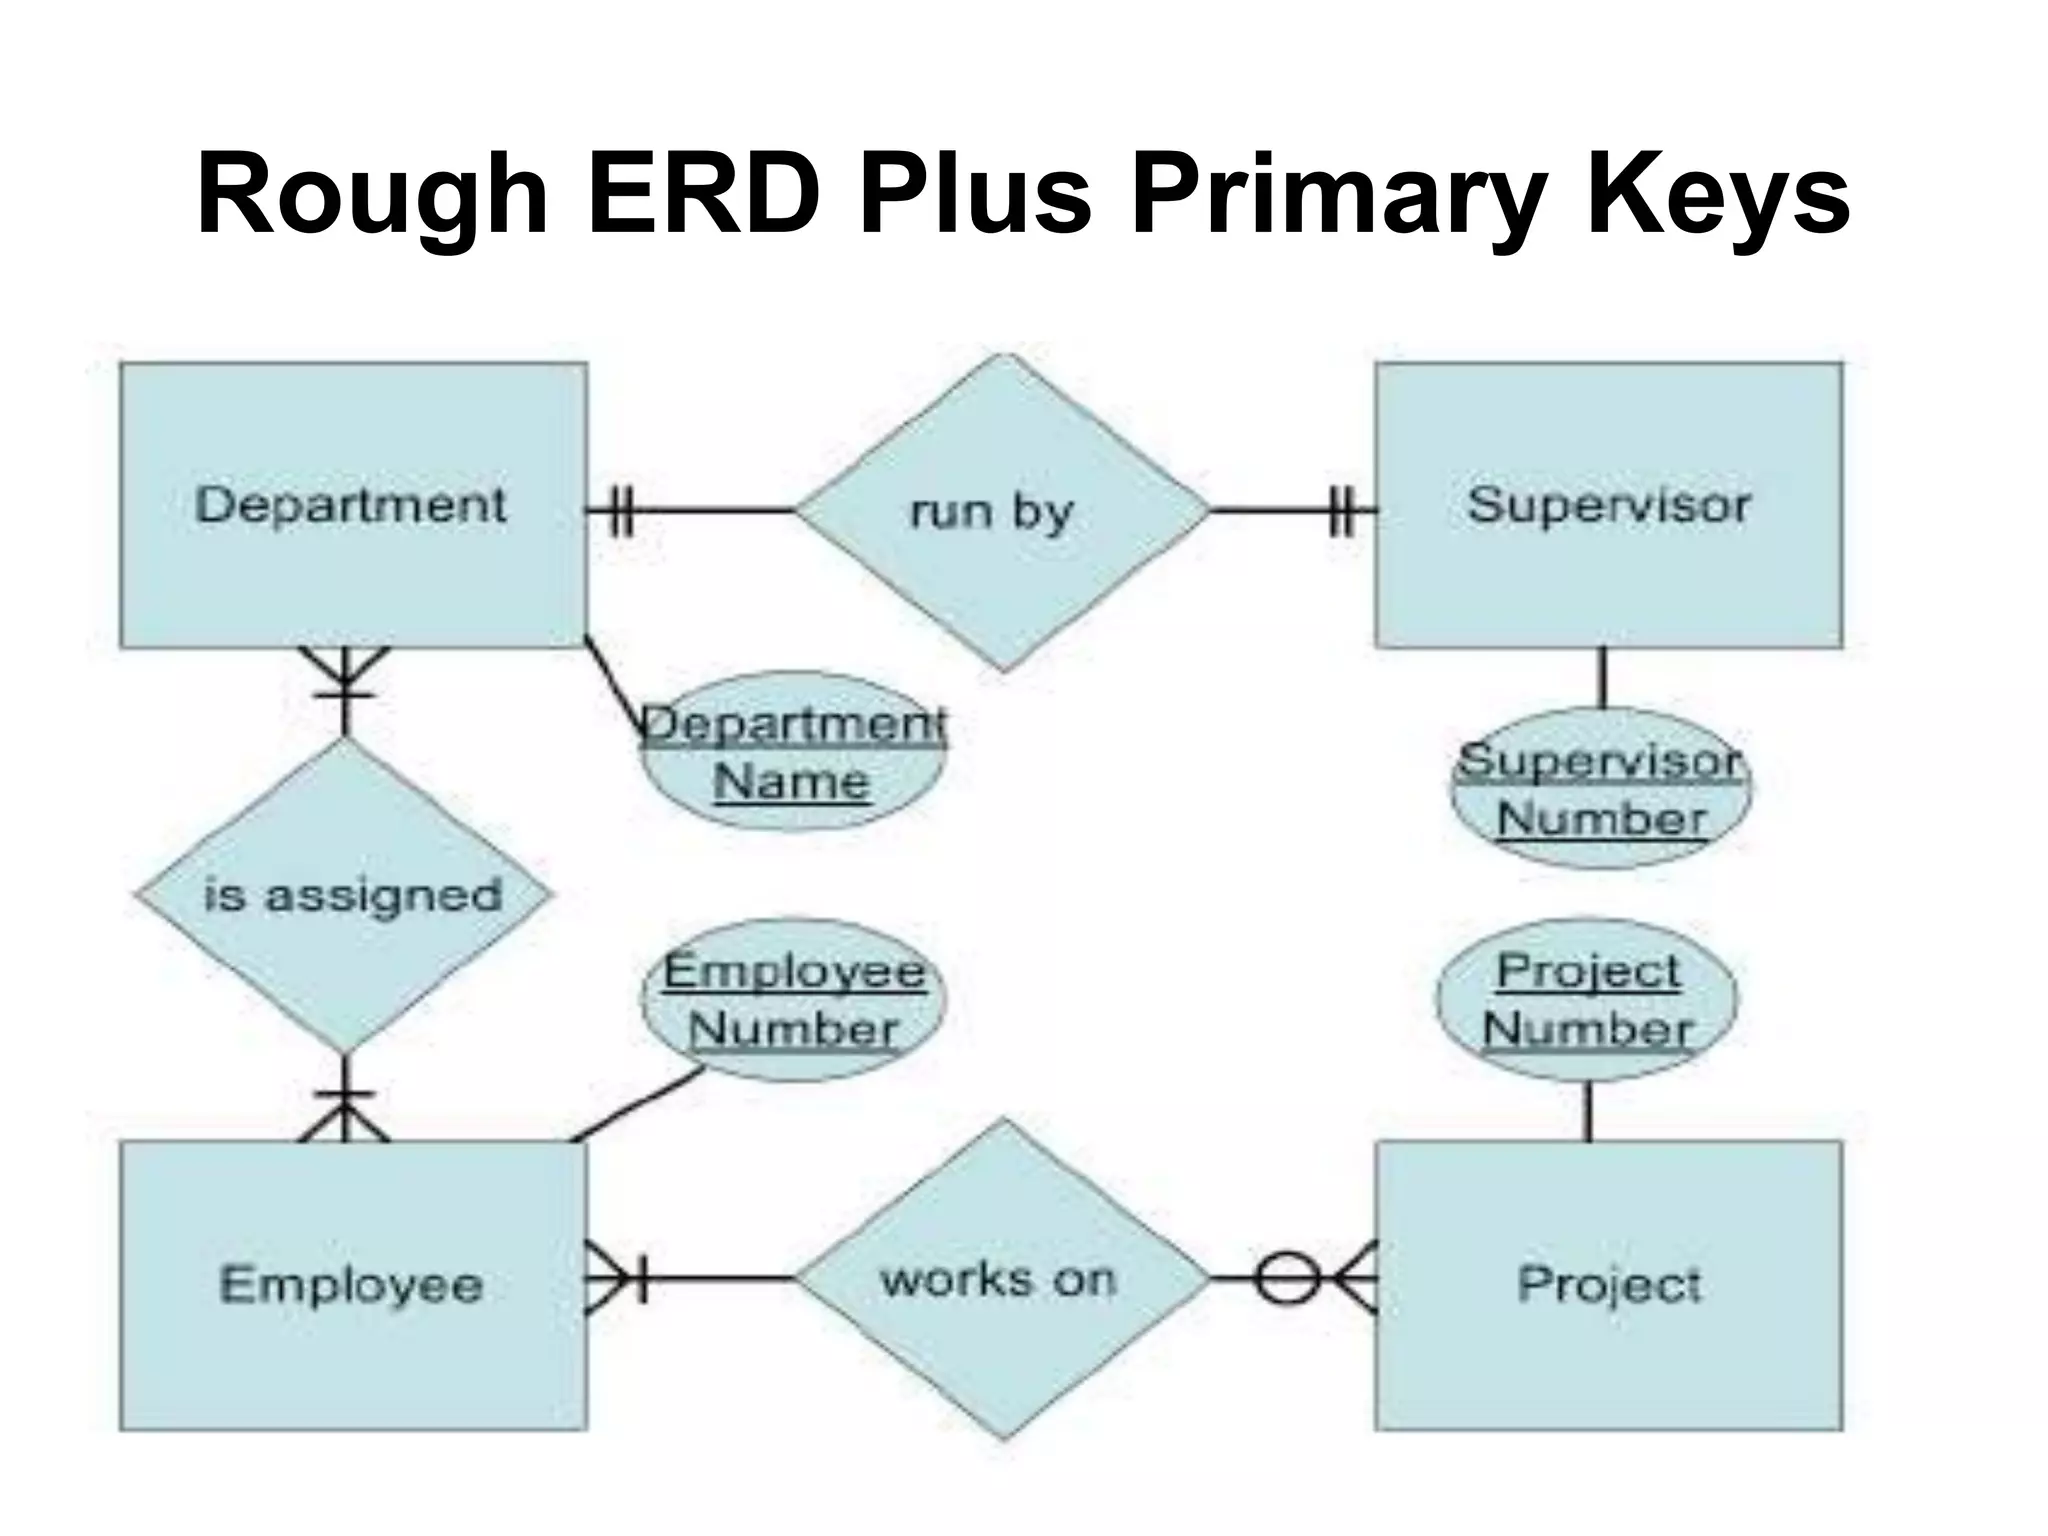
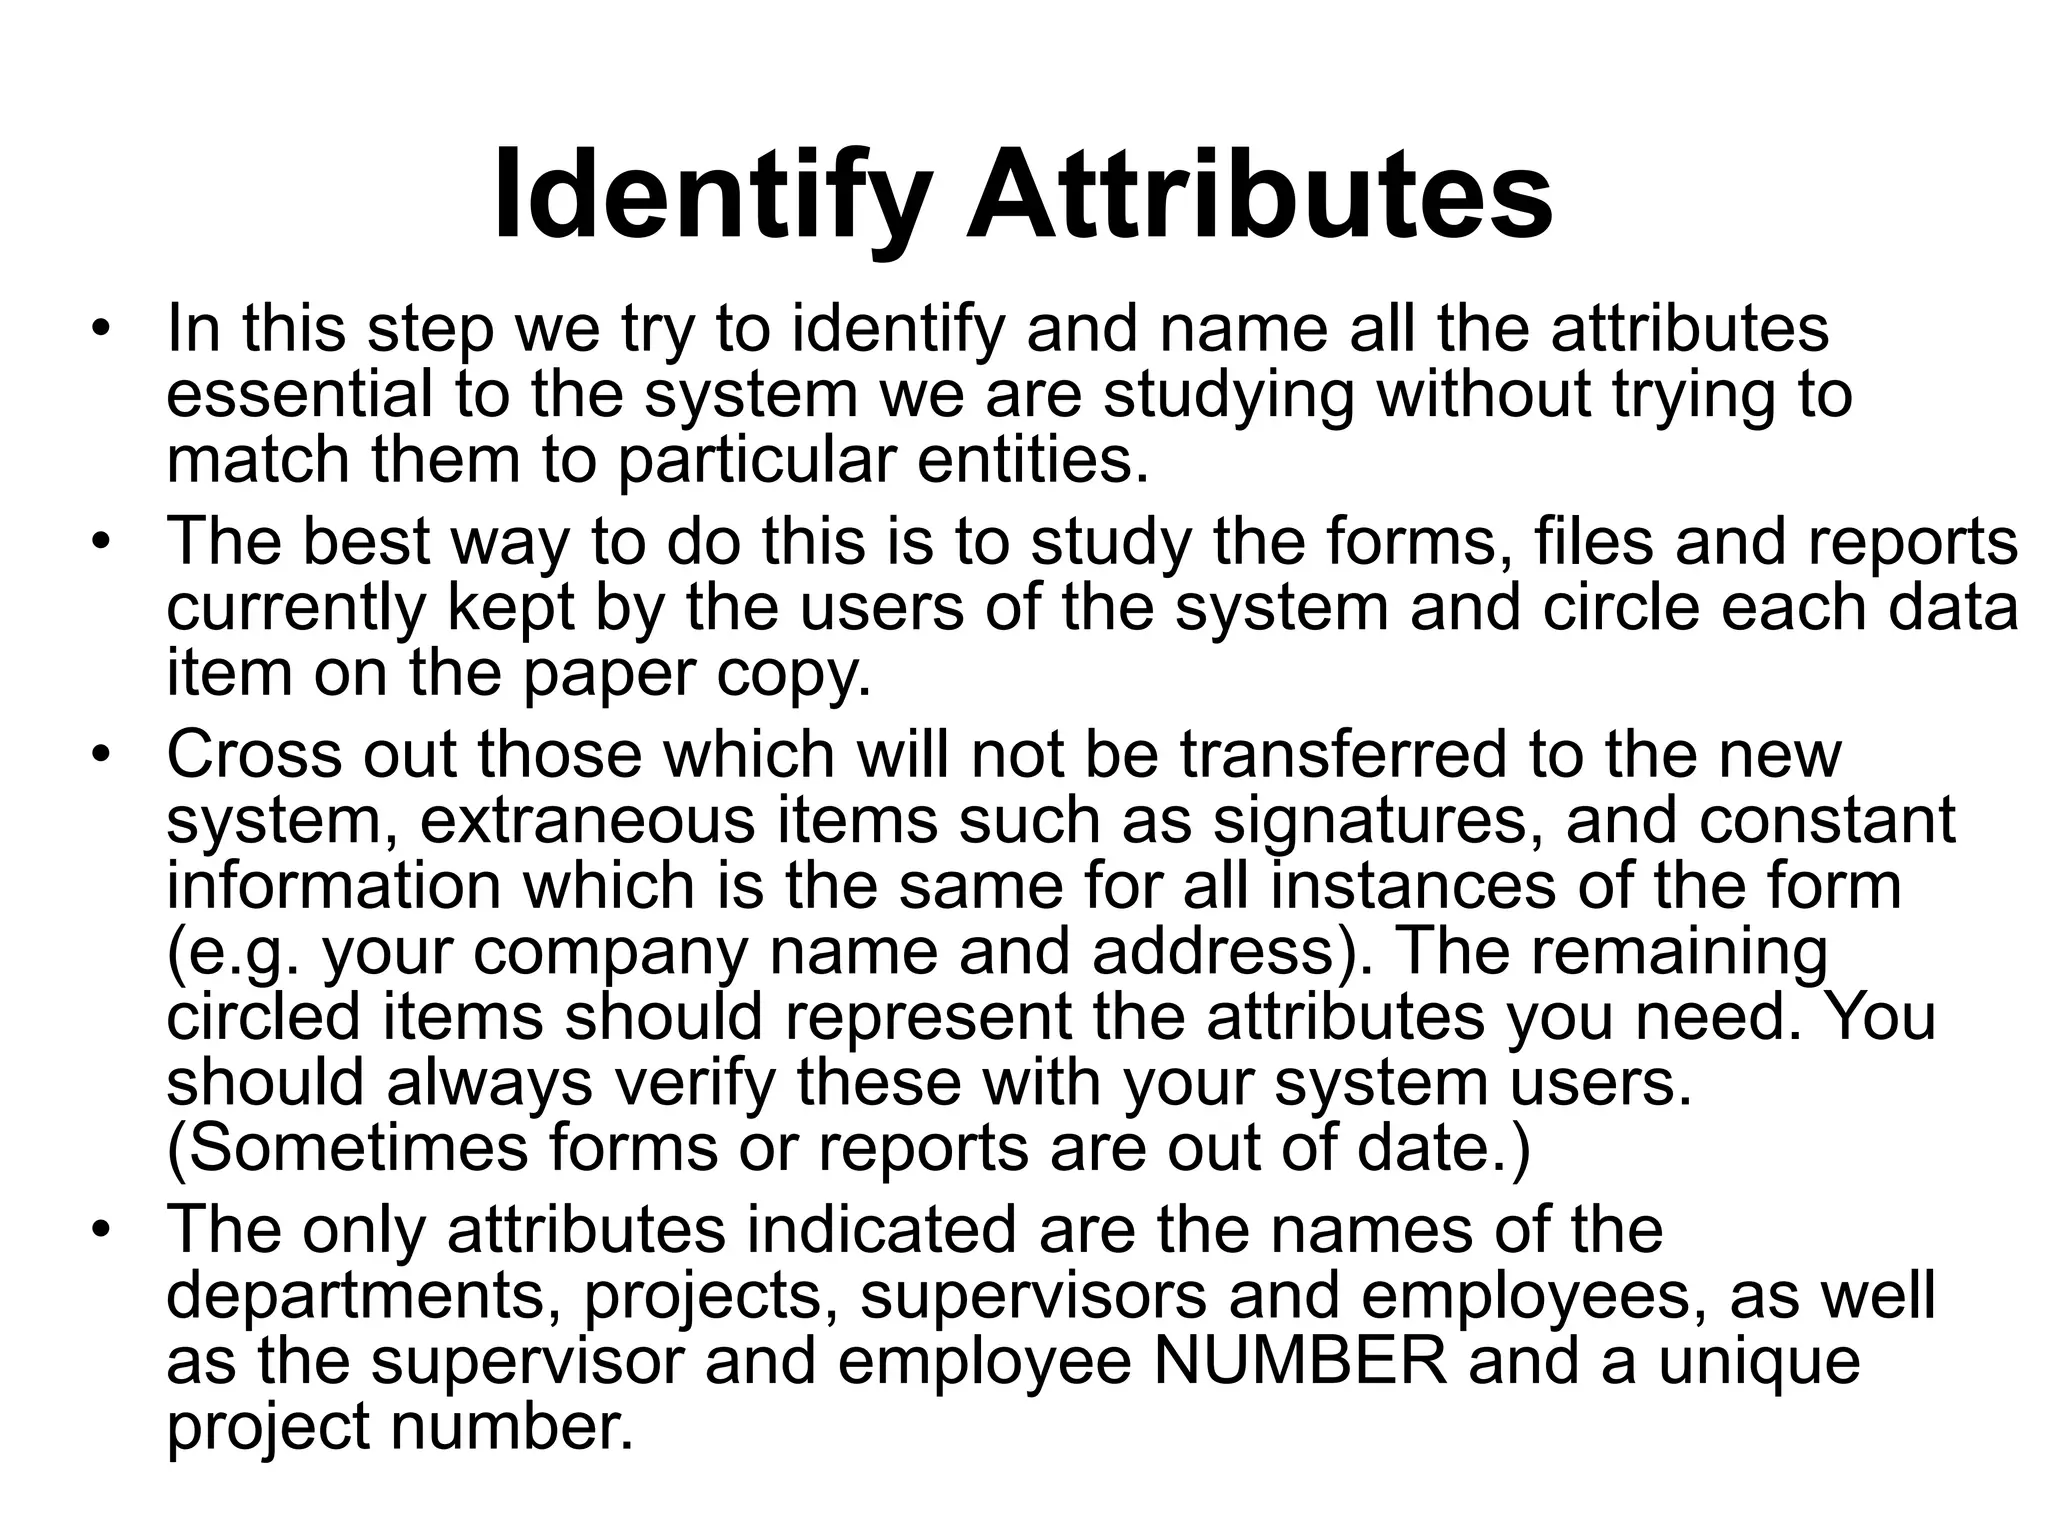
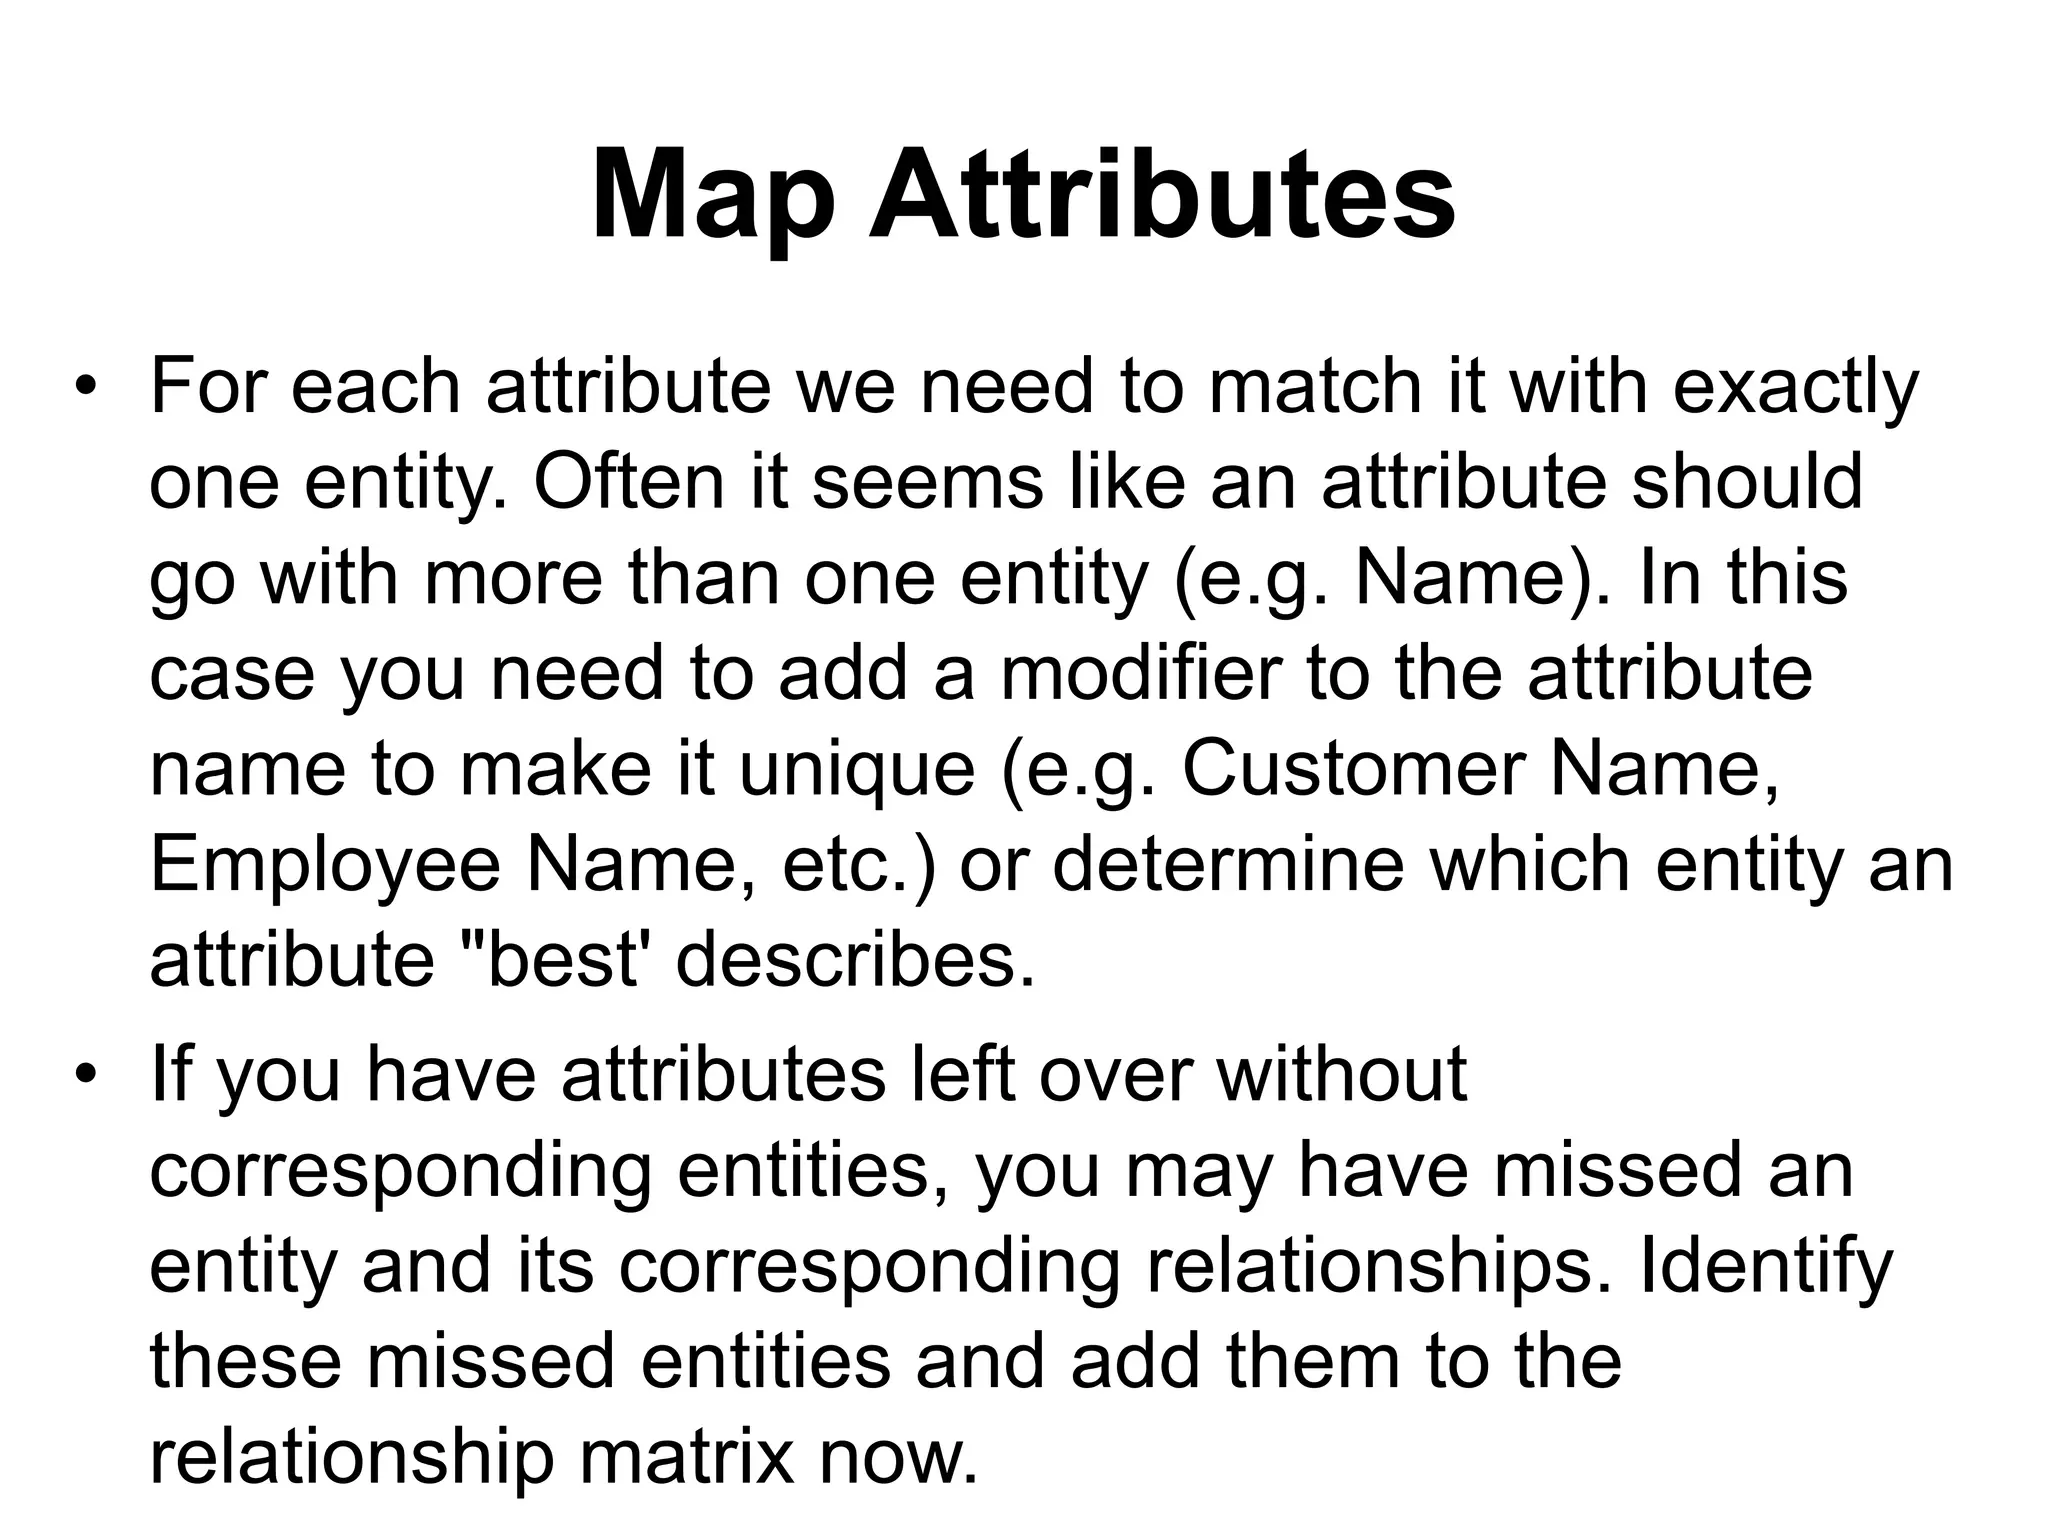
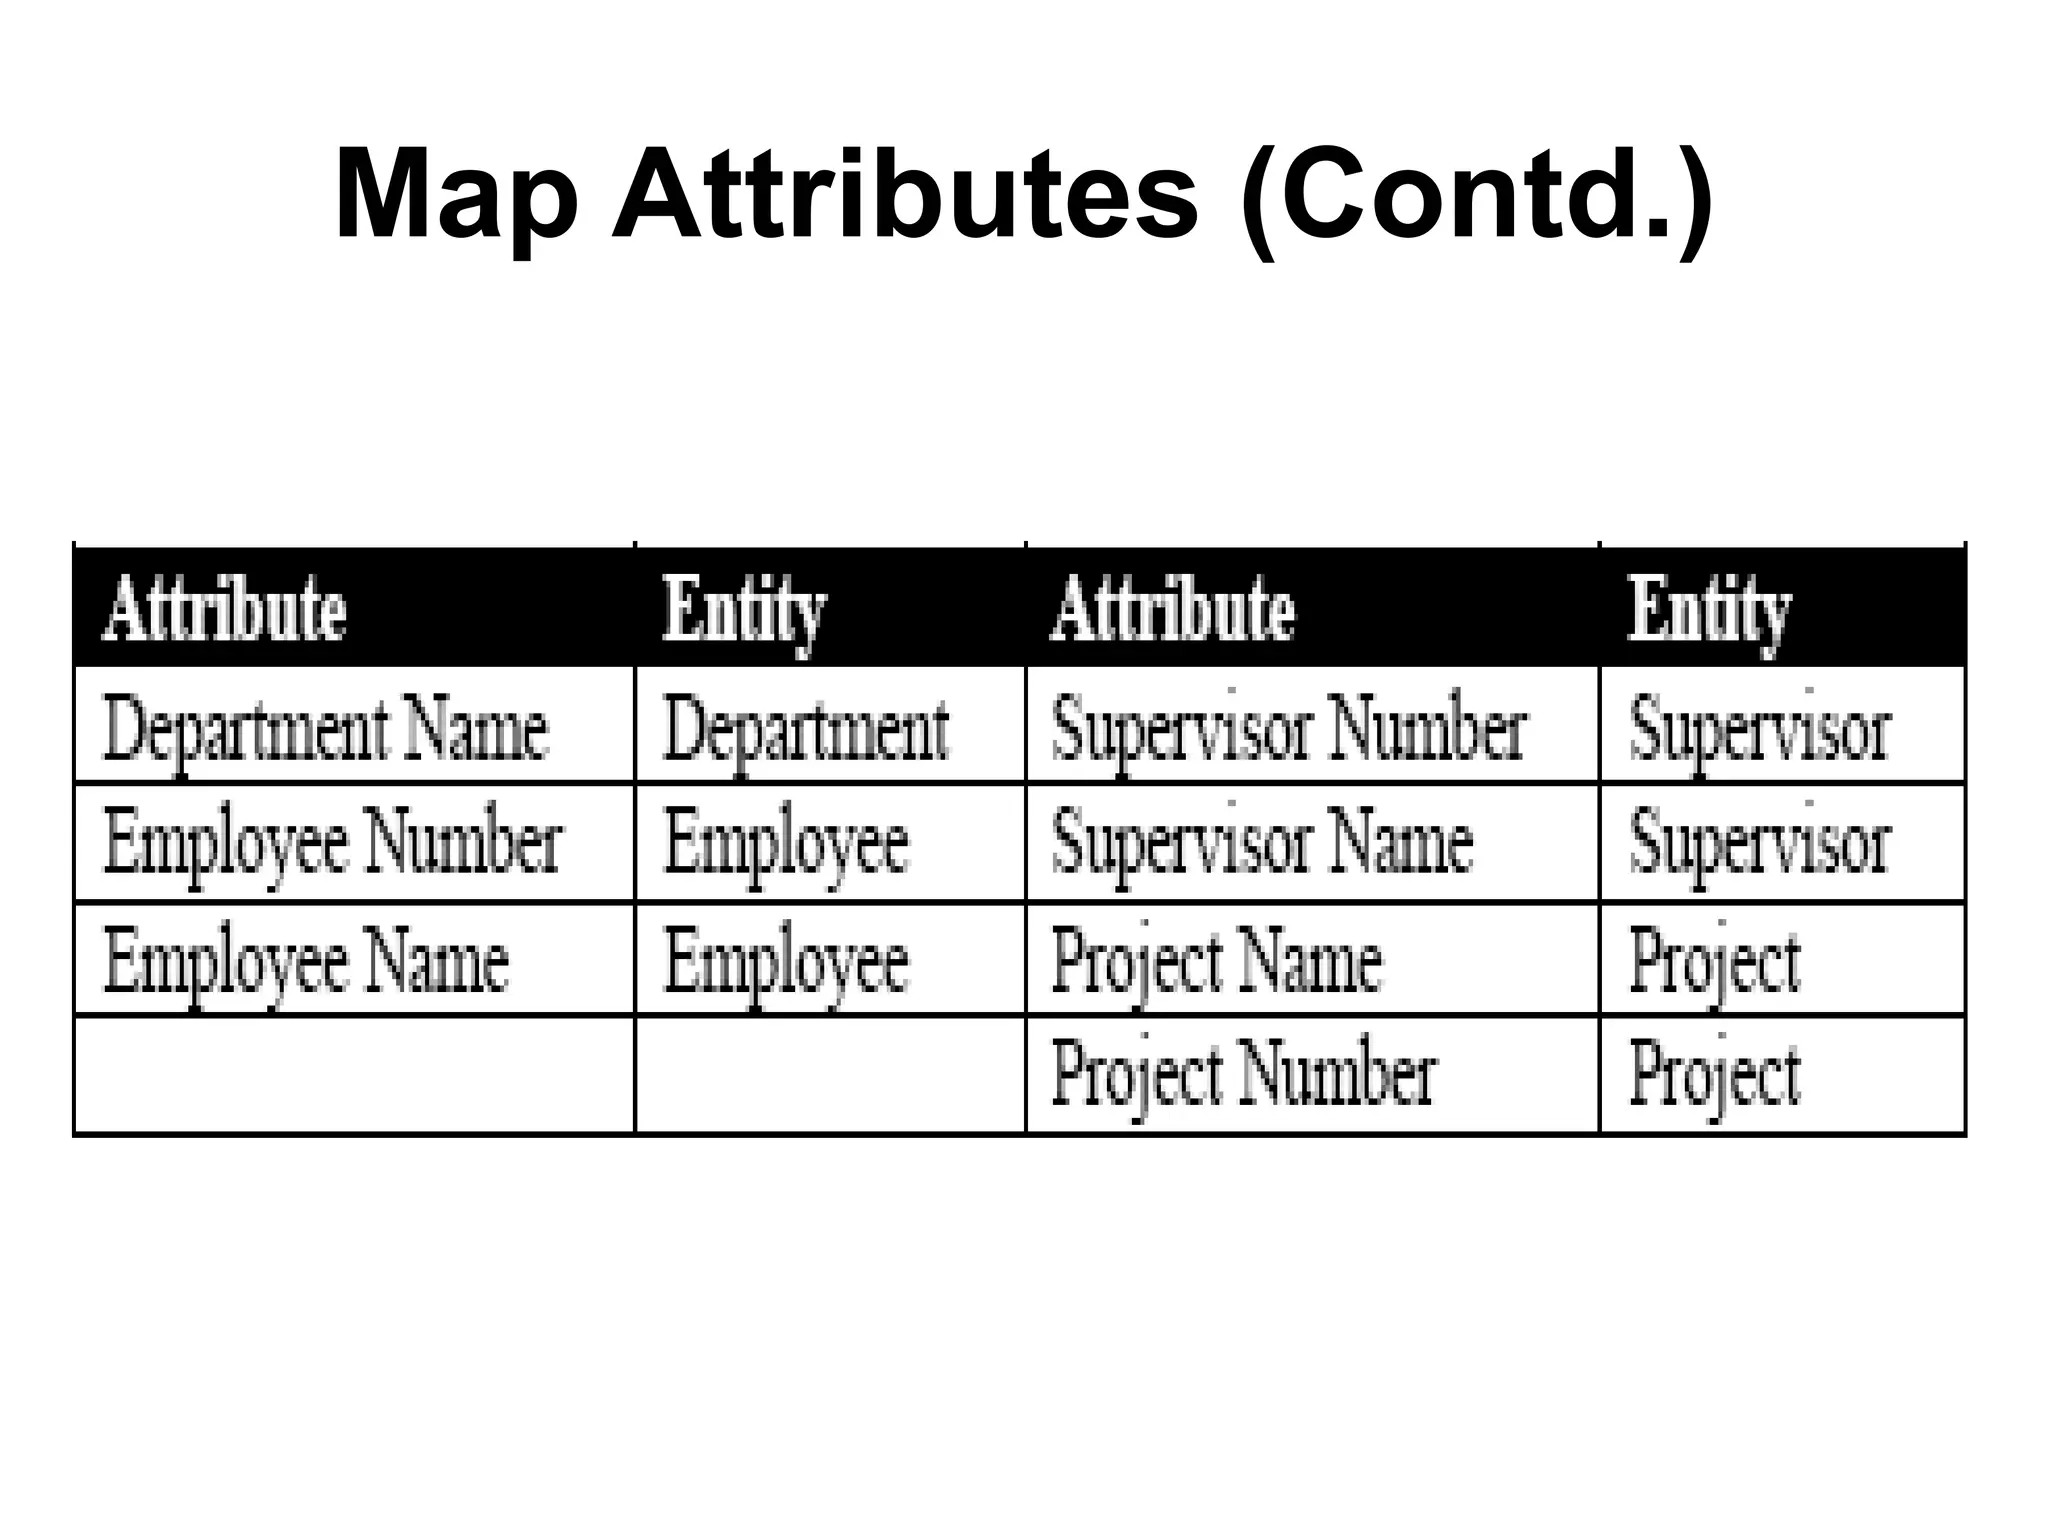
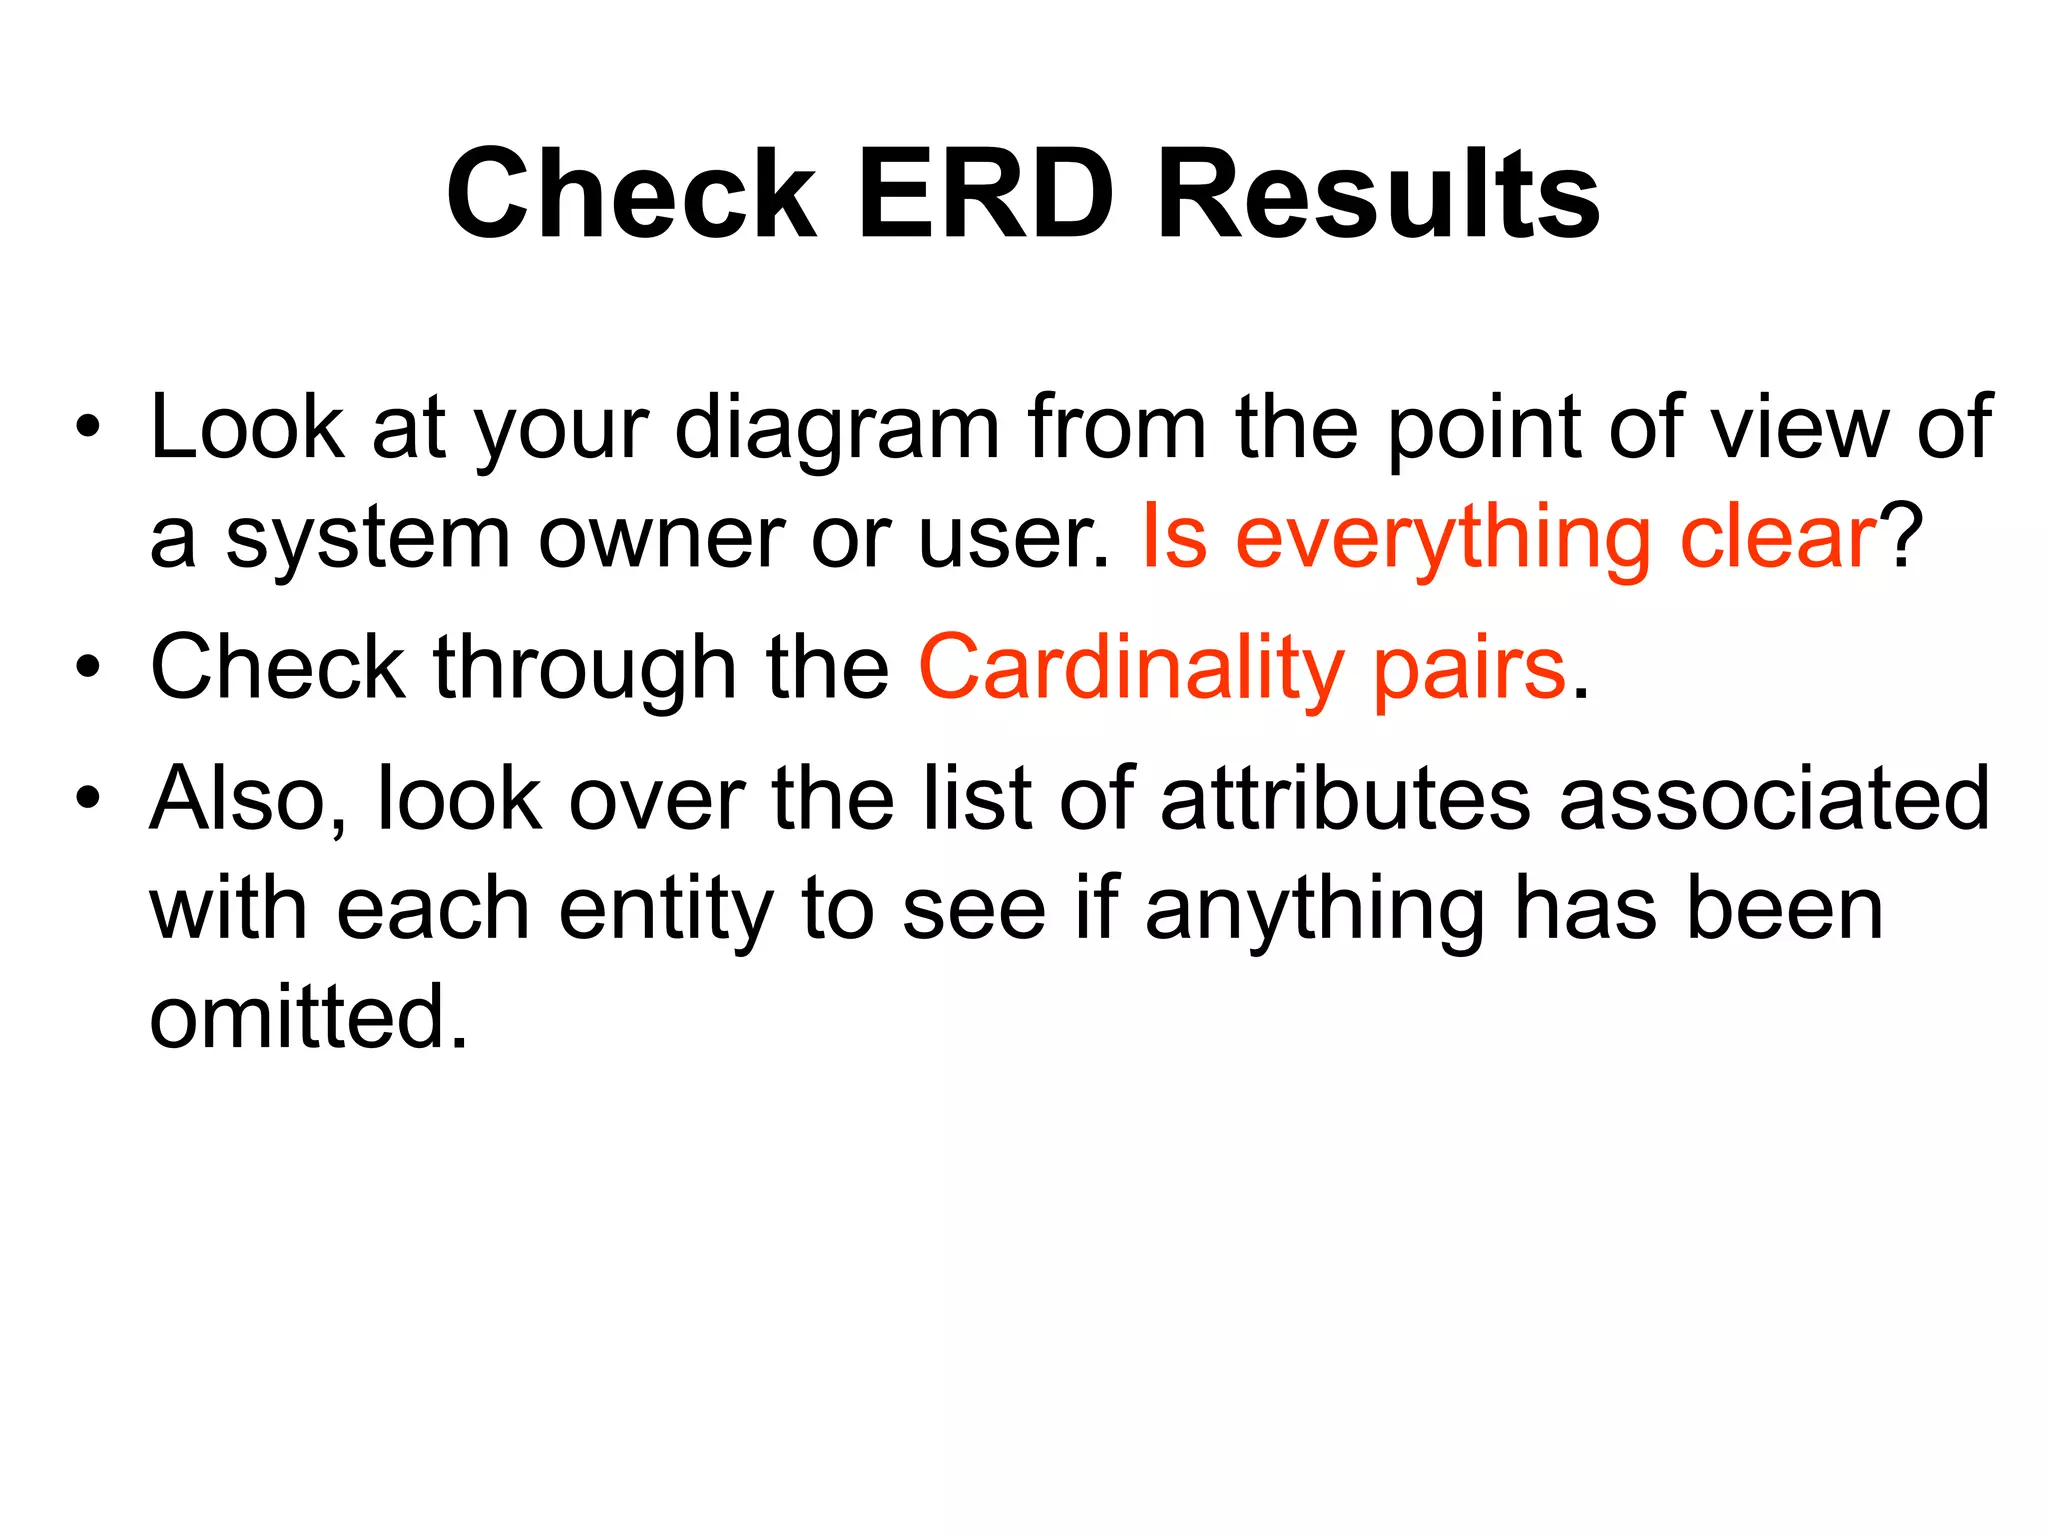
The document provides information on entity relationship diagrams (ERDs), including the objectives, components, and steps to create an ERD. It defines key ERD concepts like entities, attributes, relationships, and cardinality. It describes the entity modeling process and discusses how to recognize entities, attributes, relationships, and cardinalities in a database. It outlines the general steps to create an ERD, including identifying entities, finding relationships between entities, drawing a rough ERD, defining primary keys, identifying attributes, mapping attributes to entities, and drawing a fully attributed ERD. Sample ERDs are provided to illustrate concepts like cardinality constraints.
Considering Company as a Mini world Problem we need to design the Database.
Company Database consists of:
Company Info
Employee Info
Project Info
The Formulated Requirements are:
The company is organized into departments. Each department has a unique name, a unique number, and a particular employee who manages the department. We keep track of the start date when that employee began managing the department. A department may have several location
A department controls a number of projects, each of which has a unique name, a unique number, and a single location
We store each employee’s name, Social Security number, address, salary, sex (gender), and birth date. An employee is assigned to one department, but may work on several projects, which are not necessarily controlled by the same department. We keep track of the current number of hours per week that an employee works on each project. We also keep track of the direct supervisor of each employee (who is another employee).
We want to keep track of the dependents of each employee for insurance purposes
Functional dependencies in Database Management SystemKevin Jadiya
Slides attached here describes mainly Functional dependencies in database management system, how to find closure set of functional dependencies and in last how decomposition is done in any database tables
Lorem ipsum dolor sit amet, consectetur adipiscing elit, sed do eiusmod tempor incididunt ut labore et dolore magna aliqua. Ut enim ad minim veniam, quis nostrud exercitation.
What is dimension modeling? ,
Difference between ER modeling and dimension modeling,
What is a Dimension? ,
What is a Fact?
Start Schema ,
Snow Flake Schema ,
Difference between Star and snow flake schema ,
Fact Table ,
Different types of facts
Dimensional Tables,
Fact less Fact Table ,
Confirmed Dimensions ,
Unconfirmed Dimensions ,
Junk Dimensions ,
Monster Dimensions ,
Degenerative Dimensions ,
What are slowly changing Dimensions? ,
Different types of SCD's,
Smart TV Buyer Insights Survey 2024 by 91mobiles.pdf91mobiles
91mobiles recently conducted a Smart TV Buyer Insights Survey in which we asked over 3,000 respondents about the TV they own, aspects they look at on a new TV, and their TV buying preferences.
Dev Dives: Train smarter, not harder – active learning and UiPath LLMs for do...UiPathCommunity
💥 Speed, accuracy, and scaling – discover the superpowers of GenAI in action with UiPath Document Understanding and Communications Mining™:
See how to accelerate model training and optimize model performance with active learning
Learn about the latest enhancements to out-of-the-box document processing – with little to no training required
Get an exclusive demo of the new family of UiPath LLMs – GenAI models specialized for processing different types of documents and messages
This is a hands-on session specifically designed for automation developers and AI enthusiasts seeking to enhance their knowledge in leveraging the latest intelligent document processing capabilities offered by UiPath.
Speakers:
👨🏫 Andras Palfi, Senior Product Manager, UiPath
👩🏫 Lenka Dulovicova, Product Program Manager, UiPath
GDG Cloud Southlake #33: Boule & Rebala: Effective AppSec in SDLC using Deplo...James Anderson
Effective Application Security in Software Delivery lifecycle using Deployment Firewall and DBOM
The modern software delivery process (or the CI/CD process) includes many tools, distributed teams, open-source code, and cloud platforms. Constant focus on speed to release software to market, along with the traditional slow and manual security checks has caused gaps in continuous security as an important piece in the software supply chain. Today organizations feel more susceptible to external and internal cyber threats due to the vast attack surface in their applications supply chain and the lack of end-to-end governance and risk management.
The software team must secure its software delivery process to avoid vulnerability and security breaches. This needs to be achieved with existing tool chains and without extensive rework of the delivery processes. This talk will present strategies and techniques for providing visibility into the true risk of the existing vulnerabilities, preventing the introduction of security issues in the software, resolving vulnerabilities in production environments quickly, and capturing the deployment bill of materials (DBOM).
Speakers:
Bob Boule
Robert Boule is a technology enthusiast with PASSION for technology and making things work along with a knack for helping others understand how things work. He comes with around 20 years of solution engineering experience in application security, software continuous delivery, and SaaS platforms. He is known for his dynamic presentations in CI/CD and application security integrated in software delivery lifecycle.
Gopinath Rebala
Gopinath Rebala is the CTO of OpsMx, where he has overall responsibility for the machine learning and data processing architectures for Secure Software Delivery. Gopi also has a strong connection with our customers, leading design and architecture for strategic implementations. Gopi is a frequent speaker and well-known leader in continuous delivery and integrating security into software delivery.
Accelerate your Kubernetes clusters with Varnish CachingThijs Feryn
A presentation about the usage and availability of Varnish on Kubernetes. This talk explores the capabilities of Varnish caching and shows how to use the Varnish Helm chart to deploy it to Kubernetes.
This presentation was delivered at K8SUG Singapore. See https://feryn.eu/presentations/accelerate-your-kubernetes-clusters-with-varnish-caching-k8sug-singapore-28-2024 for more details.
UiPath Test Automation using UiPath Test Suite series, part 3DianaGray10
Welcome to UiPath Test Automation using UiPath Test Suite series part 3. In this session, we will cover desktop automation along with UI automation.
Topics covered:
UI automation Introduction,
UI automation Sample
Desktop automation flow
Pradeep Chinnala, Senior Consultant Automation Developer @WonderBotz and UiPath MVP
Deepak Rai, Automation Practice Lead, Boundaryless Group and UiPath MVP
DevOps and Testing slides at DASA ConnectKari Kakkonen
My and Rik Marselis slides at 30.5.2024 DASA Connect conference. We discuss about what is testing, then what is agile testing and finally what is Testing in DevOps. Finally we had lovely workshop with the participants trying to find out different ways to think about quality and testing in different parts of the DevOps infinity loop.
JMeter webinar - integration with InfluxDB and GrafanaRTTS
Watch this recorded webinar about real-time monitoring of application performance. See how to integrate Apache JMeter, the open-source leader in performance testing, with InfluxDB, the open-source time-series database, and Grafana, the open-source analytics and visualization application.
In this webinar, we will review the benefits of leveraging InfluxDB and Grafana when executing load tests and demonstrate how these tools are used to visualize performance metrics.
Length: 30 minutes
Session Overview
-------------------------------------------
During this webinar, we will cover the following topics while demonstrating the integrations of JMeter, InfluxDB and Grafana:
- What out-of-the-box solutions are available for real-time monitoring JMeter tests?
- What are the benefits of integrating InfluxDB and Grafana into the load testing stack?
- Which features are provided by Grafana?
- Demonstration of InfluxDB and Grafana using a practice web application
To view the webinar recording, go to:
https://www.rttsweb.com/jmeter-integration-webinar
State of ICS and IoT Cyber Threat Landscape Report 2024 previewPrayukth K V
The IoT and OT threat landscape report has been prepared by the Threat Research Team at Sectrio using data from Sectrio, cyber threat intelligence farming facilities spread across over 85 cities around the world. In addition, Sectrio also runs AI-based advanced threat and payload engagement facilities that serve as sinks to attract and engage sophisticated threat actors, and newer malware including new variants and latent threats that are at an earlier stage of development.
The latest edition of the OT/ICS and IoT security Threat Landscape Report 2024 also covers:
State of global ICS asset and network exposure
Sectoral targets and attacks as well as the cost of ransom
Global APT activity, AI usage, actor and tactic profiles, and implications
Rise in volumes of AI-powered cyberattacks
Major cyber events in 2024
Malware and malicious payload trends
Cyberattack types and targets
Vulnerability exploit attempts on CVEs
Attacks on counties – USA
Expansion of bot farms – how, where, and why
In-depth analysis of the cyber threat landscape across North America, South America, Europe, APAC, and the Middle East
Why are attacks on smart factories rising?
Cyber risk predictions
Axis of attacks – Europe
Systemic attacks in the Middle East
Download the full report from here:
https://sectrio.com/resources/ot-threat-landscape-reports/sectrio-releases-ot-ics-and-iot-security-threat-landscape-report-2024/
Connector Corner: Automate dynamic content and events by pushing a buttonDianaGray10
Here is something new! In our next Connector Corner webinar, we will demonstrate how you can use a single workflow to:
Create a campaign using Mailchimp with merge tags/fields
Send an interactive Slack channel message (using buttons)
Have the message received by managers and peers along with a test email for review
But there’s more:
In a second workflow supporting the same use case, you’ll see:
Your campaign sent to target colleagues for approval
If the “Approve” button is clicked, a Jira/Zendesk ticket is created for the marketing design team
But—if the “Reject” button is pushed, colleagues will be alerted via Slack message
Join us to learn more about this new, human-in-the-loop capability, brought to you by Integration Service connectors.
And...
Speakers:
Akshay Agnihotri, Product Manager
Charlie Greenberg, Host
The Art of the Pitch: WordPress Relationships and SalesLaura Byrne
Clients don’t know what they don’t know. What web solutions are right for them? How does WordPress come into the picture? How do you make sure you understand scope and timeline? What do you do if sometime changes?
All these questions and more will be explored as we talk about matching clients’ needs with what your agency offers without pulling teeth or pulling your hair out. Practical tips, and strategies for successful relationship building that leads to closing the deal.
Key Trends Shaping the Future of Infrastructure.pdfCheryl Hung
Keynote at DIGIT West Expo, Glasgow on 29 May 2024.
Cheryl Hung, ochery.com
Sr Director, Infrastructure Ecosystem, Arm.
The key trends across hardware, cloud and open-source; exploring how these areas are likely to mature and develop over the short and long-term, and then considering how organisations can position themselves to adapt and thrive.
Slack (or Teams) Automation for Bonterra Impact Management (fka Social Soluti...Jeffrey Haguewood
Sidekick Solutions uses Bonterra Impact Management (fka Social Solutions Apricot) and automation solutions to integrate data for business workflows.
We believe integration and automation are essential to user experience and the promise of efficient work through technology. Automation is the critical ingredient to realizing that full vision. We develop integration products and services for Bonterra Case Management software to support the deployment of automations for a variety of use cases.
This video focuses on the notifications, alerts, and approval requests using Slack for Bonterra Impact Management. The solutions covered in this webinar can also be deployed for Microsoft Teams.
Interested in deploying notification automations for Bonterra Impact Management? Contact us at sales@sidekicksolutionsllc.com to discuss next steps.
2. Objectives
• Define terms related to entity relationship
modeling, including entity, entity instance,
attribute, relationship and cardinality, and
primary key.
• Describe the entity modeling process.
• Discuss how to draw an entity relationship
diagram.
• Describe how to recognize entities,
attributes, relationships, and cardinalities.
3. Database Model
A database can be modeled as:
– a collection of entities,
– relationship among entities.
Database systems are often modeled using
an Entity Relationship (ER) diagram as the
"blueprint" from which the actual data is
stored — the output of the design phase.
4. Entity Relationship Diagram (ERD)
• ER model allows us to sketch database designs
• ERD is a graphical tool for modeling data.
• ERD is widely used in database design
• ERD is a graphical representation of the logical
structure of a database
• ERD is a model that identifies the concepts or
entities that exist in a system and the
relationships between those entities
5. Purposes of ERD
An ERD serves several purposes
• The database analyst/designer gains a
better understanding of the information to
be contained in the database through the
process of constructing the ERD.
• The ERD serves as a documentation tool.
• Finally, the ERD is used to communicate
the logical structure of the database to
users. In particular, the ERD effectively
communicates the logic of the database to
users.
6. Components of an ERD
An ERD typically consists of four different
graphical components:
1. Entity
2. Relationship
3. Cardinality
4. Attribute
7. Classification of Relationship
• Optional Relationship
– An Employee may or may not be assigned
to a Department
– A Patient may or may not be assigned to a
Bed
• Mandatory Relationship
– Every Course must be taught by at least
one Teacher
– Every mother have at least a Child
8. Cardinality Constraints
Express the number of entities to which another
entity can be associated via a relationship set.
• Cardinality Constraints - the number of instances
of one entity that can or must be associated with
each instance of another entity.
• Minimum Cardinality
– If zero, then optional
– If one or more, then mandatory
• Maximum Cardinality
– The maximum number
9. Cardinality Constraints (Contd.)
• For a binary relationship set the mapping
cardinality must be one of the following types:
–One to one
• A Manager Head one Department and vice versa
–One to many ( or many to one)
• An Employee Works in one Department or One
Department has many Employees
–Many to many
• A Teacher Teaches many Students and A student
is taught by many Teachers
11. Cardinality Constraints Example
• In our model, we wish to indicate that each
school may enroll many students, or may not
enroll any students at all.
• We also wish to indicate that each student
attends exactly one school. The following
diagram indicates this optionality and
cardinality:
12. Cardinality Constraints Example (Contd.)
SCHOOL
STUDENT
Each school enrolls
at least zero
and at most many
students
Each student attends
at least one
and at most one
school
13. General Steps to create an ERD
• Identify the entity
• Identify the entity's attributes
• Identify the Primary Keys
• Identify the relation between entities
• Identify the Cardinality constraint
• Draw the ERD
• Check the ERD
15. Developing an ERD
The process has ten steps:
1. Identify Entities
2. Find Relationships
3. Draw Rough ERD
4. Fill in Cardinality
5. Define Primary Keys
6. Draw Key-Based ERD
7. Identify Attributes
8. Map Attributes
9. Draw fully attributed ERD
10. Check Results
16. A Simple Example
A company has several departments. Each
department has a supervisor and at least one
employee. Employees must be assigned to at
least one, but possibly more departments. At
least one employee is assigned to a project,
but an employee may be on vacation and not
assigned to any projects. The important data
fields are the names of the departments,
projects, supervisors and employees, as well
as the supervisor and employee number and a
unique project number.
17. Identify entities
• One approach to this is to work through the
information and highlight those words which you think
correspond to entities.
• A company has several departments. Each
department has a supervisor and at least one
employee. Employees must be assigned to at least
one, but possibly more departments. At least one
employee is assigned to a project, but an employee
may be on vacation and not assigned to any projects.
The important data fields are the names of the
departments, projects, supervisors and employees, as
well as the supervisor and employee number and a
unique project number.
• A true entity should have more than one instance
18. Find Relationships
• Aim is to identify the associations, the
connections between pairs of entities.
• A simple approach to do this is using a
relationship matrix (table) that has rows and
columns for each of the identified entities.
19. Find Relationships (Contd.)
• Go through each cell and decide whether or not
there is an association. For example, the first cell
on the second row is used to indicate if there is a
relationship between the entity "Employee" and
the entity "Department".
20. Identified Relationships
Names placed in the cells are meant to
capture/describe the relationships. So you
can use them like this
• A Department is assigned an employee
• A Department is run by a supervisor
• An employee belongs to a department
• An employee works on a project
• A supervisor runs a department
• A project uses an employee
21. Draw Rough ERD
Draw a diagram and:
• Place all the entities in rectangles
• Use diamonds and lines to represent the
relationships between entities.
• General Examples
25. Fill in Cardinality
• Supervisor
– Each department has one supervisor.
• Department
– Each supervisor has one department.
– Each employee can belong to one or more departments
• Employee
– Each department must have one or more employees
– Each project must have one or more employees
• Project
– Each employee can have 0 or more projects.
26. Fill in Cardinality (Contd.)
The cardinality of a relationship can only
have the following values
–One and only one
–One or more
–Zero or more
–Zero or one
28. Cardinality Examples
A
A
A
A
B
B
B
B
Each instance of A is related to a minimum of
zero and a maximum of one instance of B
Each instance of B is related to a minimum of
one and a maximum of one instance of A
Each instance of A is related to a minimum of
one and a maximum of many instances of B
Each instance of B is related to a minimum of
zero and a maximum of many instances of A
34. Identify Attributes
• In this step we try to identify and name all the attributes
essential to the system we are studying without trying to
match them to particular entities.
• The best way to do this is to study the forms, files and reports
currently kept by the users of the system and circle each data
item on the paper copy.
• Cross out those which will not be transferred to the new
system, extraneous items such as signatures, and constant
information which is the same for all instances of the form
(e.g. your company name and address). The remaining
circled items should represent the attributes you need. You
should always verify these with your system users.
(Sometimes forms or reports are out of date.)
• The only attributes indicated are the names of the
departments, projects, supervisors and employees, as well
as the supervisor and employee NUMBER and a unique
project number.
35. Map Attributes
• For each attribute we need to match it with exactly
one entity. Often it seems like an attribute should
go with more than one entity (e.g. Name). In this
case you need to add a modifier to the attribute
name to make it unique (e.g. Customer Name,
Employee Name, etc.) or determine which entity an
attribute "best' describes.
• If you have attributes left over without
corresponding entities, you may have missed an
entity and its corresponding relationships. Identify
these missed entities and add them to the
relationship matrix now.
38. Check ERD Results
• Look at your diagram from the point of view of
a system owner or user. Is everything clear?
• Check through the Cardinality pairs.
• Also, look over the list of attributes associated
with each entity to see if anything has been
omitted.