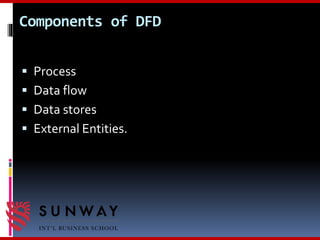
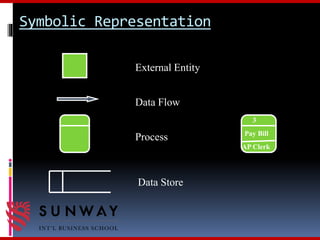
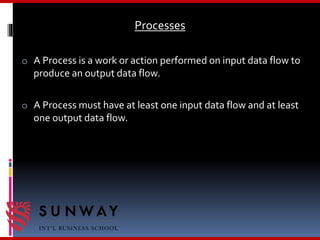
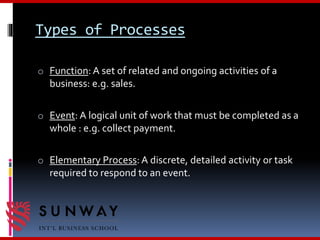
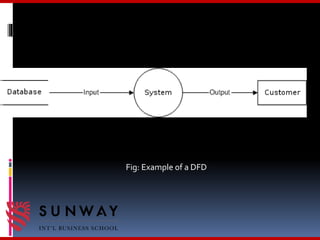
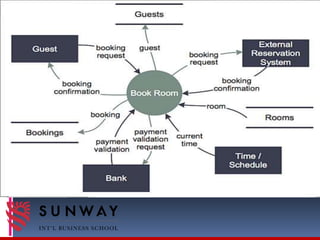
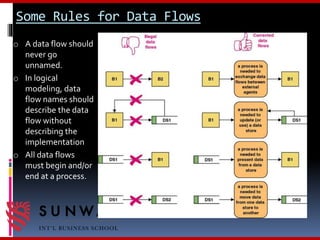
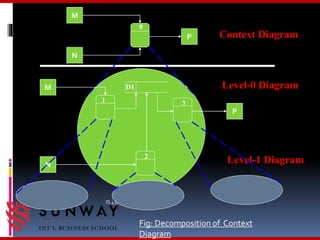
PROCESS MODELING
Presentation By: Debendra Adhikari
Objectives:
 Define process modeling and explain its benefits.
 Understand basic concepts and constructs of a process model.
 Deliverables and Outcomes
 Read and interpret a data flow diagram
Data Flow Diagrams(DFD)
Elements of DFD
Guidelines and Rules to draw DFD
Steps to draw DFD
Introduction to Process Modeling
-Model : Representation of reality that can be built for existing
systems or newly proposed System.
-Different types of Model : Process Model , System Model, Data Model
-Process modeling focuses on the Process part of a system.
Eg: Flowcharts are one type of process model.
- Processes and data structures are modeled
Model and it’s types
o Model is a pictorial representation of reality.
Logical model
o IT shows what a system is
or does.They are
independent of any
technical implementation.
Physical model
o It shows not only what a
system is or does, but
also how the system is to
be physically and
technically
implemented. It reflects
technology choices.
Why Process Modelling………..?
Process modeling – a technique used to organize and
document a system’s processes.
 Flow of data through processes
 Logic
 Policies
 Procedures
Deliverables and Outcomes
Deliverable : Product produced as a part of a process / project.
Eg: Hardware , Software , Planning Documents e.t.c.
Deliverable and Outcomes
„
 Context data flow diagram (DFD)…
Scope of system„
 DFDs of current physical system…
Adequate detail only
„
 DFDs of current logical system…
Enables analysts to understand current system
„
 DFDs of new logical system…
Show data flows, structure, and functional requirements of new system
„
 DFDs of new physical system„
Description of each DFD component
System Concept
o A system exits by taking input from the environment,
processing this input, and release an output.
o A system may be decomposed into subsystems.
o A subsystem has its own input and output
INPUT OUTPUT
Fig:A system with it’s
subsystems
Systems and Processes
o A system is a process. It addresses a business function.
o A process is action performed on, or in response to,
incoming data flows or conditions.
o A process can be decomposed into sub-processes.
The
System
is a
Process
input output
input
input output
output
Feedack and
Control Loop
The System's Environment
(constantly changing)
Fig: A System with Process
Process Modeling with DFD
Data Flow Diagram (DFD) : A process model used to
depict the flow of data through a system.
Also called bubble charts, transformation graph, and
process model.
Advantages of Diagrammatic representation
of data :
 It helps the analysts to analyze the system and to
model system components.
 An analyst can communicate better with the user.
 It is easier for the user to understand and how the
analyst has interpreted his/her problem after
looking at DFD’s.
Data Flow Diagrams
o DFD describes how data is manipulated within and at the
boundaries of the system.
o Logical DFD describes the flow of information of a
system
o Physical DFD describes how an information system is
physically implemented.
Components of DFD
 Process
 Data flow
 Data stores
 External Entities.
Symbolic Representation
External Entity
Data Flow
Process
Data Store
Pay Bill
AP Clerk
3
Processes
o A Process is a work or action performed on input data flow to
produce an output data flow.
o A Process must have at least one input data flow and at least
one output data flow.
Types of Processes
o Function: A set of related and ongoing activities of a
business: e.g. sales.
o Event: A logical unit of work that must be completed as a
whole : e.g. collect payment.
o Elementary Process: A discrete, detailed activity or task
required to respond to an event.
Data Flows
o A Data Flow represents a movement of data (info) among
processes or data stores
Data Stores
o A Data Store is a storage of data, it contains information
o There may be Physical or Computerized Data Stores.
External Entities
o An external entity defines a person, organization unit, or
other organization that lies outside of the scope of the
project
Fig: Example of a DFD
Guidelines for drawing DFD
 Should have no crossing lines.
 Should not split into a number of data flows.
 Should have no any flowchart structure like decision, iteration etc.
 Do not include control or flow of control information.
 Do not try to put too much information in one data flow diagram.
 Data flows can only be from:
 External entity to process
 Process to external entity
 Process to process
 Process to stores
 Stores to process
Some Rules for Data Flows
o A data flow should
never go
unnamed.
o In logical
modeling, data
flow names should
describe the data
flow without
describing the
implementation
o All data flows
must begin and/or
end at a process.
Advantages of Using
DFD’s
 Represent data flows.
 May be used at. high or low level of analysis.
 Provide good system documentation.
Steps to draw DFD
Context Diagram
o Identify the system and its boundaries (the context)
o Identify external entities (providers, receivers of system
info)
o Identify external data flows (input, output)
Level-0 DFD
o Identify what is being done between each input and its
corresponding output
o Identify the processes (functions of the system)
o Identify external data flows between external entities and
processes
o Identify internal data flows between processes and data
stores
Level-1 DFD’s
o Sub-processes (activities of tasks) of Level-0 processes
(system functions)
IS 431 : Lecture 4
M
N
P
M
N
P
Context Diagram
Level-0 Diagram
Level-1 Diagram
1 3
2
0
D1
Fig: Decomposition of Context
Diagram
Any
Queries…………………………………………………………?
?????
Thank Us

Process modeling

  • 1.
  • 2.
    Objectives:  Define processmodeling and explain its benefits.  Understand basic concepts and constructs of a process model.  Deliverables and Outcomes  Read and interpret a data flow diagram Data Flow Diagrams(DFD) Elements of DFD Guidelines and Rules to draw DFD Steps to draw DFD
  • 3.
    Introduction to ProcessModeling -Model : Representation of reality that can be built for existing systems or newly proposed System. -Different types of Model : Process Model , System Model, Data Model -Process modeling focuses on the Process part of a system. Eg: Flowcharts are one type of process model. - Processes and data structures are modeled
  • 4.
    Model and it’stypes o Model is a pictorial representation of reality. Logical model o IT shows what a system is or does.They are independent of any technical implementation. Physical model o It shows not only what a system is or does, but also how the system is to be physically and technically implemented. It reflects technology choices.
  • 5.
    Why Process Modelling………..? Processmodeling – a technique used to organize and document a system’s processes.  Flow of data through processes  Logic  Policies  Procedures
  • 6.
    Deliverables and Outcomes Deliverable: Product produced as a part of a process / project. Eg: Hardware , Software , Planning Documents e.t.c.
  • 7.
    Deliverable and Outcomes „ Context data flow diagram (DFD)… Scope of system„  DFDs of current physical system… Adequate detail only „  DFDs of current logical system… Enables analysts to understand current system „  DFDs of new logical system… Show data flows, structure, and functional requirements of new system „  DFDs of new physical system„ Description of each DFD component
  • 8.
    System Concept o Asystem exits by taking input from the environment, processing this input, and release an output. o A system may be decomposed into subsystems. o A subsystem has its own input and output
  • 9.
    INPUT OUTPUT Fig:A systemwith it’s subsystems
  • 10.
    Systems and Processes oA system is a process. It addresses a business function. o A process is action performed on, or in response to, incoming data flows or conditions. o A process can be decomposed into sub-processes.
  • 11.
    The System is a Process input output input inputoutput output Feedack and Control Loop The System's Environment (constantly changing) Fig: A System with Process
  • 12.
    Process Modeling withDFD Data Flow Diagram (DFD) : A process model used to depict the flow of data through a system. Also called bubble charts, transformation graph, and process model.
  • 13.
    Advantages of Diagrammaticrepresentation of data :  It helps the analysts to analyze the system and to model system components.  An analyst can communicate better with the user.  It is easier for the user to understand and how the analyst has interpreted his/her problem after looking at DFD’s.
  • 14.
    Data Flow Diagrams oDFD describes how data is manipulated within and at the boundaries of the system. o Logical DFD describes the flow of information of a system o Physical DFD describes how an information system is physically implemented.
  • 15.
    Components of DFD Process  Data flow  Data stores  External Entities.
  • 16.
    Symbolic Representation External Entity DataFlow Process Data Store Pay Bill AP Clerk 3
  • 17.
    Processes o A Processis a work or action performed on input data flow to produce an output data flow. o A Process must have at least one input data flow and at least one output data flow.
  • 18.
    Types of Processes oFunction: A set of related and ongoing activities of a business: e.g. sales. o Event: A logical unit of work that must be completed as a whole : e.g. collect payment. o Elementary Process: A discrete, detailed activity or task required to respond to an event.
  • 19.
    Data Flows o AData Flow represents a movement of data (info) among processes or data stores Data Stores o A Data Store is a storage of data, it contains information o There may be Physical or Computerized Data Stores. External Entities o An external entity defines a person, organization unit, or other organization that lies outside of the scope of the project
  • 20.
  • 22.
    Guidelines for drawingDFD  Should have no crossing lines.  Should not split into a number of data flows.  Should have no any flowchart structure like decision, iteration etc.  Do not include control or flow of control information.  Do not try to put too much information in one data flow diagram.  Data flows can only be from:  External entity to process  Process to external entity  Process to process  Process to stores  Stores to process
  • 23.
    Some Rules forData Flows o A data flow should never go unnamed. o In logical modeling, data flow names should describe the data flow without describing the implementation o All data flows must begin and/or end at a process.
  • 24.
    Advantages of Using DFD’s Represent data flows.  May be used at. high or low level of analysis.  Provide good system documentation.
  • 25.
    Steps to drawDFD Context Diagram o Identify the system and its boundaries (the context) o Identify external entities (providers, receivers of system info) o Identify external data flows (input, output)
  • 26.
    Level-0 DFD o Identifywhat is being done between each input and its corresponding output o Identify the processes (functions of the system) o Identify external data flows between external entities and processes o Identify internal data flows between processes and data stores Level-1 DFD’s o Sub-processes (activities of tasks) of Level-0 processes (system functions)
  • 27.
    IS 431 :Lecture 4 M N P M N P Context Diagram Level-0 Diagram Level-1 Diagram 1 3 2 0 D1 Fig: Decomposition of Context Diagram
  • 28.
  • 29.