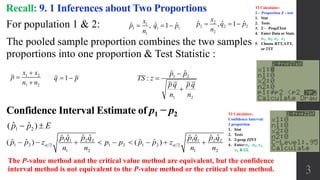
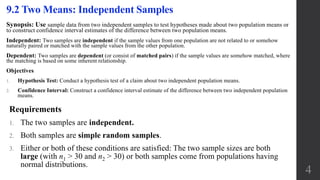
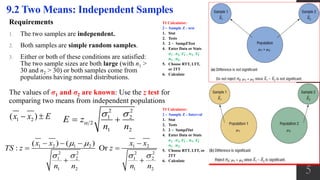
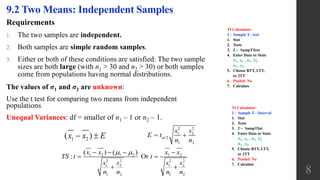
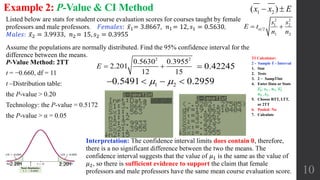
Elementary Statistics
Chapter 9:
Inferences from Two
Samples
9.2 Two Means:
Independent Samples
1
Chapter 9: Inferences from Two Samples
9. 1 Two Proportions
9.2 Two Means: Independent Samples
9.3 Two Dependent Samples (Matched Pairs)
9.4 Two Variances or Standard Deviations
2
Objectives:
• Test the difference between two proportions.
• Test the difference between sample means, using the z test.
• Test the difference between two means for independent samples, using the t test.
• Test the difference between two means for dependent samples.
• Test the difference between two variances or standard deviations.
For population 1 & 2:
3
Recall: 9. 1 Inferences about Two Proportions
2
2 2 2
2
ˆ ˆ ˆ, 1
x
p q p
n
  1
1 1 1
1
ˆ ˆ ˆ, 1
x
p q p
n
  
1 2
1 2
x x
p
n n



1q p 
The pooled sample proportion combines the two samples
proportions into one proportion & Test Statistic :
1 2
1 2
ˆ ˆ
:
p p
TS z
p q p q
n n



Confidence Interval Estimate of p1 − p2
1 1 2 2 1 1 2 2
1 2 2 1 2 1 2 2
1 2 1 2
ˆ ˆ ˆ ˆ ˆ ˆ ˆ ˆ
ˆ ˆ ˆ ˆ( ) ( )
p q p q p q p q
p p z p p p p z
n n n n
         
1 2
ˆ ˆ( )p p E 
The P-value method and the critical value method are equivalent, but the confidence
interval method is not equivalent to the P-value method or the critical value method.
TI Calculator:
Confidence Interval:
2 proportion
1. Stat
2. Tests
3. 2-prop ZINT
4. Enter:𝒏 𝟏 , 𝒏 𝟐, 𝒙 𝟏,
𝒙 𝟐 & CL
TI Calculator:
2 - Proportion Z - test
1. Stat
2. Tests
3. 2 ‒ PropZTest
4. Enter Data or Stats
𝒏 𝟏 , 𝒏 𝟐, 𝒙 𝟏, 𝒙 𝟐
5. Choose RTT, LTT,
or 2TT
Synopsis: Use sample data from two independent samples to test hypotheses made about two population means or
to construct confidence interval estimates of the difference between two population means.
Independent: Two samples are independent if the sample values from one population are not related to or somehow
naturally paired or matched with the sample values from the other population.
Dependent: Two samples are dependent (or consist of matched pairs) if the sample values are somehow matched, where
the matching is based on some inherent relationship.
Objectives
1. Hypothesis Test: Conduct a hypothesis test of a claim about two independent population means.
2. Confidence Interval: Construct a confidence interval estimate of the difference between two independent population
means.
9.2 Two Means: Independent Samples
Requirements
1. The two samples are independent.
2. Both samples are simple random samples.
3. Either or both of these conditions are satisfied: The two sample sizes are both
large (with n1 > 30 and n2 > 30) or both samples come from populations having
normal distributions.
4
9.2 Two Means: Independent Samples
Requirements
1. The two samples are independent.
2. Both samples are simple random samples.
3. Either or both of these conditions are satisfied:
The two sample sizes are both large (with n1 >
30 and n2 > 30) or both samples come from
populations having normal distributions.
5
The values of σ1 and σ2 are known: Use the z test for
comparing two means from independent populations
1 2 1 2 1 2
2 2 2 2
1 2 1 2
1 2 1 2
( ) ( )
: Or
x x x x
TS z z
n n n n
 
   
   
 
 
2 2
1 2
2
1 2
E z
n n

 
 1 2( )x x E 
TI Calculator:
2 - Sample Z - test
1. Stat
2. Tests
3. 2 ‒ SampZTest
4. Enter Data or Stats
𝝈 𝟏 , 𝝈 𝟐, 𝒙 𝟏 , 𝒏 𝟏, 𝒙 𝟐
𝒏 𝟏 , 𝒏 𝟐,
5. Choose RTT, LTT,
or 2TT
6. Calculate
TI Calculator:
2 - Sample Z - Interval
1. Stat
2. Tests
3. 2 ‒ SampZInt
4. Enter Data or Stats
𝝈 𝟏 , 𝝈 𝟐, 𝒙 𝟏 , 𝒏 𝟏, 𝒙 𝟐
𝒏 𝟏 , 𝒏 𝟐,
5. Choose RTT, LTT, or
2TT
6. Calculate
Decision:
a. Reject H0
b. The claim is True
c. There is enough evidence to
support the claim that the means
are not equal. Hence, there is a
significant difference in the rates. 6
A survey found that the average hotel room rate in an upscale area is
$88.42 and the average room rate in downtown area is $80.61. Each
sample contained 50 hotels. Assume that the standard deviations of the
populations are $5.62 and $4.83, respectively. At α = 0.05, can it be
concluded that there is a significant difference in the rates?
Example 1: CV Method
CV: α = 0.05 →
𝑧 = ±1.96
Step 1: H0: μ1 = μ2 , H1: μ1  μ2 (claim), 2TTGiven: SRS:
𝑈𝑝𝑠𝑐𝑎𝑙𝑒: 𝑥1 = $88.42,
𝑛1= 50, 𝜎1 = $5.62
𝐷𝑜𝑤𝑛𝑡𝑜𝑤𝑛: 𝑥2 = $80.61,
𝑛2= 50, 𝜎2 = $4.83
Step 1: H0 , H1, claim & Tails
Step 2: TS Calculate (TS)
Step 3: CV using α
Step 4: Make the decision to
a. Reject or not H0
b. The claim is true or false
c. Restate this decision: There
is / is not sufficient evidence
to support the claim that…
2 2
88.42 80.61
:
5.62 4.83
50 50
TS z



7.45
1 2 1 2
2 2
1 2
1 2
( ) ( )x x
z
n n
 
 
  


TI Calculator:
2 - Sample Z - test
1. Stat
2. Tests
3. 2 ‒ SampZTest
4. Enter Data or Stats
𝝈 𝟏 , 𝝈 𝟐, 𝒙 𝟏 , 𝒏 𝟏, 𝒙 𝟐
𝒏 𝟏 , 𝒏 𝟐,
5. Choose RTT, LTT,
or 2TT
6. Calculate
7
A survey found that the average hotel room rate in an upscale area is $88.42
and the average room rate in downtown area is $80.61. Each sample
contained 50 hotels. Assume that the standard deviations of the populations
are $5.62 and $4.83, respectively. At α = 0.05, can it be concluded that there
is a significant difference in the rates? Find the 95% confidence interval for
the difference between the means.
Example 1: CI Method
Given: SRS:
𝑈𝑝𝑠𝑐𝑎𝑙𝑒: 𝑥1 = $88.42, 𝑛1 = 50, 𝜎1 = $5.62
𝐷𝑜𝑤𝑛𝑡𝑜𝑤𝑛: 𝑥2 = $80.61, 𝑛2 = 50, 𝜎2 = $4.83
Step 1: H0 , H1, claim & Tails
Step 2: TS Calculate (TS)
Step 3: CV using α
Step 4: Make the decision to
a. Reject or not H0
b. The claim is true or false
c. Restate this decision: There
is / is not sufficient evidence to
support the claim that…
(88.42 80.61) 2.05 
1 25.76 9.86   
2.05
2 2
5.62 4.83
1.96
50 50
E  
1 27.81 2.05 7.81 2.05     
Interpretation: The confidence interval
limits do not contain 0, therefore, there is a
significant difference between the two
average rates. The confidence interval
indicates that the value of 𝜇1 is greater than
the value of 𝜇2, so there seems to be
sufficient evidence to support the claim
that there is a significant difference in the
rates.
2 2
1 2
2
1 2
E z
n n

 
 
1 2( )x x E 
TI Calculator:
2 - Sample Z - Interval
1. Stat
2. Tests
3. 2 ‒ SampZInt
4. Enter Data or Stats
𝝈 𝟏 , 𝝈 𝟐, 𝒙 𝟏 , 𝒏 𝟏, 𝒙 𝟐
𝒏 𝟏 , 𝒏 𝟐,
5. Choose RTT, LTT, or
2TT
6. Calculate
9.2 Two Means: Independent Samples
Requirements
1. The two samples are independent.
2. Both samples are simple random samples.
3. Either or both of these conditions are satisfied: The two sample
sizes are both large (with n1 > 30 and n2 > 30) or both samples
come from populations having normal distributions.
8
The values of σ1 and σ2 are unknown:
Use the t test for comparing two means from independent
populations
Unequal Variances: df = smaller of n1 – 1 or n2 – 1.
2 2
1 2
2
1 2
s s
E t
n n
 
1 2( )x x E 
1 2 1 2 1 2
2 2 2 2
1 2 1 2
1 2 1 2
( ) ( )
: Or
x x x x
TS t t
s s s s
n n n n
    
 
 
TI Calculator:
2 - Sample T - test
1. Stat
2. Tests
3. 2 ‒ SampTTest
4. Enter Data or Stats
𝒙 𝟏, 𝒔 𝟏 , 𝒏 𝟏, 𝒙 𝟐
𝒏 𝟏 , 𝒔 𝟐,
5. Choose RTT, LTT,
or 2TT
6. Pooled: No
7. Calculate
TI Calculator:
2 - Sample T - Interval
1. Stat
2. Tests
3. 2 ‒ SampTInt
4. Enter Data or Stats
𝒙 𝟏, 𝒔 𝟏 , 𝒏 𝟏, 𝒙 𝟐
𝒏 𝟏 , 𝒔 𝟐,
5. Choose RTT, LTT,
or 2TT
6. Pooled: No
7. Calculate
Decision:
a. Do not Reject H0
b. The claim is True
c. There is sufficient evidence to support the claim
that female professors and male professors have
the same mean course evaluation score. 9
Listed below are stats for student course evaluation scores for courses
taught by female professors and male professors.
Females: 𝑥1= 3.8667, 𝑛1 = 12, 𝑠1 = 0.5630, Males: 𝑥2 = 3.9933, 𝑛2 = 15, 𝑠2 = 0.3955
Use a 0.05 significance level to test the claim that the two samples are from populations with
the same mean.? Assume the populations are normally distributed.
Example 2: CV Method
CV: α = 0.05, df = smaller of
n1 – 1 or n2 – 1 = 12 – 1 = 11
→ t = ±2.201
H0: μ1 = μ2 , Claim & H1: μ1  μ2 , 2TT
Step 1: H0 , H1, claim & Tails
Step 2: TS Calculate (TS)
Step 3: CV using α
Step 4: Make the decision to
a. Reject or not H0
b. The claim is true or false
c. Restate this decision: There is / is not sufficient
evidence to support the claim that…
2 2
3.8667 3.9933
:
0.5630 0.3955
12 15
TS t



0.660 
1 2 1 2
2 2
1 2
1 2
( ) ( )x x
t
s s
n n
   


TI Calculator:
2 - Sample T - test
1. Stat
2. Tests
3. 2 ‒ SampTTest
4. Enter Data or Stats
𝒙 𝟏, 𝒔 𝟏 , 𝒏 𝟏, 𝒙 𝟐
𝒏 𝟏 , 𝒔 𝟐,
5. Choose RTT, LTT,
or 2TT
6. Pooled: No
7. Calculate
10
Listed below are stats for student course evaluation scores for courses taught by female
professors and male professors. 𝐹𝑒𝑚𝑎𝑙𝑒𝑠: 𝑥1= 3.8667, 𝑛1 = 12, 𝑠1 = 0.5630,
𝑀𝑎𝑙𝑒𝑠: 𝑥2 = 3.9933, 𝑛2 = 15, 𝑠2 = 0.3955
Assume the populations are normally distributed. Find the 95% confidence interval for the
difference between the means.
Example 2: P-Value & CI Method
2 2
1 2
2
1 2
s s
E t
n n
 
2 2
0.5630 0.3955
2.201
12 15
E   0.42245
1 20.5491 0.2959    
P-Value Method: 2TT
t = −0.660, df = 11
t –Distribution table:
the P-value > 0.20
Technology: the P-value = 0.5172
the P-value > α = 0.05
Interpretation: The confidence interval limits does contain 0, therefore,
there is a no significant difference between the two the means. The
confidence interval suggests that the value of 𝜇1 is the same as the value of
𝜇2, so there is sufficient evidence to support the claim that female
professors and male professors have the same mean course evaluation score.
1 2( )x x E 
TI Calculator:
2 - Sample T - Interval
1. Stat
2. Tests
3. 2 ‒ SampTInt
4. Enter Data or Stats
𝒙 𝟏, 𝒔 𝟏 , 𝒏 𝟏, 𝒙 𝟐
𝒏 𝟏 , 𝒔 𝟐,
5. Choose RTT, LTT,
or 2TT
6. Pooled: No
7. Calculate

Two Means Independent Samples

  • 1.
    Elementary Statistics Chapter 9: Inferencesfrom Two Samples 9.2 Two Means: Independent Samples 1
  • 2.
    Chapter 9: Inferencesfrom Two Samples 9. 1 Two Proportions 9.2 Two Means: Independent Samples 9.3 Two Dependent Samples (Matched Pairs) 9.4 Two Variances or Standard Deviations 2 Objectives: • Test the difference between two proportions. • Test the difference between sample means, using the z test. • Test the difference between two means for independent samples, using the t test. • Test the difference between two means for dependent samples. • Test the difference between two variances or standard deviations.
  • 3.
    For population 1& 2: 3 Recall: 9. 1 Inferences about Two Proportions 2 2 2 2 2 ˆ ˆ ˆ, 1 x p q p n   1 1 1 1 1 ˆ ˆ ˆ, 1 x p q p n    1 2 1 2 x x p n n    1q p  The pooled sample proportion combines the two samples proportions into one proportion & Test Statistic : 1 2 1 2 ˆ ˆ : p p TS z p q p q n n    Confidence Interval Estimate of p1 − p2 1 1 2 2 1 1 2 2 1 2 2 1 2 1 2 2 1 2 1 2 ˆ ˆ ˆ ˆ ˆ ˆ ˆ ˆ ˆ ˆ ˆ ˆ( ) ( ) p q p q p q p q p p z p p p p z n n n n           1 2 ˆ ˆ( )p p E  The P-value method and the critical value method are equivalent, but the confidence interval method is not equivalent to the P-value method or the critical value method. TI Calculator: Confidence Interval: 2 proportion 1. Stat 2. Tests 3. 2-prop ZINT 4. Enter:𝒏 𝟏 , 𝒏 𝟐, 𝒙 𝟏, 𝒙 𝟐 & CL TI Calculator: 2 - Proportion Z - test 1. Stat 2. Tests 3. 2 ‒ PropZTest 4. Enter Data or Stats 𝒏 𝟏 , 𝒏 𝟐, 𝒙 𝟏, 𝒙 𝟐 5. Choose RTT, LTT, or 2TT
  • 4.
    Synopsis: Use sampledata from two independent samples to test hypotheses made about two population means or to construct confidence interval estimates of the difference between two population means. Independent: Two samples are independent if the sample values from one population are not related to or somehow naturally paired or matched with the sample values from the other population. Dependent: Two samples are dependent (or consist of matched pairs) if the sample values are somehow matched, where the matching is based on some inherent relationship. Objectives 1. Hypothesis Test: Conduct a hypothesis test of a claim about two independent population means. 2. Confidence Interval: Construct a confidence interval estimate of the difference between two independent population means. 9.2 Two Means: Independent Samples Requirements 1. The two samples are independent. 2. Both samples are simple random samples. 3. Either or both of these conditions are satisfied: The two sample sizes are both large (with n1 > 30 and n2 > 30) or both samples come from populations having normal distributions. 4
  • 5.
    9.2 Two Means:Independent Samples Requirements 1. The two samples are independent. 2. Both samples are simple random samples. 3. Either or both of these conditions are satisfied: The two sample sizes are both large (with n1 > 30 and n2 > 30) or both samples come from populations having normal distributions. 5 The values of σ1 and σ2 are known: Use the z test for comparing two means from independent populations 1 2 1 2 1 2 2 2 2 2 1 2 1 2 1 2 1 2 ( ) ( ) : Or x x x x TS z z n n n n               2 2 1 2 2 1 2 E z n n     1 2( )x x E  TI Calculator: 2 - Sample Z - test 1. Stat 2. Tests 3. 2 ‒ SampZTest 4. Enter Data or Stats 𝝈 𝟏 , 𝝈 𝟐, 𝒙 𝟏 , 𝒏 𝟏, 𝒙 𝟐 𝒏 𝟏 , 𝒏 𝟐, 5. Choose RTT, LTT, or 2TT 6. Calculate TI Calculator: 2 - Sample Z - Interval 1. Stat 2. Tests 3. 2 ‒ SampZInt 4. Enter Data or Stats 𝝈 𝟏 , 𝝈 𝟐, 𝒙 𝟏 , 𝒏 𝟏, 𝒙 𝟐 𝒏 𝟏 , 𝒏 𝟐, 5. Choose RTT, LTT, or 2TT 6. Calculate
  • 6.
    Decision: a. Reject H0 b.The claim is True c. There is enough evidence to support the claim that the means are not equal. Hence, there is a significant difference in the rates. 6 A survey found that the average hotel room rate in an upscale area is $88.42 and the average room rate in downtown area is $80.61. Each sample contained 50 hotels. Assume that the standard deviations of the populations are $5.62 and $4.83, respectively. At α = 0.05, can it be concluded that there is a significant difference in the rates? Example 1: CV Method CV: α = 0.05 → 𝑧 = ±1.96 Step 1: H0: μ1 = μ2 , H1: μ1  μ2 (claim), 2TTGiven: SRS: 𝑈𝑝𝑠𝑐𝑎𝑙𝑒: 𝑥1 = $88.42, 𝑛1= 50, 𝜎1 = $5.62 𝐷𝑜𝑤𝑛𝑡𝑜𝑤𝑛: 𝑥2 = $80.61, 𝑛2= 50, 𝜎2 = $4.83 Step 1: H0 , H1, claim & Tails Step 2: TS Calculate (TS) Step 3: CV using α Step 4: Make the decision to a. Reject or not H0 b. The claim is true or false c. Restate this decision: There is / is not sufficient evidence to support the claim that… 2 2 88.42 80.61 : 5.62 4.83 50 50 TS z    7.45 1 2 1 2 2 2 1 2 1 2 ( ) ( )x x z n n          TI Calculator: 2 - Sample Z - test 1. Stat 2. Tests 3. 2 ‒ SampZTest 4. Enter Data or Stats 𝝈 𝟏 , 𝝈 𝟐, 𝒙 𝟏 , 𝒏 𝟏, 𝒙 𝟐 𝒏 𝟏 , 𝒏 𝟐, 5. Choose RTT, LTT, or 2TT 6. Calculate
  • 7.
    7 A survey foundthat the average hotel room rate in an upscale area is $88.42 and the average room rate in downtown area is $80.61. Each sample contained 50 hotels. Assume that the standard deviations of the populations are $5.62 and $4.83, respectively. At α = 0.05, can it be concluded that there is a significant difference in the rates? Find the 95% confidence interval for the difference between the means. Example 1: CI Method Given: SRS: 𝑈𝑝𝑠𝑐𝑎𝑙𝑒: 𝑥1 = $88.42, 𝑛1 = 50, 𝜎1 = $5.62 𝐷𝑜𝑤𝑛𝑡𝑜𝑤𝑛: 𝑥2 = $80.61, 𝑛2 = 50, 𝜎2 = $4.83 Step 1: H0 , H1, claim & Tails Step 2: TS Calculate (TS) Step 3: CV using α Step 4: Make the decision to a. Reject or not H0 b. The claim is true or false c. Restate this decision: There is / is not sufficient evidence to support the claim that… (88.42 80.61) 2.05  1 25.76 9.86    2.05 2 2 5.62 4.83 1.96 50 50 E   1 27.81 2.05 7.81 2.05      Interpretation: The confidence interval limits do not contain 0, therefore, there is a significant difference between the two average rates. The confidence interval indicates that the value of 𝜇1 is greater than the value of 𝜇2, so there seems to be sufficient evidence to support the claim that there is a significant difference in the rates. 2 2 1 2 2 1 2 E z n n      1 2( )x x E  TI Calculator: 2 - Sample Z - Interval 1. Stat 2. Tests 3. 2 ‒ SampZInt 4. Enter Data or Stats 𝝈 𝟏 , 𝝈 𝟐, 𝒙 𝟏 , 𝒏 𝟏, 𝒙 𝟐 𝒏 𝟏 , 𝒏 𝟐, 5. Choose RTT, LTT, or 2TT 6. Calculate
  • 8.
    9.2 Two Means:Independent Samples Requirements 1. The two samples are independent. 2. Both samples are simple random samples. 3. Either or both of these conditions are satisfied: The two sample sizes are both large (with n1 > 30 and n2 > 30) or both samples come from populations having normal distributions. 8 The values of σ1 and σ2 are unknown: Use the t test for comparing two means from independent populations Unequal Variances: df = smaller of n1 – 1 or n2 – 1. 2 2 1 2 2 1 2 s s E t n n   1 2( )x x E  1 2 1 2 1 2 2 2 2 2 1 2 1 2 1 2 1 2 ( ) ( ) : Or x x x x TS t t s s s s n n n n          TI Calculator: 2 - Sample T - test 1. Stat 2. Tests 3. 2 ‒ SampTTest 4. Enter Data or Stats 𝒙 𝟏, 𝒔 𝟏 , 𝒏 𝟏, 𝒙 𝟐 𝒏 𝟏 , 𝒔 𝟐, 5. Choose RTT, LTT, or 2TT 6. Pooled: No 7. Calculate TI Calculator: 2 - Sample T - Interval 1. Stat 2. Tests 3. 2 ‒ SampTInt 4. Enter Data or Stats 𝒙 𝟏, 𝒔 𝟏 , 𝒏 𝟏, 𝒙 𝟐 𝒏 𝟏 , 𝒔 𝟐, 5. Choose RTT, LTT, or 2TT 6. Pooled: No 7. Calculate
  • 9.
    Decision: a. Do notReject H0 b. The claim is True c. There is sufficient evidence to support the claim that female professors and male professors have the same mean course evaluation score. 9 Listed below are stats for student course evaluation scores for courses taught by female professors and male professors. Females: 𝑥1= 3.8667, 𝑛1 = 12, 𝑠1 = 0.5630, Males: 𝑥2 = 3.9933, 𝑛2 = 15, 𝑠2 = 0.3955 Use a 0.05 significance level to test the claim that the two samples are from populations with the same mean.? Assume the populations are normally distributed. Example 2: CV Method CV: α = 0.05, df = smaller of n1 – 1 or n2 – 1 = 12 – 1 = 11 → t = ±2.201 H0: μ1 = μ2 , Claim & H1: μ1  μ2 , 2TT Step 1: H0 , H1, claim & Tails Step 2: TS Calculate (TS) Step 3: CV using α Step 4: Make the decision to a. Reject or not H0 b. The claim is true or false c. Restate this decision: There is / is not sufficient evidence to support the claim that… 2 2 3.8667 3.9933 : 0.5630 0.3955 12 15 TS t    0.660  1 2 1 2 2 2 1 2 1 2 ( ) ( )x x t s s n n       TI Calculator: 2 - Sample T - test 1. Stat 2. Tests 3. 2 ‒ SampTTest 4. Enter Data or Stats 𝒙 𝟏, 𝒔 𝟏 , 𝒏 𝟏, 𝒙 𝟐 𝒏 𝟏 , 𝒔 𝟐, 5. Choose RTT, LTT, or 2TT 6. Pooled: No 7. Calculate
  • 10.
    10 Listed below arestats for student course evaluation scores for courses taught by female professors and male professors. 𝐹𝑒𝑚𝑎𝑙𝑒𝑠: 𝑥1= 3.8667, 𝑛1 = 12, 𝑠1 = 0.5630, 𝑀𝑎𝑙𝑒𝑠: 𝑥2 = 3.9933, 𝑛2 = 15, 𝑠2 = 0.3955 Assume the populations are normally distributed. Find the 95% confidence interval for the difference between the means. Example 2: P-Value & CI Method 2 2 1 2 2 1 2 s s E t n n   2 2 0.5630 0.3955 2.201 12 15 E   0.42245 1 20.5491 0.2959     P-Value Method: 2TT t = −0.660, df = 11 t –Distribution table: the P-value > 0.20 Technology: the P-value = 0.5172 the P-value > α = 0.05 Interpretation: The confidence interval limits does contain 0, therefore, there is a no significant difference between the two the means. The confidence interval suggests that the value of 𝜇1 is the same as the value of 𝜇2, so there is sufficient evidence to support the claim that female professors and male professors have the same mean course evaluation score. 1 2( )x x E  TI Calculator: 2 - Sample T - Interval 1. Stat 2. Tests 3. 2 ‒ SampTInt 4. Enter Data or Stats 𝒙 𝟏, 𝒔 𝟏 , 𝒏 𝟏, 𝒙 𝟐 𝒏 𝟏 , 𝒔 𝟐, 5. Choose RTT, LTT, or 2TT 6. Pooled: No 7. Calculate