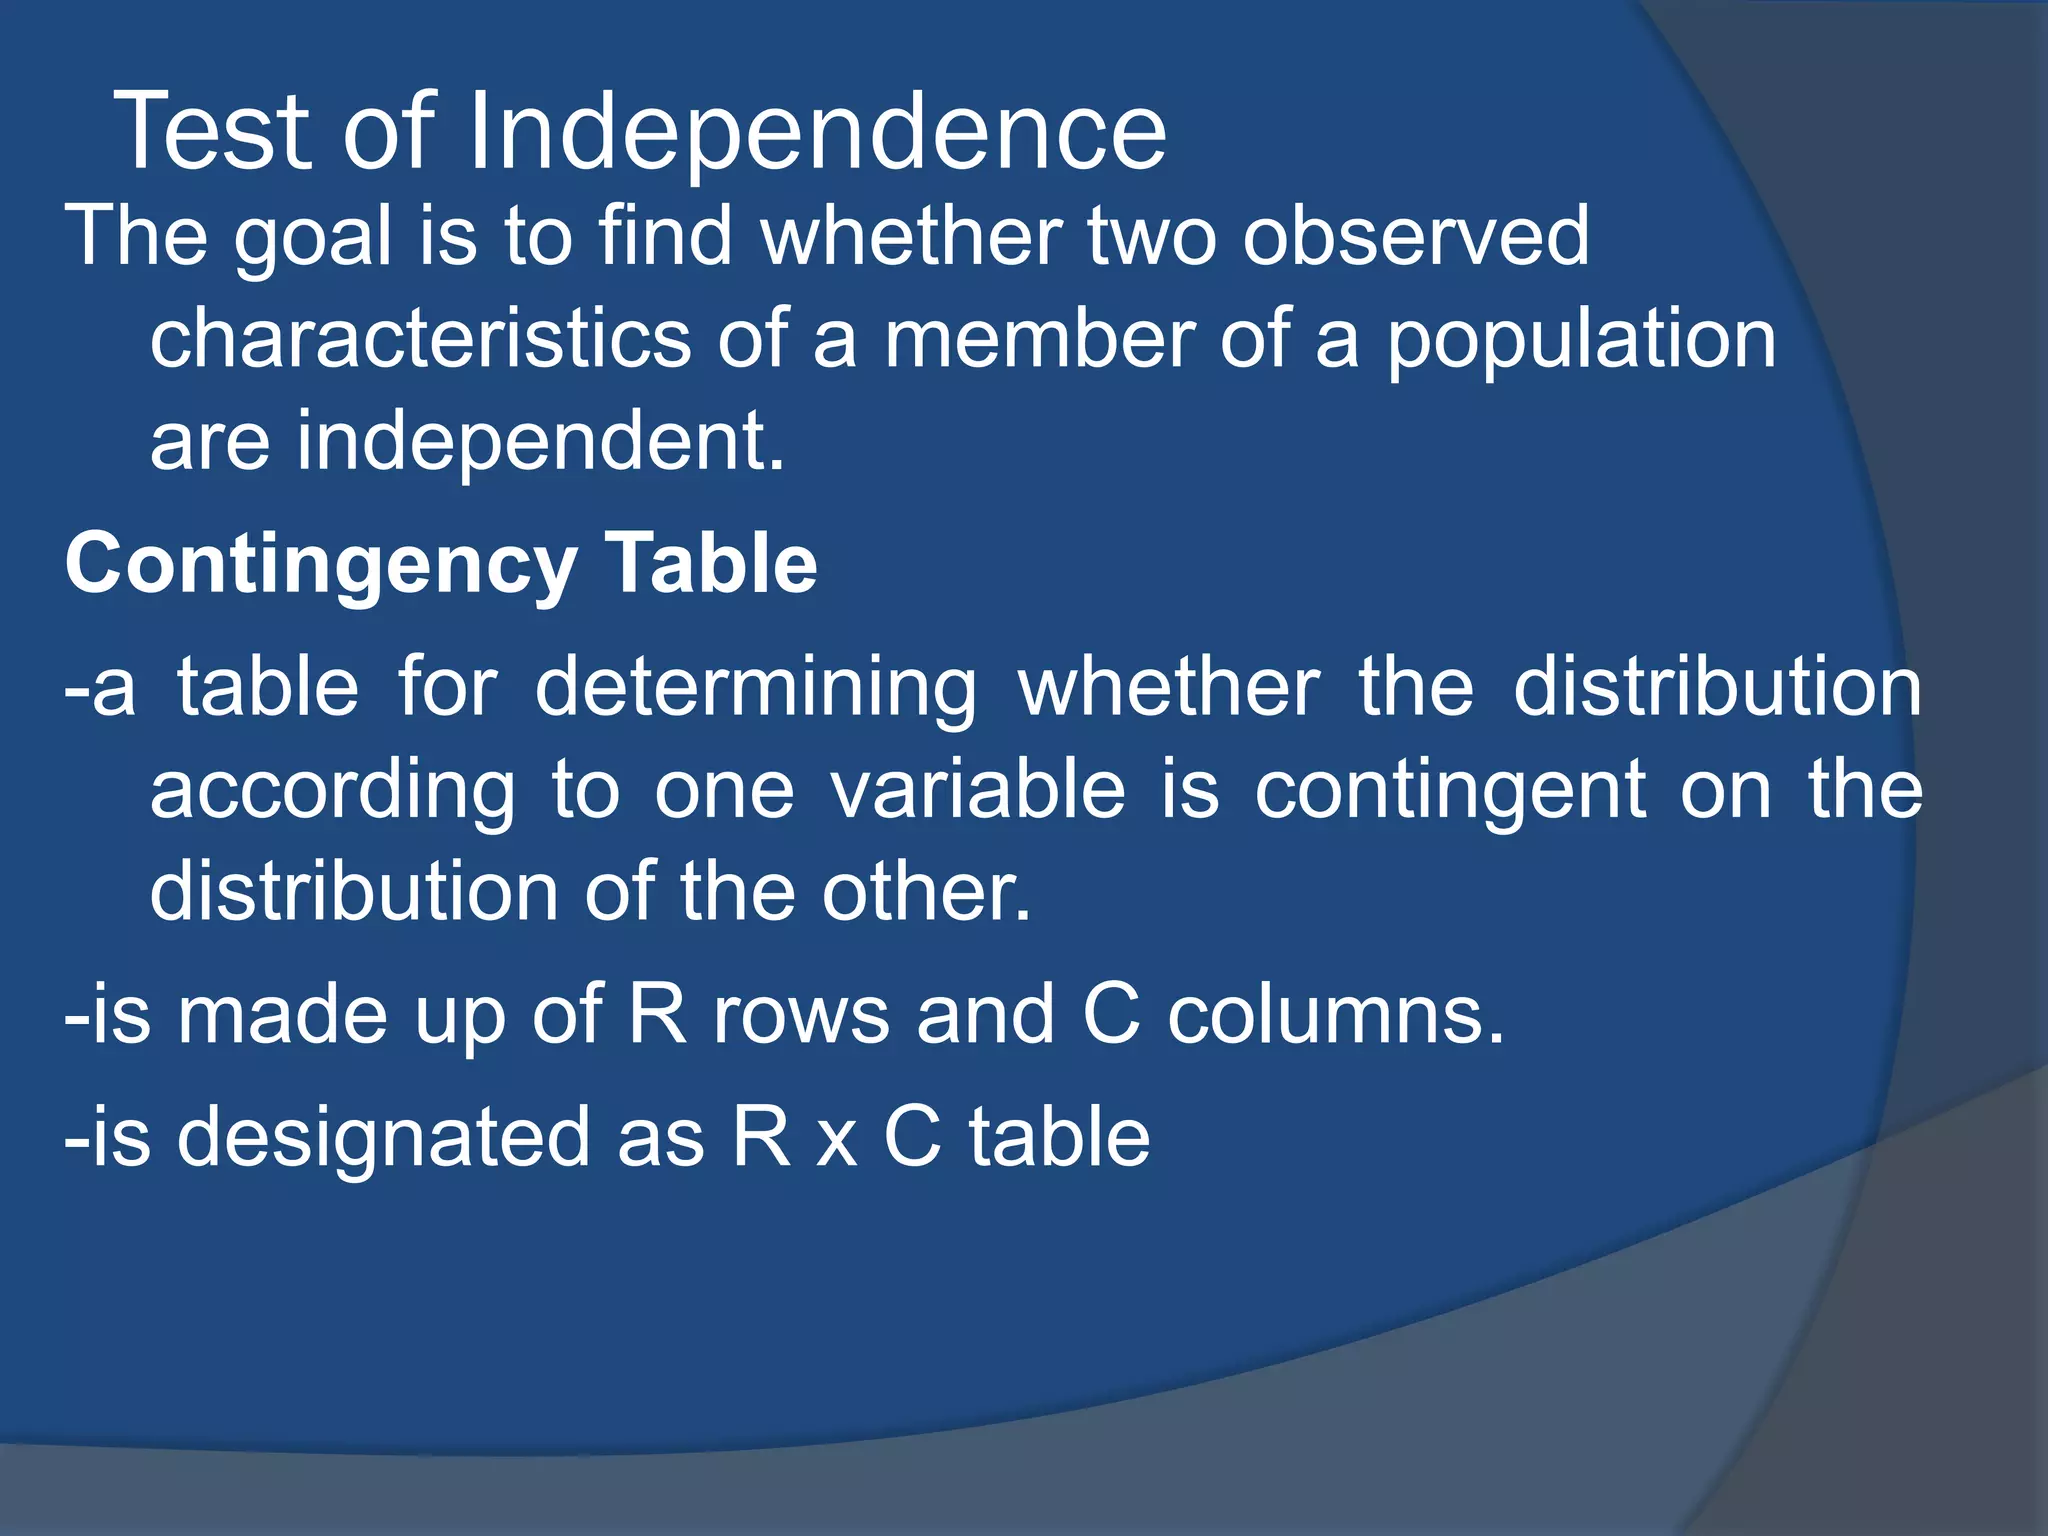
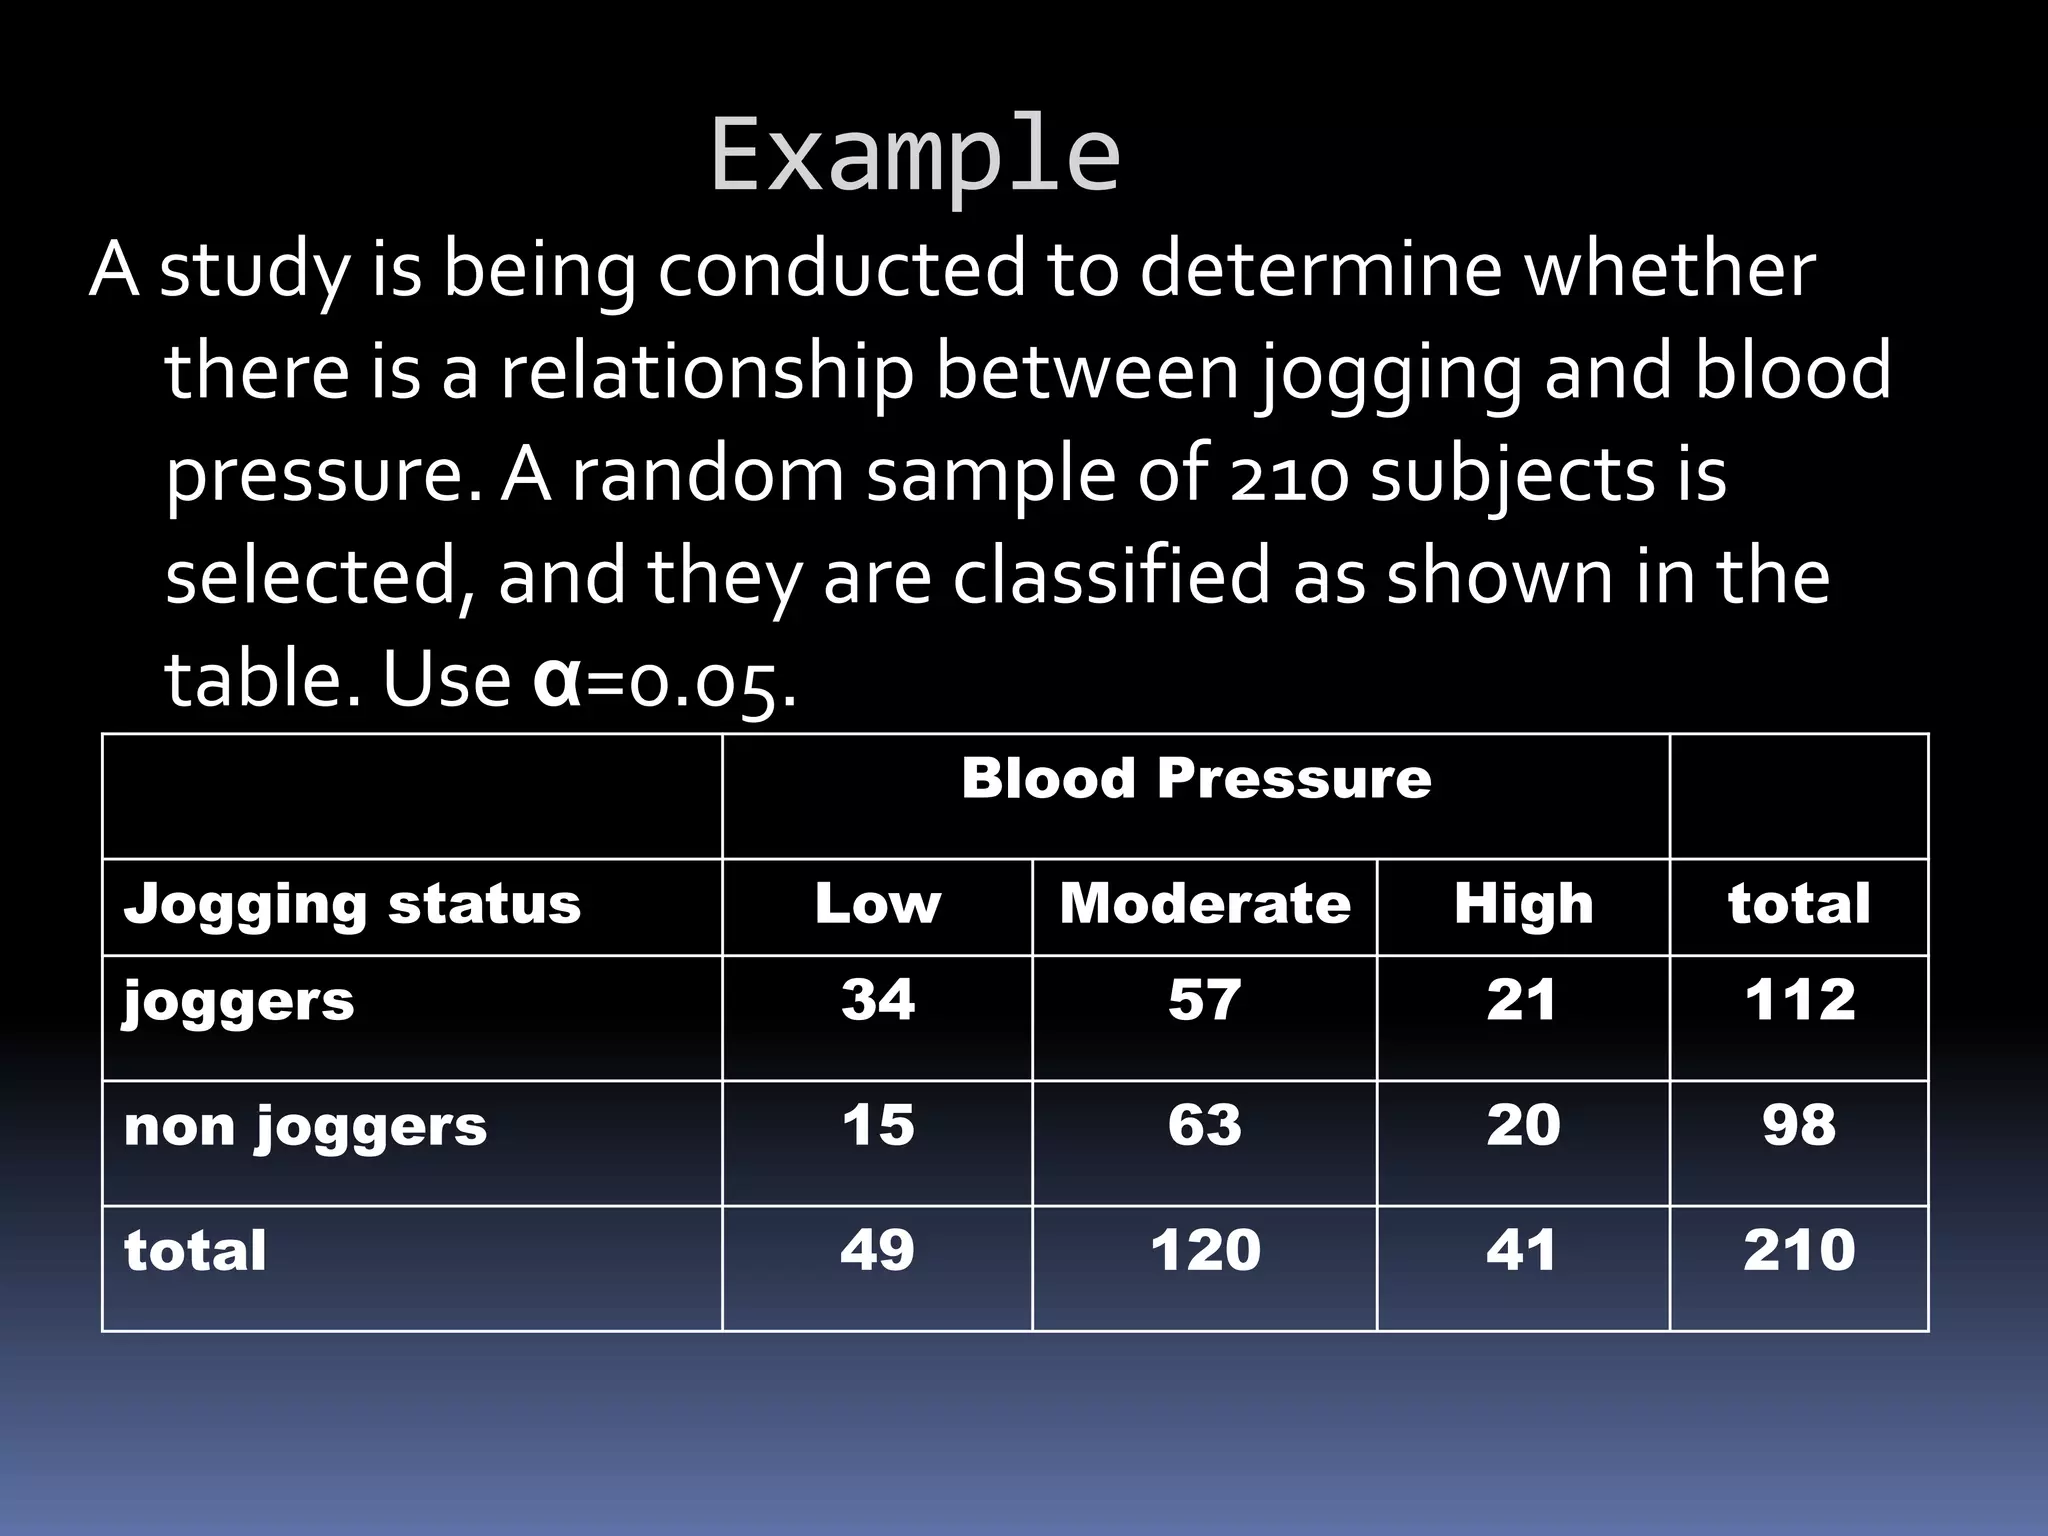
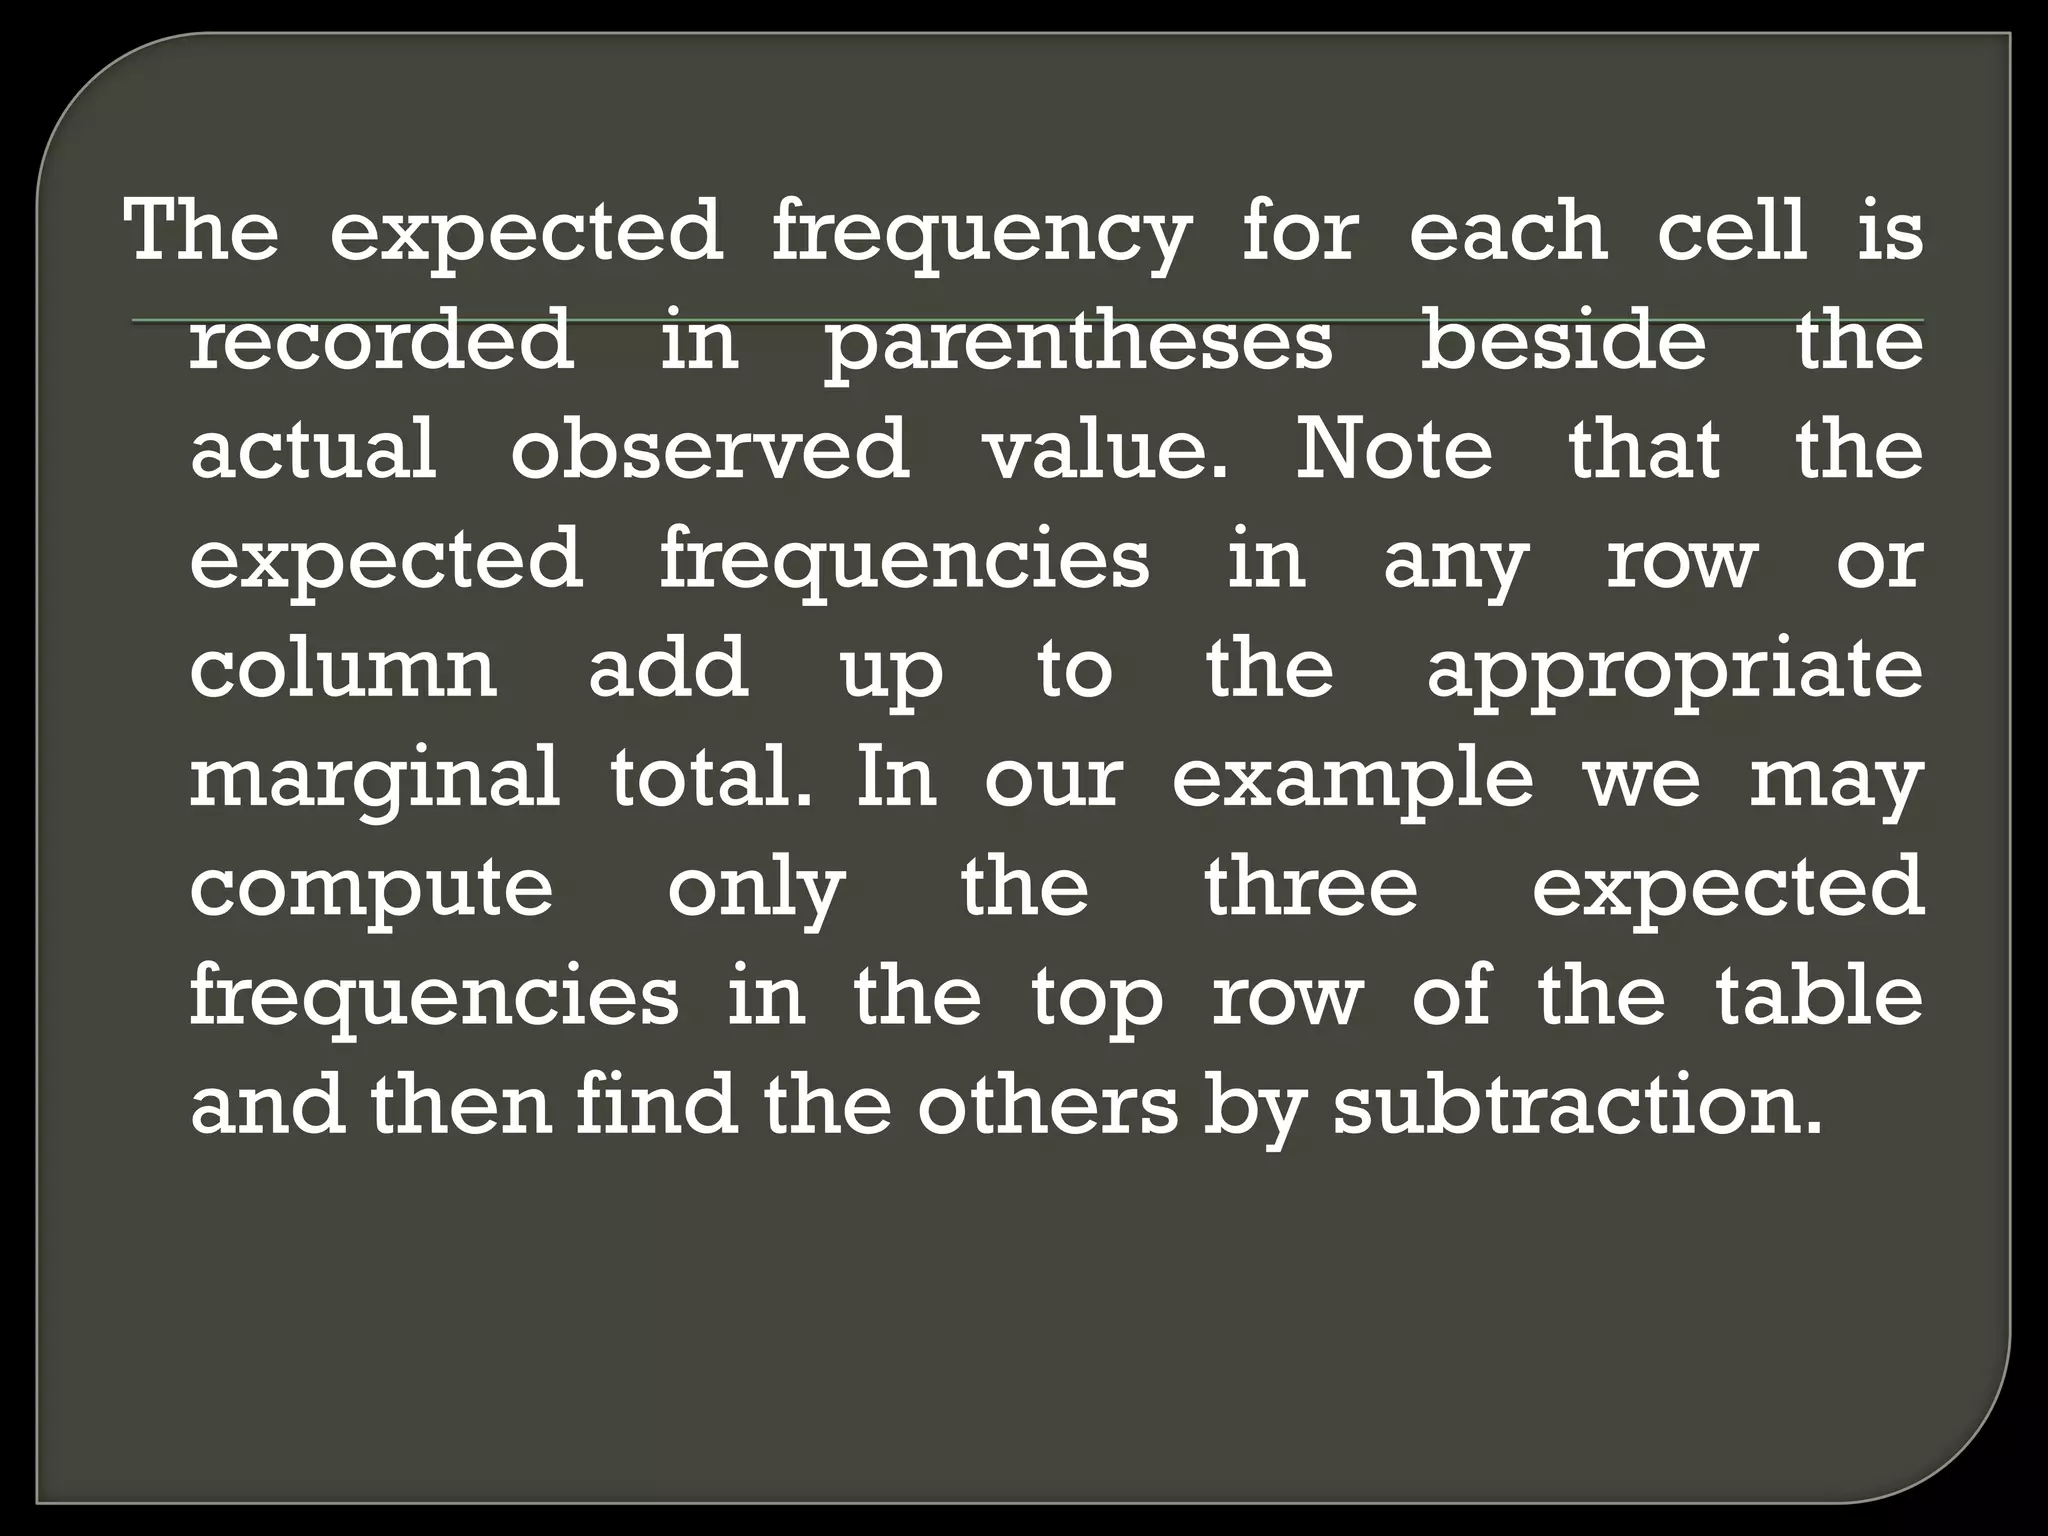
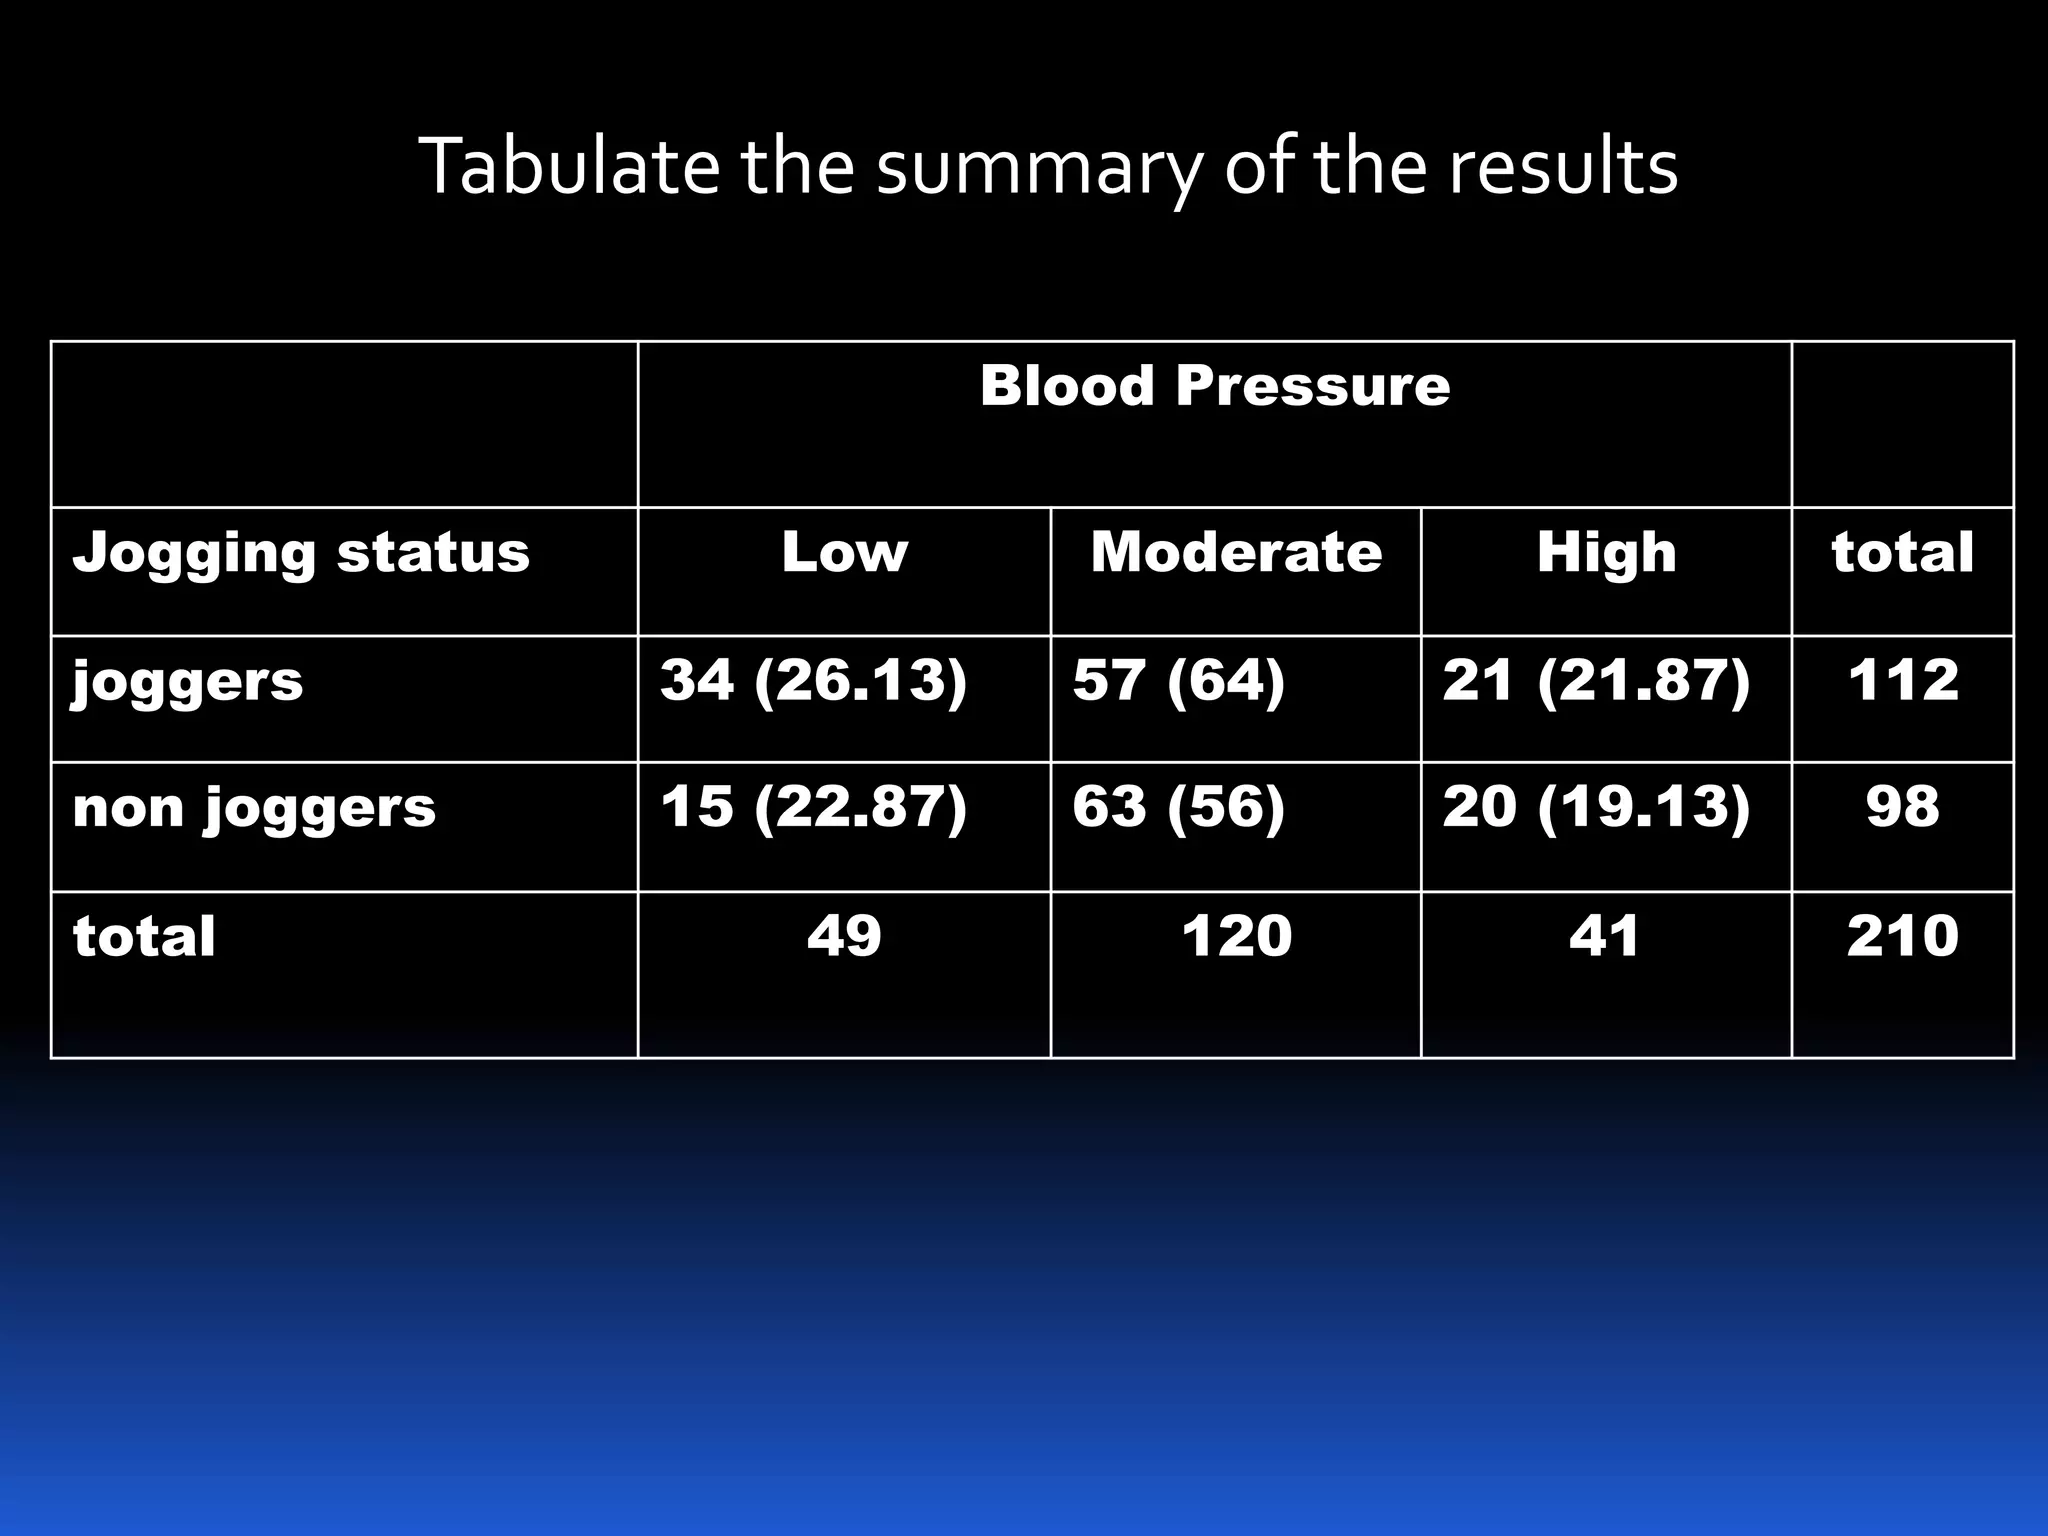
Test
for   Independence
Test of Independence
The goal is to find whether two observed
   characteristics of a member of a population
   are independent.
Contingency Table
-a table for determining whether the distribution
   according to one variable is contingent on the
   distribution of the other.
-is made up of R rows and C columns.
-is designated as R x C table
Suppose we pick a sample size n and classify
 the data in a two-way table on the basis of
 the two variables.

             Column1    Column 2   Column3


 Row 1         C11        C12        C13

 Row 2         C21        C22        C23
The degrees of freedom for any contingency
  table are
(no. of rows-1) x (no. of columns-1) or
 v= (R-1) (C-1)

If x2>xa2    with v=(r-1)(c-1) degrees of
  freedom, reject the null hypothesis of
  independence at the a level of
  significance; otherwise, accept the null
  hypothesis.
Computation of Expected
           Frequencies
1. Find the sum of each row and each
   column, and find the grand total.
2. For each cell, multiply the
   corresponding row sum by the column
   sum and divide by the grand total, to
   get the expected value.
3. Place the expected values in the
   corresponding cells along with the
   observed values.
The general formula for obtaining the expected
 frequency of any cell is given by:


Expected frequency=(column total)x (row total)
                             grand total
Example
A study is being conducted to determine whether
  there is a relationship between jogging and blood
  pressure. A random sample of 210 subjects is
  selected, and they are classified as shown in the
  table. Use α=0.05.
                          Blood Pressure

 Jogging status     Low     Moderate       High   total
 joggers             34         57         21     112

 non joggers         15         63         20      98

 total               49        120         41     210
Solution
Step 1
H0: The blood pressure of a person does not depend
  on whether he jogs or not.
Ha: The blood pressure of a person depends on
  whether he jogs or not.
Step 2
Determine the critical value.
  v= (R-1) (C-1)
    = (2-1) (3-1)
    = (1) (2)
v= 2
Using the table, the critical value is 5.991.
Step 3
Decision Rule: Reject H0 if χ2 > 5.991
Step 4
Compute the test statistic. First, compute for the
  expected values
E11=(112)(49) = 26.13 E22=(98) (120) = 56
       210                       210

E21=(98)(49)               E13=(112) (41)
                 = 22.87                  = 21.87
       210                        210

E12=(112)(120)             E23=(98) (41)
                  = 64                     = 19.13
       210                        210
The expected frequency for each cell is
 recorded in parentheses beside the
 actual observed value. Note that the
 expected frequencies in any row or
 column add up to the appropriate
 marginal total. In our example we may
 compute only the three expected
 frequencies in the top row of the table
 and then find the others by subtraction.
Tabulate the summary of the results

                              Blood Pressure

Jogging status      Low          Moderate      High      total

joggers          34 (26.13)     57 (64)     21 (21.87)   112

non joggers      15 (22.87)     63 (56)     20 (19.13)    98

total                49            120          41       210
The chi-square value is

   Χ2 = Σ (oi - ei)2
             i
                 ei

χ2= (34-26.13)2 + (15-22.87)2 + (57-64)2
      26.13      22.87         64
 + (63-56)2 + (21-21.87)2 + (20-19.13)2
      56         21.87           125.8

     =6.79
Step 5
Make the decision

Since 6.79 > 5.991, reject H0. Hence, the blood
  pressure of a person depends on whether he
  jogs or not.
A researcher wishes to see of the way people obtain information is
   independent of their educational background. A survey of 401
   high school and college graduates yielded the following
   information. At α=0.05, can one conclude that the way people
   obtain information is independent of their educational
   background?
1. H0 & Ha
2. Degrees of freedom and critical value

               Television     Newspapers        Other      Total
                                               sources

 High         159 (139.15)     90 (99.50)       51 (5.)     300
 School
 College         27 (4.)         43 (6.)     31( 20.65)     101

 Total               186          133             82         3.

7-9.compute for χ2
10. Decision
1.  H0: The way people obtain information is
    independent of their educational background.
    Ha: The way people obtain information is
    dependent of their educational background.
2. n=2, a=5.991             10. since χ2 > χa2,
3. 401                      reject H0
4. 46.85
5. 61.35
6. 33.50
7-9. χ2= 46.19
Voting Preferences
          Republican    Democrat    Independent    Row Total
 Male         200          150           50           400
Female        250          300           50           600
Column        450          450           100         1000
 total


Do the men's voting preferences differ significantly from the
  women's preferences? Use a 0.05 level of significance.

Test for independence

  • 1.
    Test for Independence
  • 2.
    Test of Independence Thegoal is to find whether two observed characteristics of a member of a population are independent. Contingency Table -a table for determining whether the distribution according to one variable is contingent on the distribution of the other. -is made up of R rows and C columns. -is designated as R x C table
  • 3.
    Suppose we picka sample size n and classify the data in a two-way table on the basis of the two variables. Column1 Column 2 Column3 Row 1 C11 C12 C13 Row 2 C21 C22 C23
  • 5.
    The degrees offreedom for any contingency table are (no. of rows-1) x (no. of columns-1) or v= (R-1) (C-1) If x2>xa2 with v=(r-1)(c-1) degrees of freedom, reject the null hypothesis of independence at the a level of significance; otherwise, accept the null hypothesis.
  • 6.
    Computation of Expected Frequencies 1. Find the sum of each row and each column, and find the grand total. 2. For each cell, multiply the corresponding row sum by the column sum and divide by the grand total, to get the expected value. 3. Place the expected values in the corresponding cells along with the observed values.
  • 7.
    The general formulafor obtaining the expected frequency of any cell is given by: Expected frequency=(column total)x (row total) grand total
  • 8.
    Example A study isbeing conducted to determine whether there is a relationship between jogging and blood pressure. A random sample of 210 subjects is selected, and they are classified as shown in the table. Use α=0.05. Blood Pressure Jogging status Low Moderate High total joggers 34 57 21 112 non joggers 15 63 20 98 total 49 120 41 210
  • 9.
    Solution Step 1 H0: Theblood pressure of a person does not depend on whether he jogs or not. Ha: The blood pressure of a person depends on whether he jogs or not. Step 2 Determine the critical value. v= (R-1) (C-1) = (2-1) (3-1) = (1) (2) v= 2 Using the table, the critical value is 5.991.
  • 10.
    Step 3 Decision Rule:Reject H0 if χ2 > 5.991
  • 11.
    Step 4 Compute thetest statistic. First, compute for the expected values E11=(112)(49) = 26.13 E22=(98) (120) = 56 210 210 E21=(98)(49) E13=(112) (41) = 22.87 = 21.87 210 210 E12=(112)(120) E23=(98) (41) = 64 = 19.13 210 210
  • 12.
    The expected frequencyfor each cell is recorded in parentheses beside the actual observed value. Note that the expected frequencies in any row or column add up to the appropriate marginal total. In our example we may compute only the three expected frequencies in the top row of the table and then find the others by subtraction.
  • 13.
    Tabulate the summaryof the results Blood Pressure Jogging status Low Moderate High total joggers 34 (26.13) 57 (64) 21 (21.87) 112 non joggers 15 (22.87) 63 (56) 20 (19.13) 98 total 49 120 41 210
  • 14.
    The chi-square valueis Χ2 = Σ (oi - ei)2 i ei χ2= (34-26.13)2 + (15-22.87)2 + (57-64)2 26.13 22.87 64 + (63-56)2 + (21-21.87)2 + (20-19.13)2 56 21.87 125.8 =6.79
  • 15.
    Step 5 Make thedecision Since 6.79 > 5.991, reject H0. Hence, the blood pressure of a person depends on whether he jogs or not.
  • 17.
    A researcher wishesto see of the way people obtain information is independent of their educational background. A survey of 401 high school and college graduates yielded the following information. At α=0.05, can one conclude that the way people obtain information is independent of their educational background? 1. H0 & Ha 2. Degrees of freedom and critical value Television Newspapers Other Total sources High 159 (139.15) 90 (99.50) 51 (5.) 300 School College 27 (4.) 43 (6.) 31( 20.65) 101 Total 186 133 82 3. 7-9.compute for χ2 10. Decision
  • 18.
    1. H0:The way people obtain information is independent of their educational background. Ha: The way people obtain information is dependent of their educational background. 2. n=2, a=5.991 10. since χ2 > χa2, 3. 401 reject H0 4. 46.85 5. 61.35 6. 33.50 7-9. χ2= 46.19
  • 19.
    Voting Preferences Republican Democrat Independent Row Total Male 200 150 50 400 Female 250 300 50 600 Column 450 450 100 1000 total Do the men's voting preferences differ significantly from the women's preferences? Use a 0.05 level of significance.