Downloaded 249 times
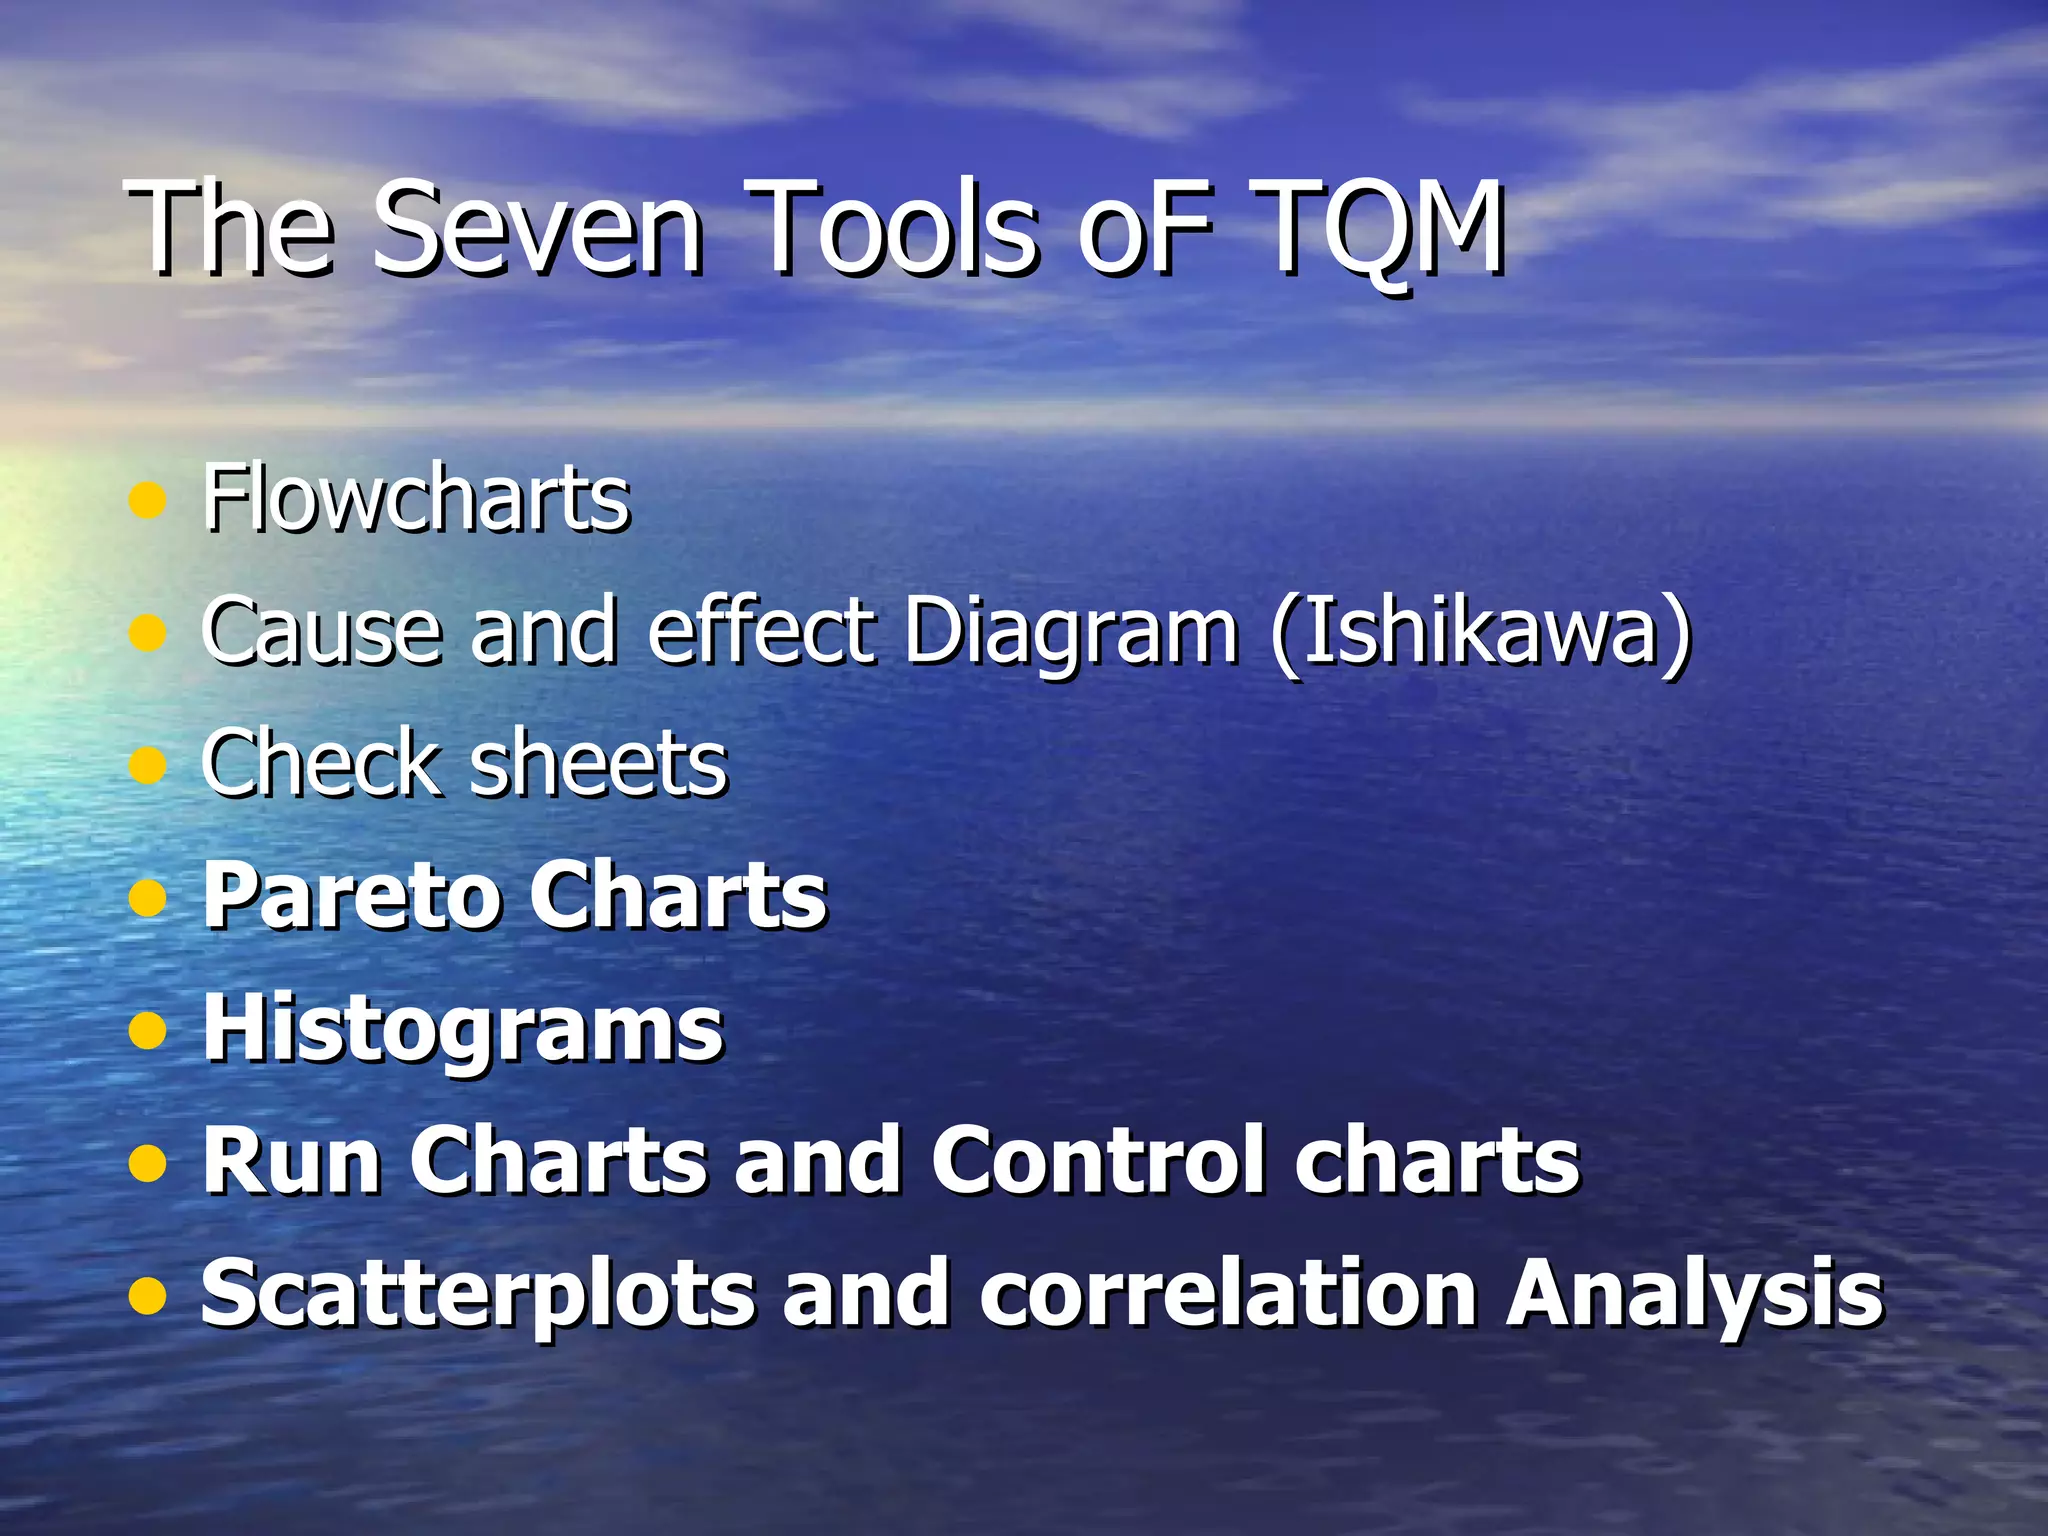
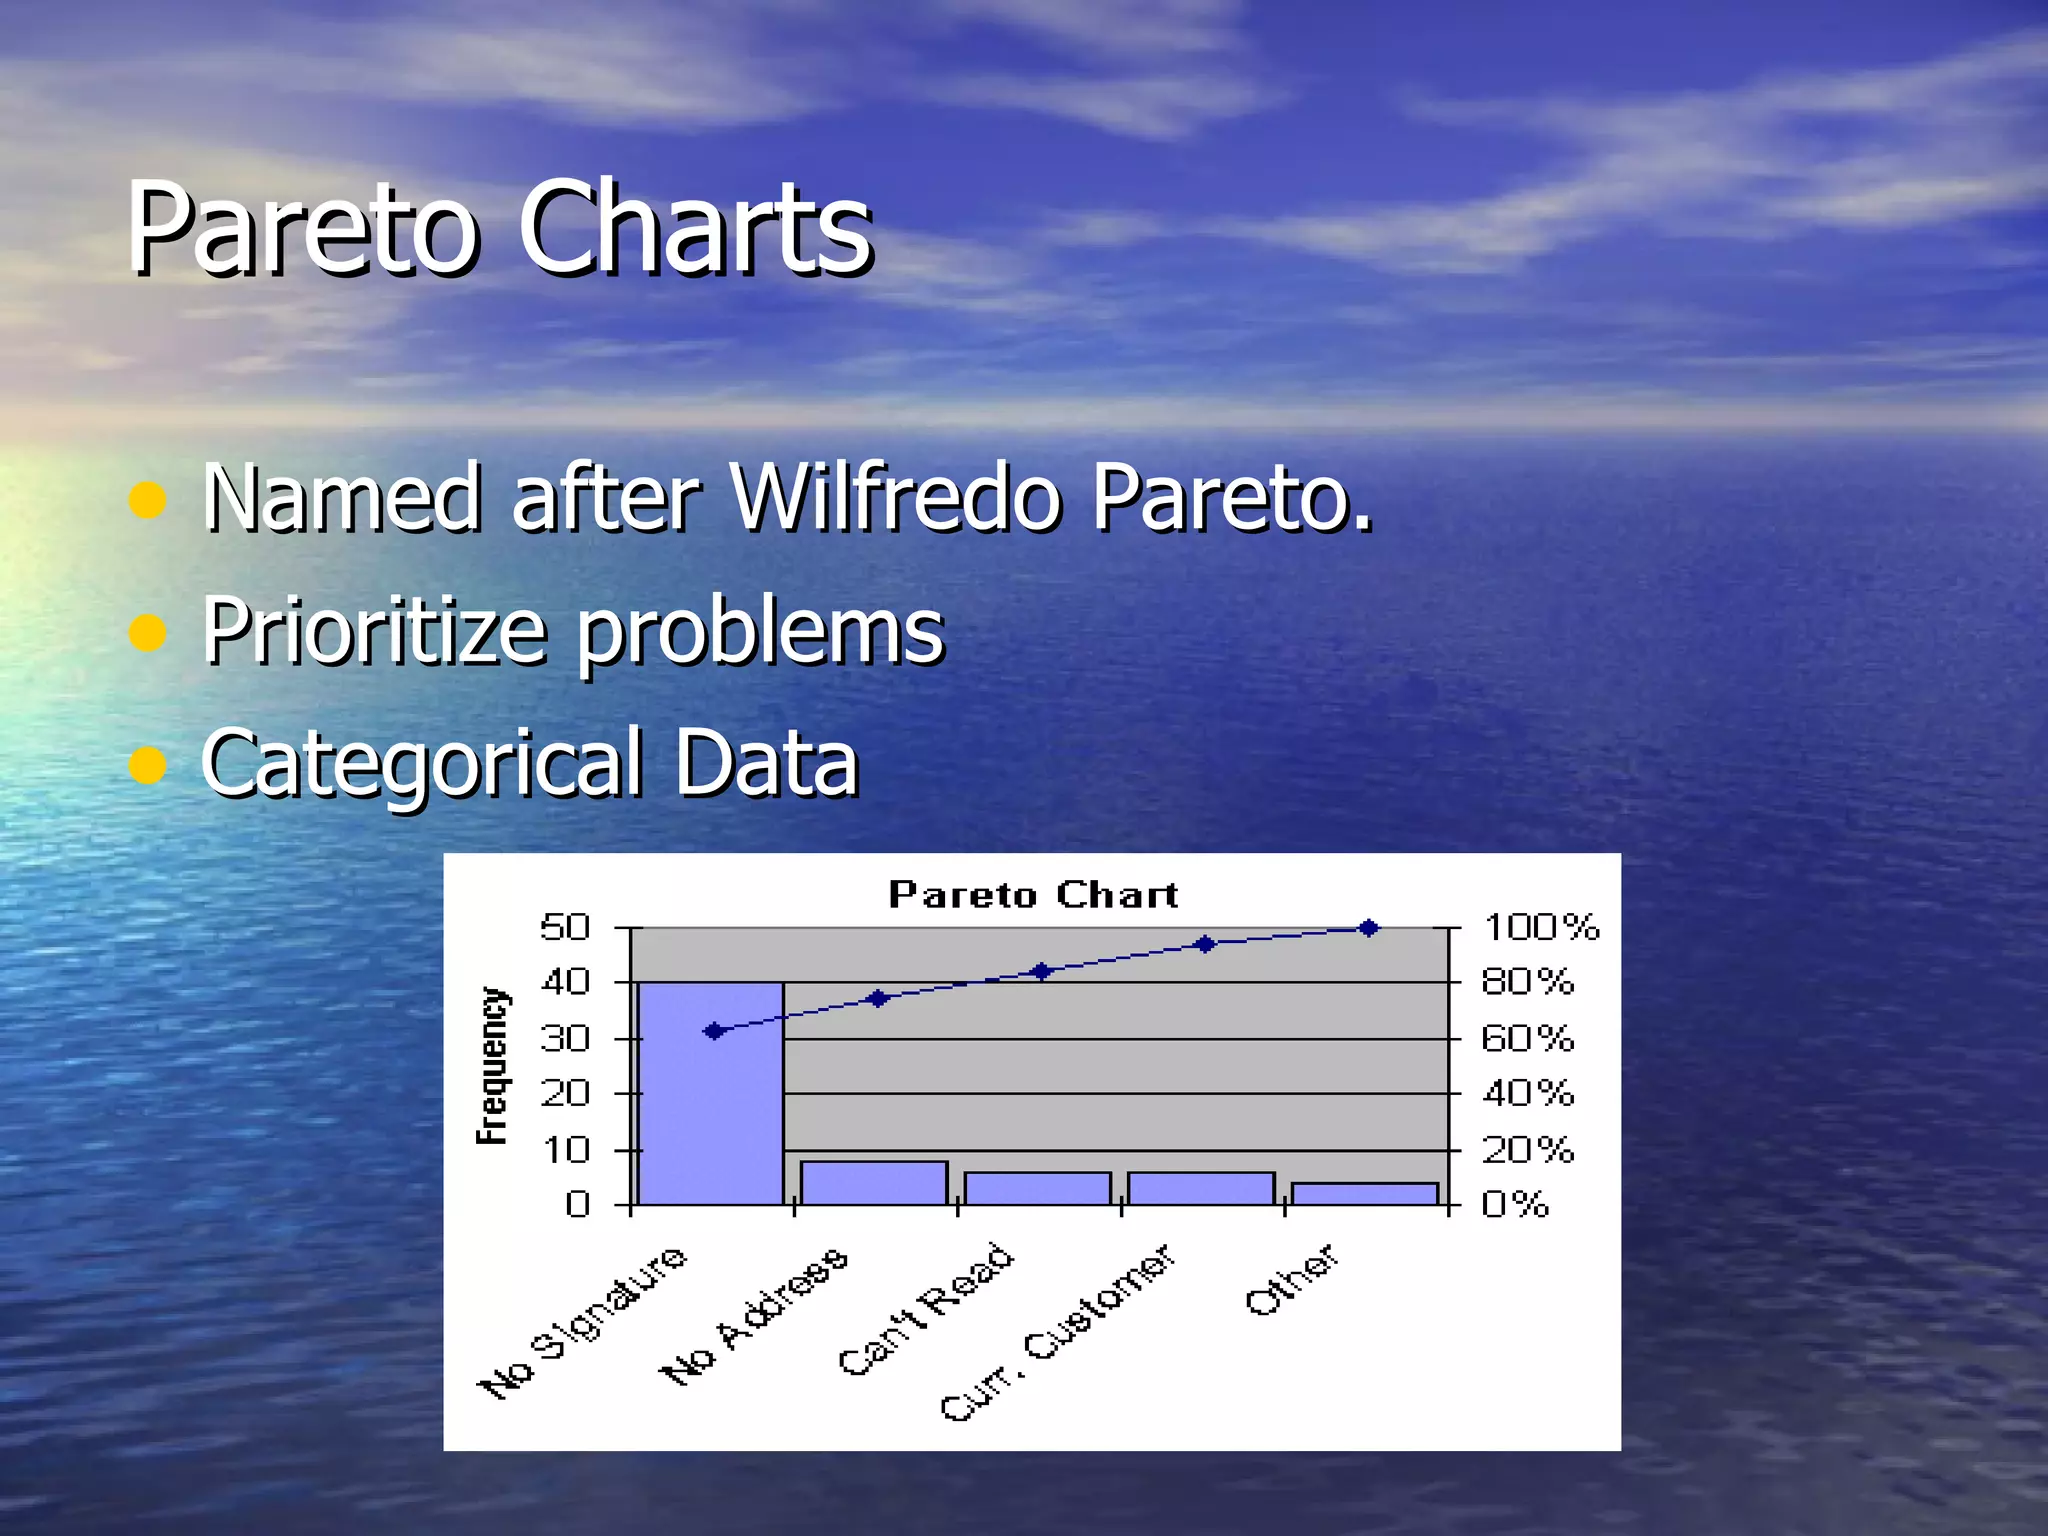
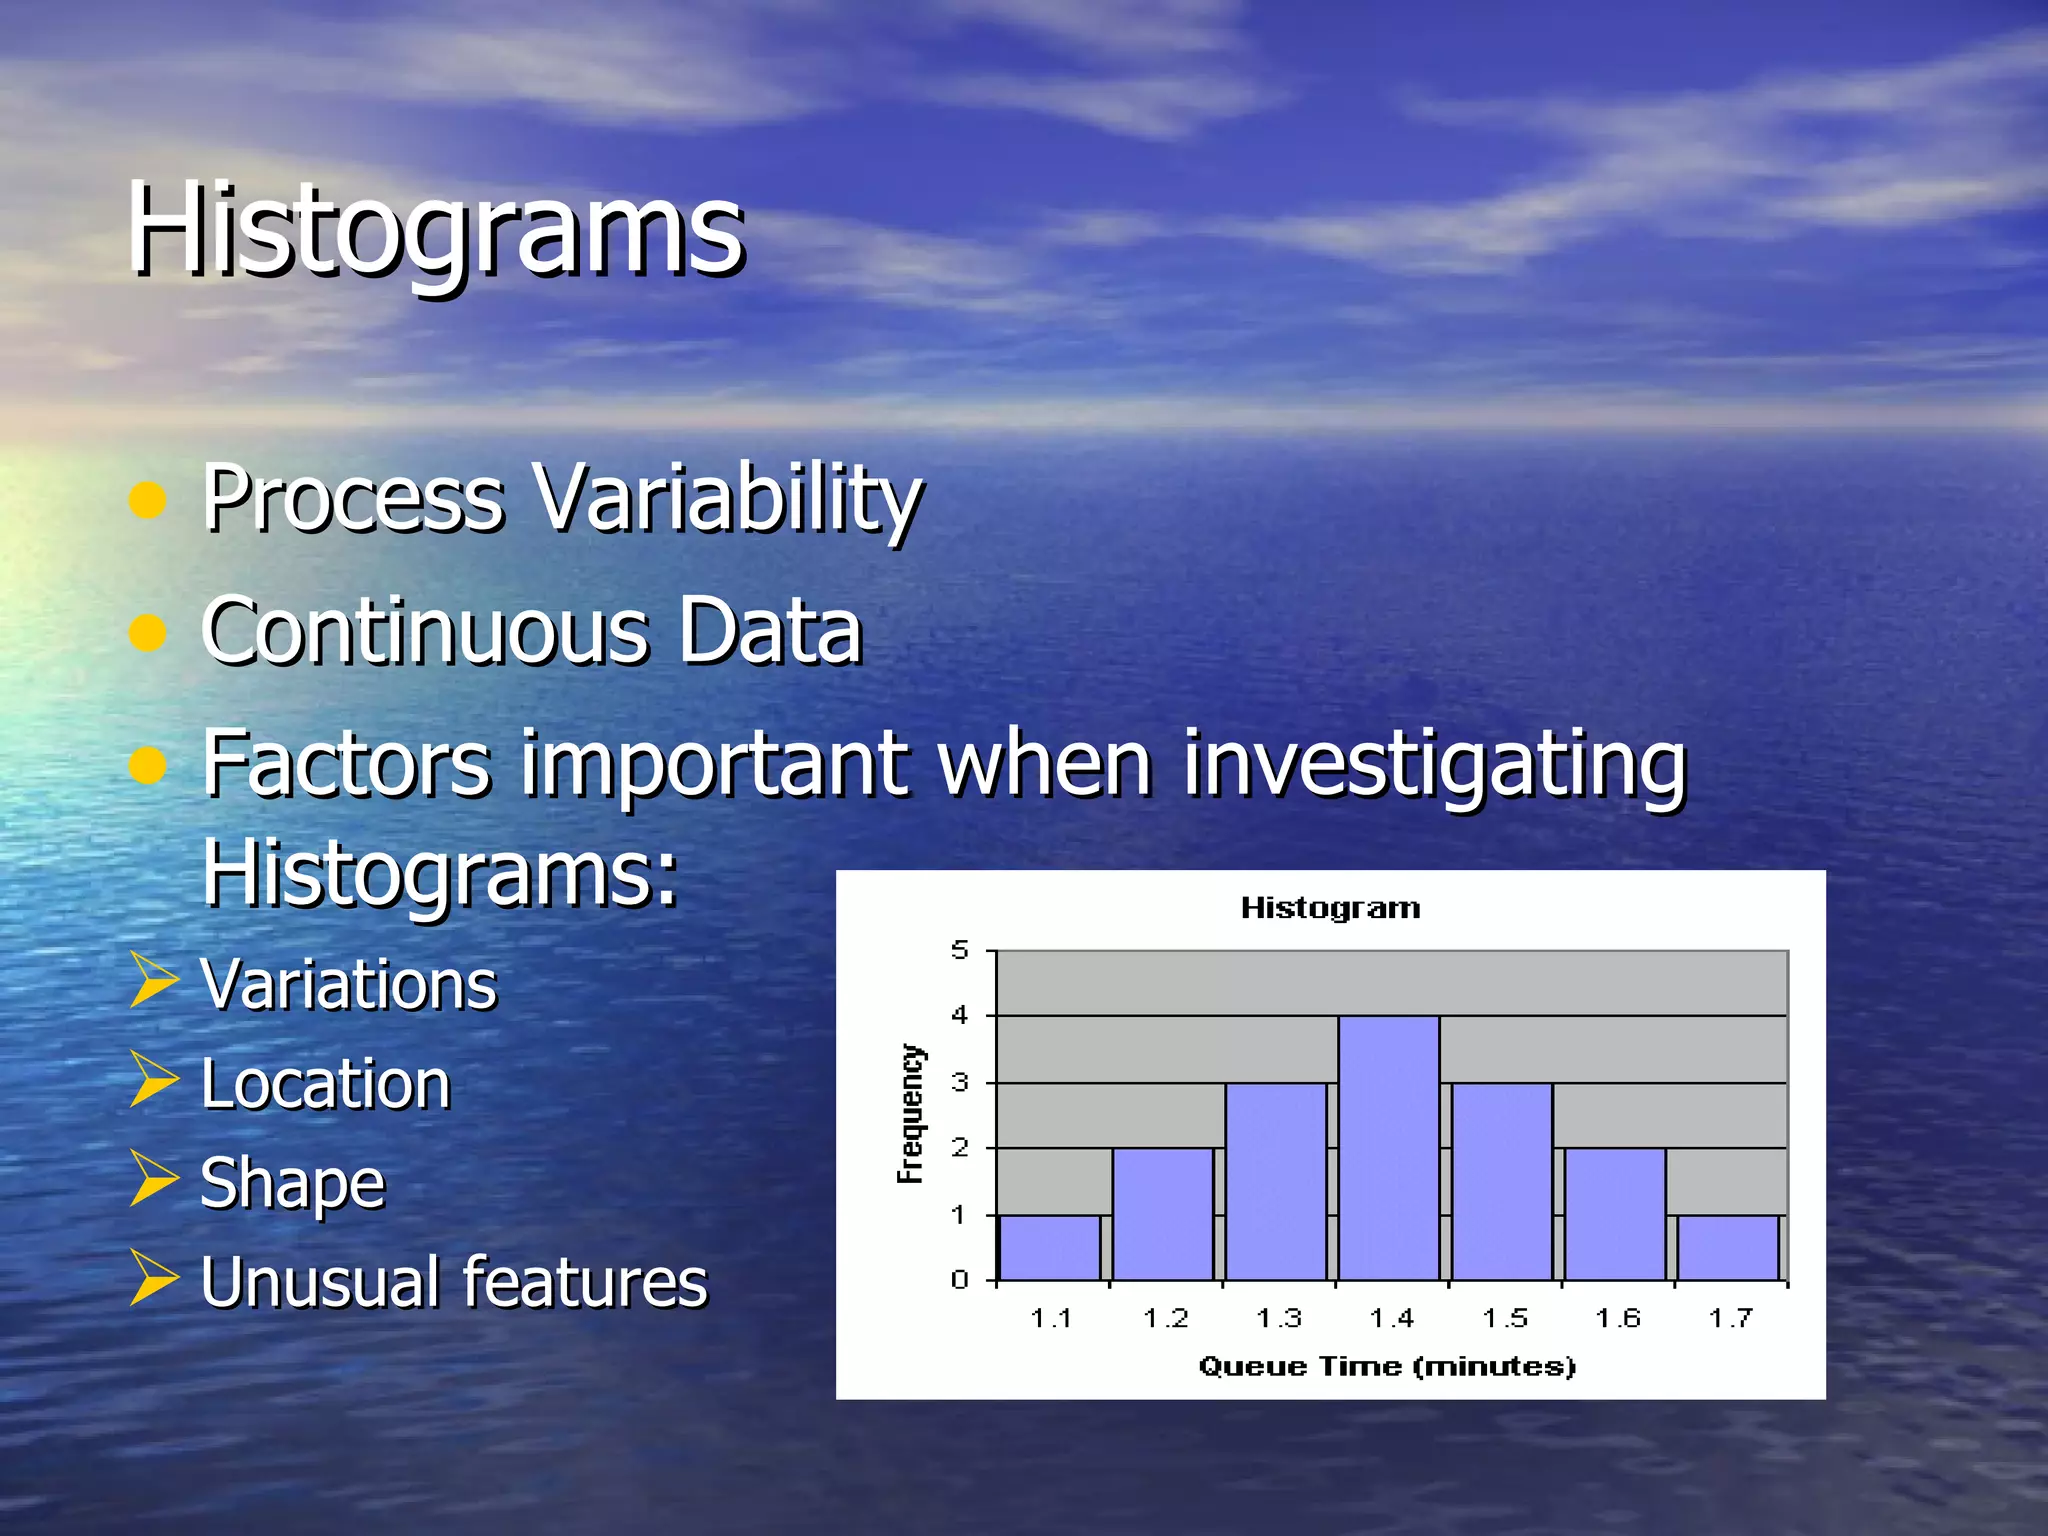
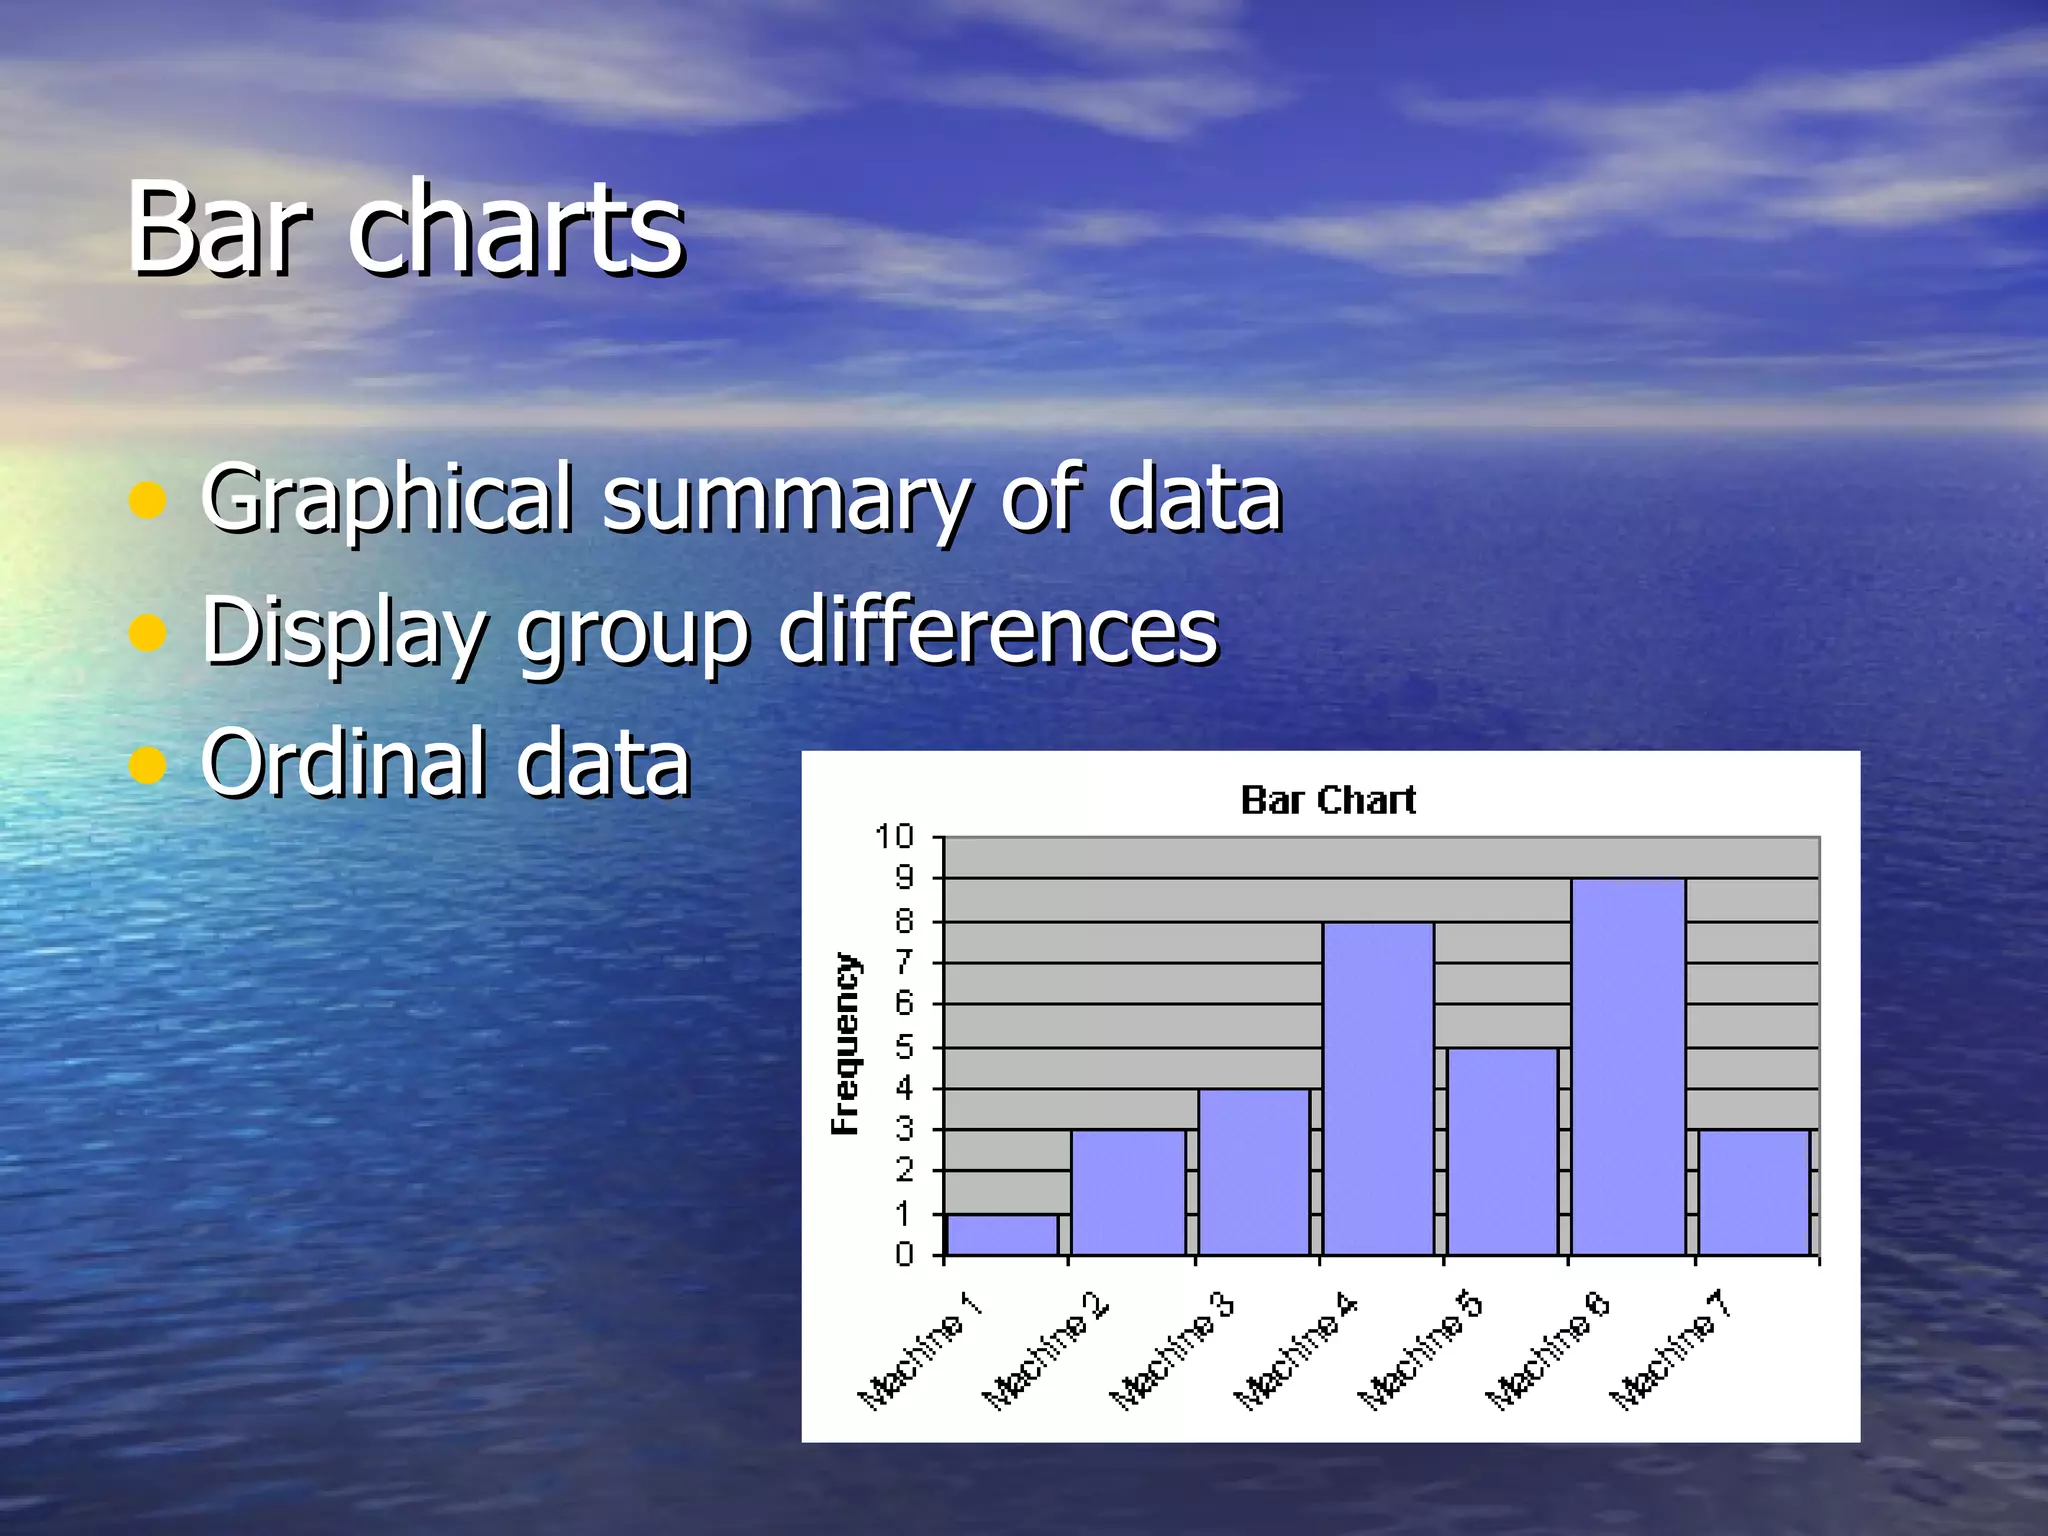
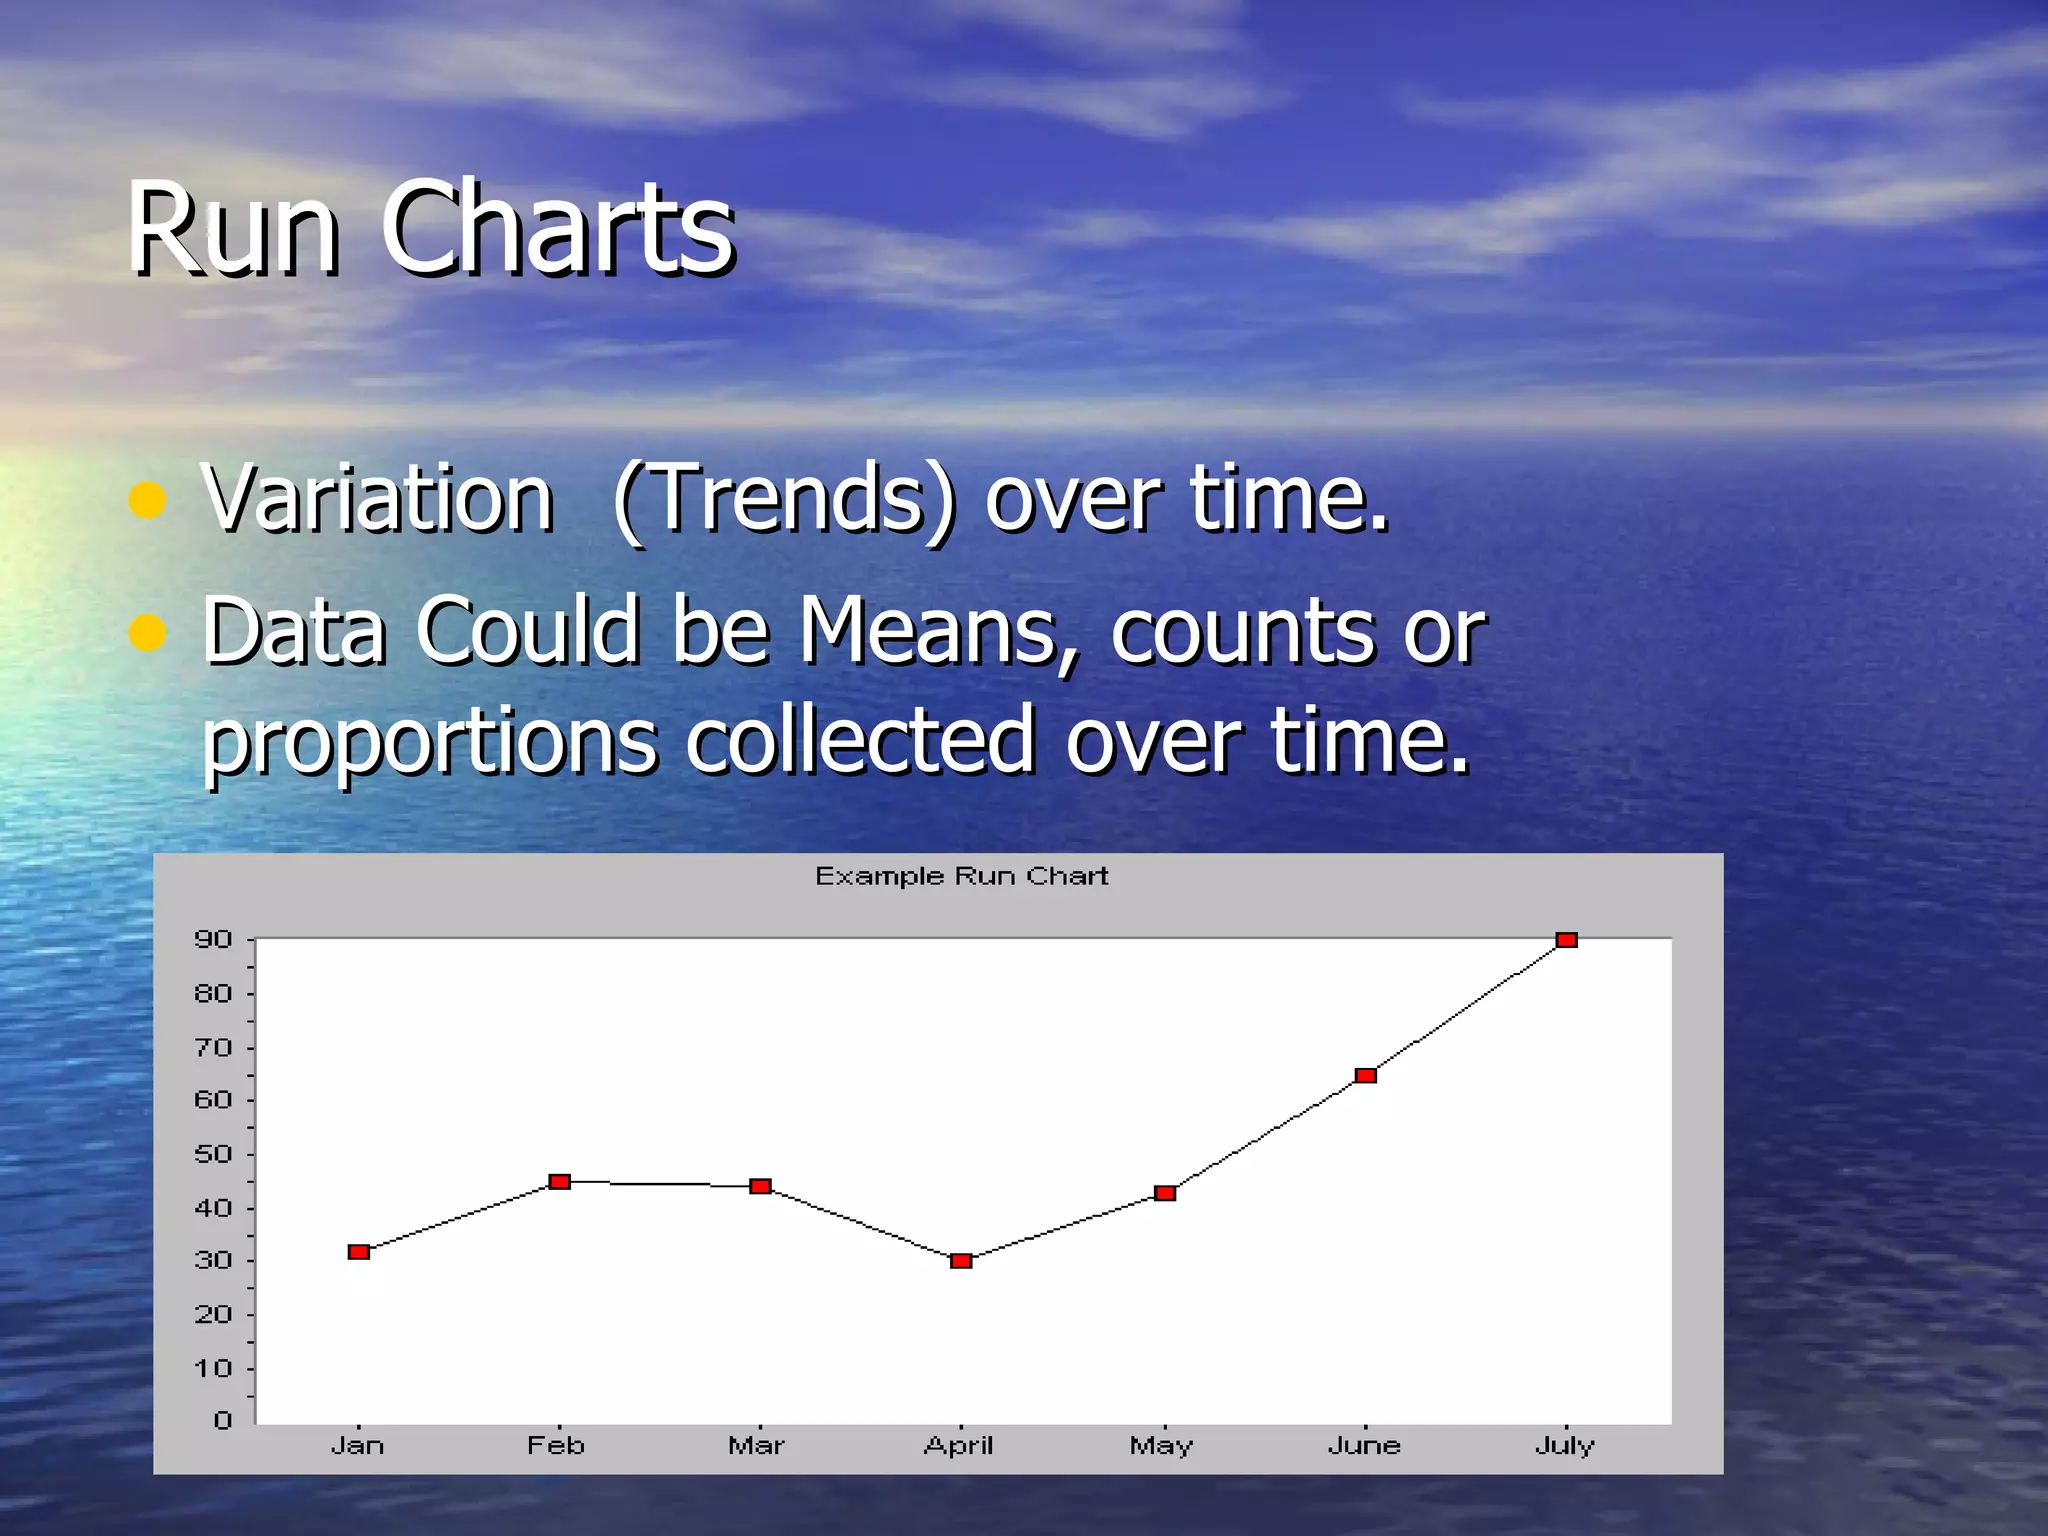
The document discusses several tools used in Total Quality Management (TQM), including flowcharts, cause and effect diagrams, check sheets, Pareto charts, histograms, run charts, control charts, and scatterplots. Pareto charts prioritize problems using categorical data. Histograms display process variability and continuous data, identifying variations, location, shape, and unusual features. Run charts show variation and trends over time using data collected periodically like means, counts or proportions.


![7 qc tools[1] to print](https://cdn.slidesharecdn.com/ss_thumbnails/7qctools1toprint-191017092858-thumbnail.jpg?width=640&height=640&fit=bounds)


