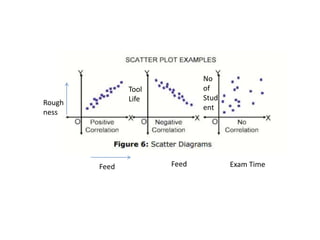
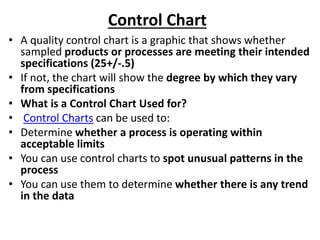
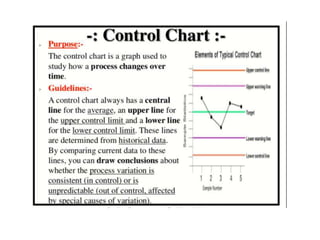
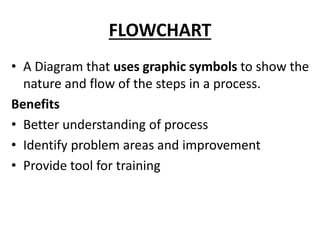
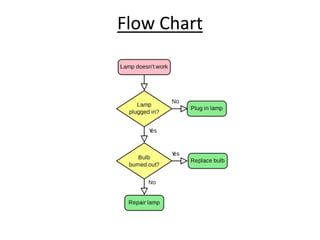
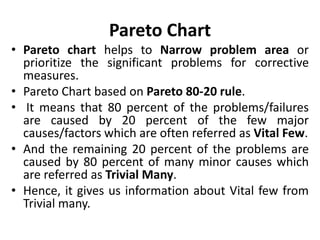
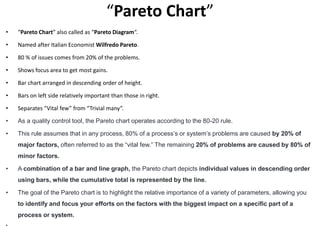
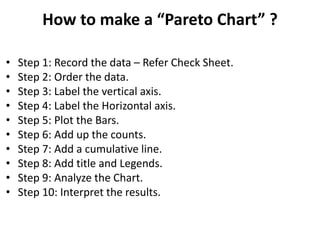
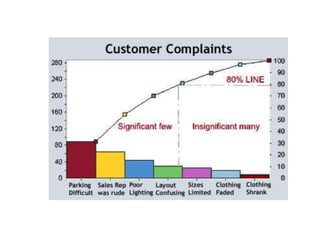
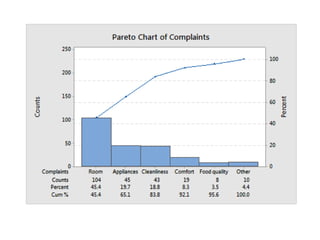
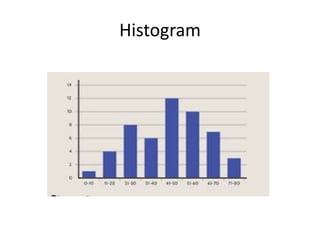
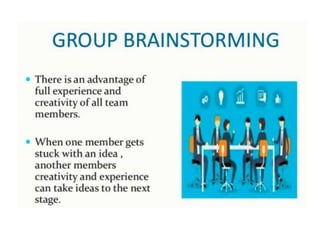
The document discusses the seven quality control tools introduced by Dr. Kaoru Ishikawa for problem solving and process improvement. It describes each of the seven tools - check sheets, flowcharts, histograms, Pareto charts, cause-and-effect diagrams, scatter diagrams, and control charts. For each tool, it provides details on what the tool is, how it is used, and examples of its application. The seven tools are presented as effective methods for collecting, analyzing, and improving quality data in production processes.


![7 qc tools[1] to print](https://cdn.slidesharecdn.com/ss_thumbnails/7qctools1toprint-191017092858-thumbnail.jpg?width=640&height=640&fit=bounds)


