Downloaded 1,592 times

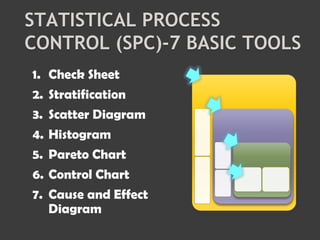
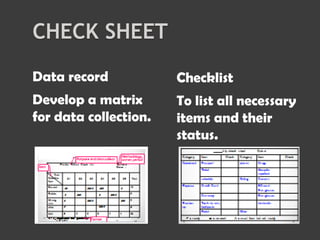
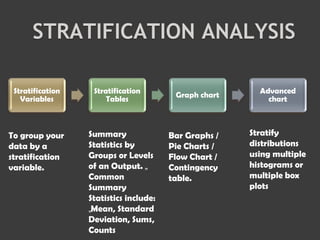
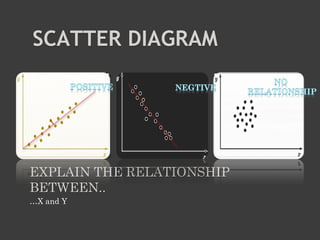
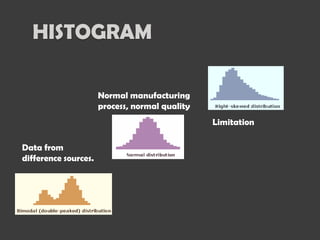
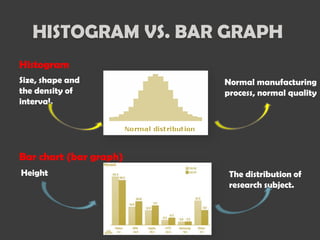
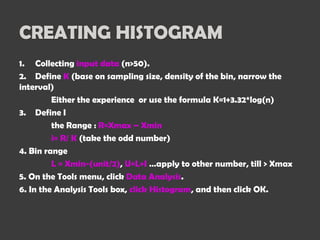
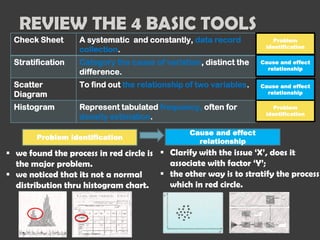
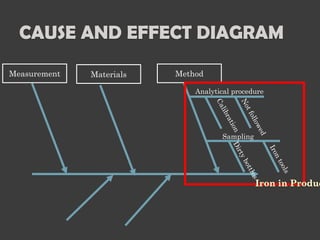
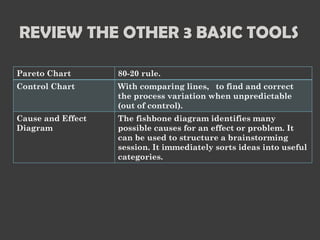

The document describes 7 basic statistical process control tools: check sheet, stratification, scatter diagram, histogram, Pareto chart, control chart, and cause and effect diagram. It provides descriptions and examples of how to use check sheets, stratification analysis, scatter diagrams, histograms, and cause and effect diagrams. The tools can be used to identify problems, understand relationships between variables, categorize causes of variation, and structure brainstorming to identify potential causes of problems or effects. Histograms represent tabulated frequency distributions and can identify if a process is normally distributed. Cause and effect diagrams identify many possible reasons for an observed effect or problem by sorting ideas into useful categories.


![Getting Started with Apache Spark: Big Data Made Simple [Free Meetup]](https://cdn.slidesharecdn.com/ss_thumbnails/apachesparkgettingstarted-260203175547-8361bcc3-thumbnail.jpg?width=640&height=640&fit=bounds)


