Downloaded 44 times


![17
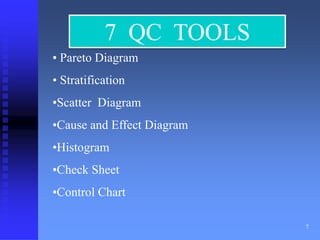
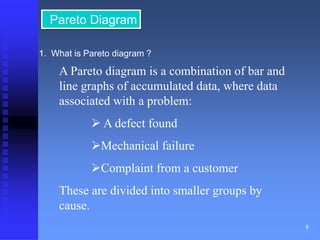
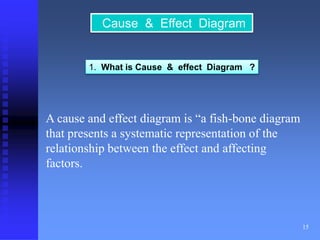
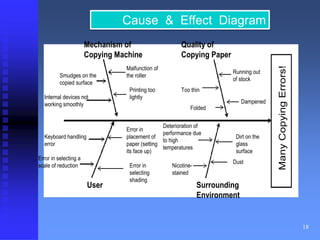
Cause & Effect Diagram
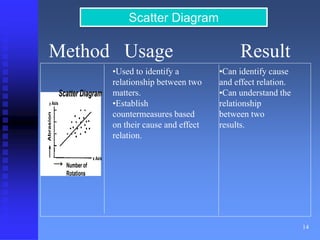
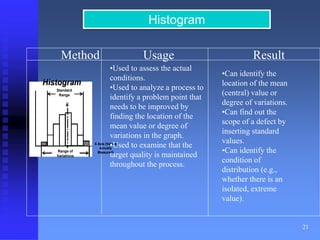
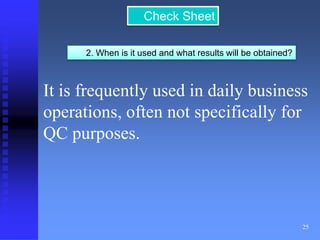
Method Usage Result
Can obtain a clear
overall picture of
causal relation. (A
change in the cause
triggers a variation in
the result.)
Can clarify
the cause and effect
relationship.
Can list up all causes
to identify important
causes.
Can determine the
direction of action
Used when
clarifying a cause
and effect
relationship.[Used
during a phase to
analyze causes.]
Used to develop
countermeasures.
Caaussee aand Effffeecctt
Diiaagrraam
Machine Man
Material Method
Effect
Cause (4M’s) Result
(Controlled State)](https://image.slidesharecdn.com/qualitytools1-140907091501-phpapp01/85/Total-Quality-tools-17-320.jpg)


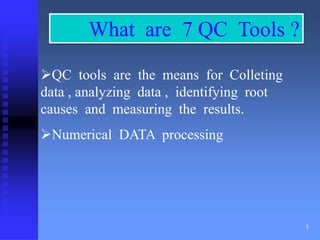
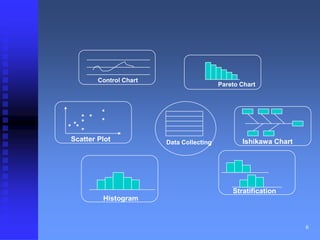
1. The document presents an overview of seven quality control tools: Pareto diagram, stratification, scatter diagram, cause and effect diagram, histogram, check sheet, and control chart. 2. It describes each tool, including how it is used and the results that can be obtained from its use. For example, a Pareto diagram is used to identify problems and their causes, while a control chart examines whether a process is stable or needs adjustment. 3. Implementing these quality control tools is part of establishing a quality program that continuously improves processes through reducing variability, identifying issues, and taking corrective actions.


![7 qc tools training material[1]](https://cdn.slidesharecdn.com/ss_thumbnails/7qctoolstrainingmaterial1-120925054558-phpapp02-thumbnail.jpg?width=640&height=640&fit=bounds)
![7 Quality Control Tools (SQC Model) [MARCH 2009]](https://cdn.slidesharecdn.com/ss_thumbnails/cfakepath7qctools-100630225608-phpapp01-thumbnail.jpg?width=640&height=640&fit=bounds)


