Downloaded 1,024 times


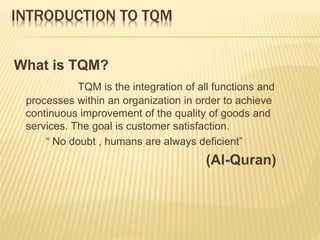
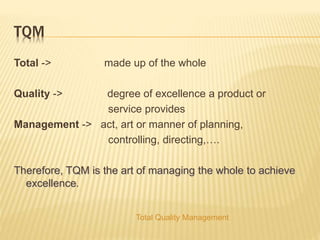
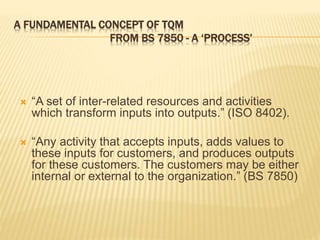
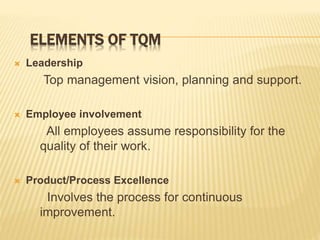
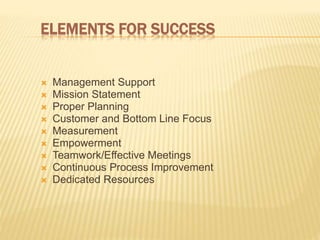
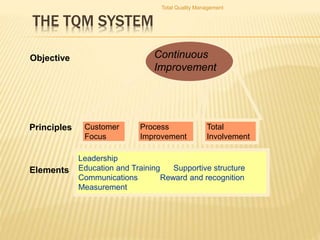
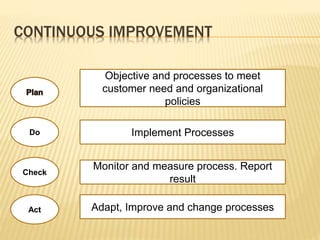
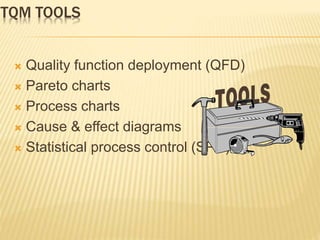
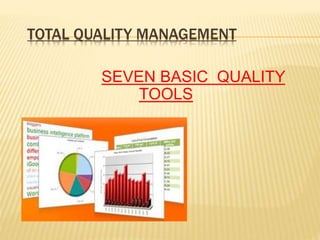
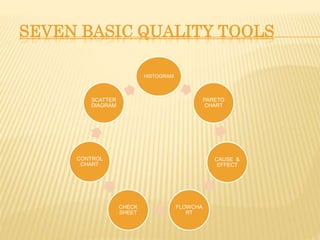
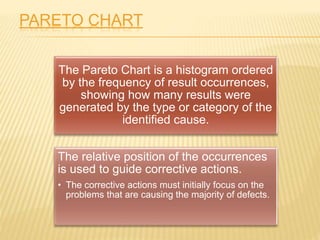
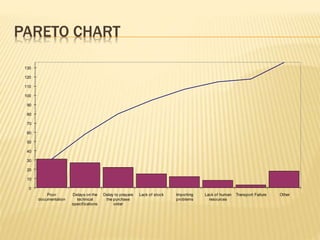
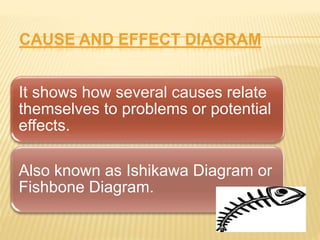
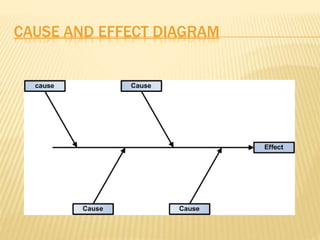
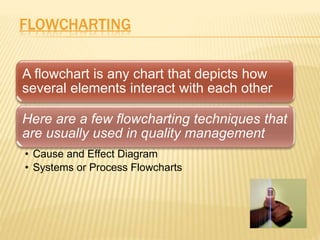
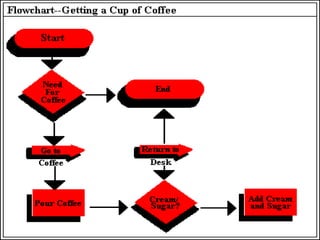
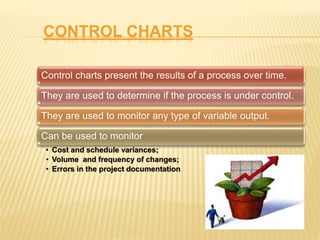
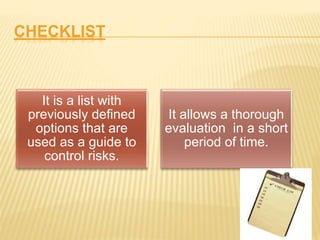
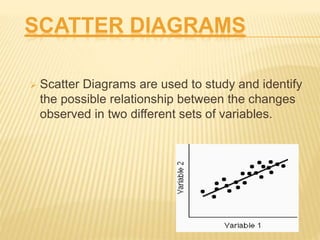
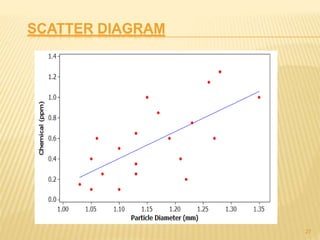


Total Quality Management (TQM) aims to integrate all organizational functions to achieve continuous quality improvement and customer satisfaction. It involves managing all aspects of an organization to achieve excellence. Key elements of TQM include leadership, employee involvement, and continuous process improvement. Some tools used in TQM are histograms, Pareto charts, cause-and-effect diagrams, flowcharts, control charts, checklists, and scatter diagrams. These tools help identify issues, find causes of problems, monitor processes, and drive improvement.


