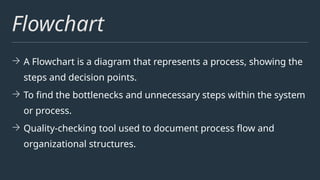
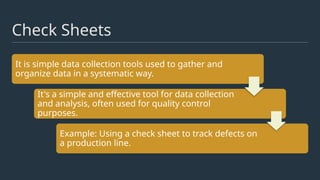
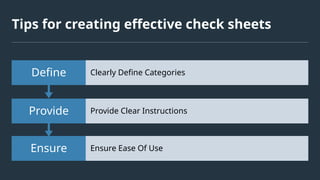
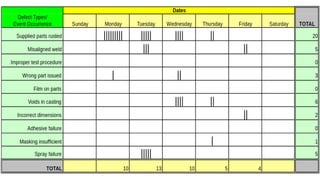
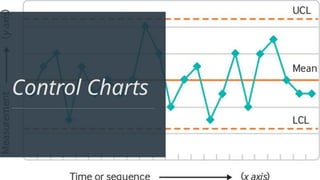
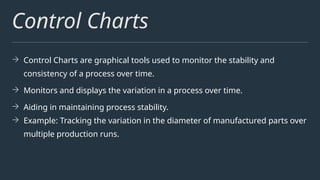
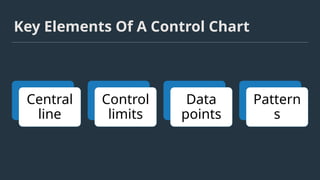
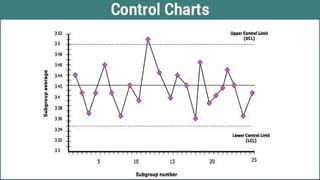
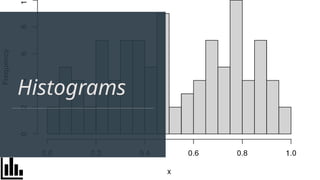
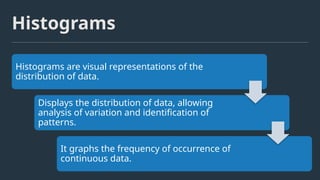
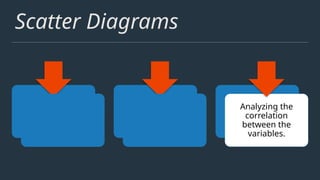
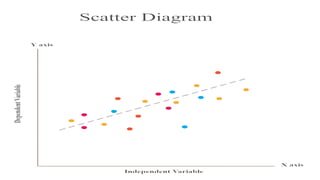
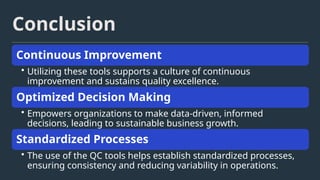
Management Tools
in Quality Control
M.Mohamed Razeen
I MBA ‘A’
Introduction
to Quality
Control
Quality Control
→ Quality Control refers to the processes and techniques used to
ensure that products or services meet specific quality standards.
→ QC is crucial for maintaining consistency, meeting customer
expectations, and improving overall operational efficiency.
What are QC Tools?
The QC tools are basic tools which help in
resolving business issues through:
•Data collection & analysis
•Root cause identification
•Identify solution through data stratification
•Controlling the improved state
“As much as 95% of quality
problems can be solved with
seven fundamental tools.”
- Kaoru Ishikawa
Flow Chart
Flowchart
→ A Flowchart is a diagram that represents a process, showing the
steps and decision points.
→ To find the bottlenecks and unnecessary steps within the system
or process.
→ Quality-checking tool used to document process flow and
organizational structures.
Steps For Creating An Effective Flowchart
Identify the
process
Define the
steps
Incorporate
decision
points.
"If you can’t describe what
you’re doing as a process,
you don’t know
what you’re doing!"
-W.Edwards Deming
Pareto Chart
Pareto Chart
1
Identifying Vital
Issues
The Pareto Chart helps
prioritize the most significant
issues affecting quality,
allowing targeted
improvement efforts.
Pareto Chart
2
Identifying Vital
Issues
The Pareto Chart helps
prioritize the most significant
issues affecting quality,
allowing targeted
improvement efforts.
Visual
Representation
It provides a visual
representation of the most
frequent issues, aiding in
quick and effective problem-
solving.
Pareto Chart
3
Identifying Vital
Issues
The Pareto Chart helps
prioritize the most significant
issues affecting quality,
allowing targeted
improvement efforts.
Visual
Representation
It provides a visual
representation of the most
frequent issues, aiding in
quick and effective problem-
solving.
Data Analysis
Useful for analyzing
the frequency and
impact of defects or
issues within a
process or system.
Pareto Chart
→It is a technique for identifying the most significant
factors contributing to a problem or issue.
→Example: Identifying the most common types of
defects in a manufacturing process.
How to create a Pareto chart
Collect Data
1
Categorize
Issues
2
Calculate
Frequency
3
Create A Bar
Chart
4
Cause-and-
Effect Diagram
Cause-and-Effect Diagram
It is a visual representation used to
identify and explore the potential causes
of a specific problem.
Example: Using a Fishbone
Diagram to analyze the causes of
equipment downtime in a
production line.
Steps to create a Cause-and-Effect Diagram
IDENTIFY THE
PROBLEM
LIST POSSIBLE
CAUSES
ORGANIZE CAUSES
INTO CATEGORIES
CONSTRUCT THE
DIAGRAM
Check Sheets
Check Sheets
It is simple data collection tools used to gather and
organize data in a systematic way.
It's a simple and effective tool for data collection
and analysis, often used for quality control
purposes.
Example: Using a check sheet to track defects on
a production line.
Tips for creating effective check sheets
Ensure Ensure Ease Of Use
Provide Provide Clear Instructions
Define Clearly Define Categories
Control Charts
Control Charts
→ Control Charts are graphical tools used to monitor the stability and
consistency of a process over time.
→ Monitors and displays the variation in a process over time.
→ Aiding in maintaining process stability.
→ Example: Tracking the variation in the diameter of manufactured parts over
multiple production runs.
Key Elements Of A Control Chart
Central
line
Control
limits
Data
points
Pattern
s
Histograms
Histograms
Histograms are visual representations of the
distribution of data.
Displays the distribution of data, allowing
analysis of variation and identification of
patterns.
It graphs the frequency of occurrence of
continuous data.
Scatter Diagram
Scatter Diagrams
Scatter Diagrams
are used to
identify
relationships
between two
variables.
Graph uses dots to
display the values
of two variables.
Analyzing the
correlation
between the
variables.
Conclusion
Continuous Improvement
• Utilizing these tools supports a culture of continuous
improvement and sustains quality excellence.
Optimized Decision Making
• Empowers organizations to make data-driven, informed
decisions, leading to sustainable business growth.
Standardized Processes
• The use of the QC tools helps establish standardized processes,
ensuring consistency and reducing variability in operations.
Management Tools in Quality Control.pptx

Management Tools in Quality Control.pptx

  • 1.
    Management Tools in QualityControl M.Mohamed Razeen I MBA ‘A’
  • 2.
  • 3.
    Quality Control → QualityControl refers to the processes and techniques used to ensure that products or services meet specific quality standards. → QC is crucial for maintaining consistency, meeting customer expectations, and improving overall operational efficiency.
  • 4.
    What are QCTools? The QC tools are basic tools which help in resolving business issues through: •Data collection & analysis •Root cause identification •Identify solution through data stratification •Controlling the improved state
  • 5.
    “As much as95% of quality problems can be solved with seven fundamental tools.” - Kaoru Ishikawa
  • 6.
  • 7.
    Flowchart → A Flowchartis a diagram that represents a process, showing the steps and decision points. → To find the bottlenecks and unnecessary steps within the system or process. → Quality-checking tool used to document process flow and organizational structures.
  • 8.
    Steps For CreatingAn Effective Flowchart Identify the process Define the steps Incorporate decision points.
  • 10.
    "If you can’tdescribe what you’re doing as a process, you don’t know what you’re doing!" -W.Edwards Deming
  • 11.
  • 12.
    Pareto Chart 1 Identifying Vital Issues ThePareto Chart helps prioritize the most significant issues affecting quality, allowing targeted improvement efforts.
  • 13.
    Pareto Chart 2 Identifying Vital Issues ThePareto Chart helps prioritize the most significant issues affecting quality, allowing targeted improvement efforts. Visual Representation It provides a visual representation of the most frequent issues, aiding in quick and effective problem- solving.
  • 14.
    Pareto Chart 3 Identifying Vital Issues ThePareto Chart helps prioritize the most significant issues affecting quality, allowing targeted improvement efforts. Visual Representation It provides a visual representation of the most frequent issues, aiding in quick and effective problem- solving. Data Analysis Useful for analyzing the frequency and impact of defects or issues within a process or system.
  • 15.
    Pareto Chart →It isa technique for identifying the most significant factors contributing to a problem or issue. →Example: Identifying the most common types of defects in a manufacturing process.
  • 16.
    How to createa Pareto chart Collect Data 1 Categorize Issues 2 Calculate Frequency 3 Create A Bar Chart 4
  • 18.
  • 19.
    Cause-and-Effect Diagram It isa visual representation used to identify and explore the potential causes of a specific problem. Example: Using a Fishbone Diagram to analyze the causes of equipment downtime in a production line.
  • 20.
    Steps to createa Cause-and-Effect Diagram IDENTIFY THE PROBLEM LIST POSSIBLE CAUSES ORGANIZE CAUSES INTO CATEGORIES CONSTRUCT THE DIAGRAM
  • 22.
  • 23.
    Check Sheets It issimple data collection tools used to gather and organize data in a systematic way. It's a simple and effective tool for data collection and analysis, often used for quality control purposes. Example: Using a check sheet to track defects on a production line.
  • 24.
    Tips for creatingeffective check sheets Ensure Ensure Ease Of Use Provide Provide Clear Instructions Define Clearly Define Categories
  • 26.
  • 27.
    Control Charts → ControlCharts are graphical tools used to monitor the stability and consistency of a process over time. → Monitors and displays the variation in a process over time. → Aiding in maintaining process stability. → Example: Tracking the variation in the diameter of manufactured parts over multiple production runs.
  • 28.
    Key Elements OfA Control Chart Central line Control limits Data points Pattern s
  • 30.
  • 31.
    Histograms Histograms are visualrepresentations of the distribution of data. Displays the distribution of data, allowing analysis of variation and identification of patterns. It graphs the frequency of occurrence of continuous data.
  • 33.
  • 34.
    Scatter Diagrams Scatter Diagrams areused to identify relationships between two variables. Graph uses dots to display the values of two variables. Analyzing the correlation between the variables.
  • 36.
    Conclusion Continuous Improvement • Utilizingthese tools supports a culture of continuous improvement and sustains quality excellence. Optimized Decision Making • Empowers organizations to make data-driven, informed decisions, leading to sustainable business growth. Standardized Processes • The use of the QC tools helps establish standardized processes, ensuring consistency and reducing variability in operations.