Check out this guide for flowchart symbols meaning explained. If you need to know which flowchart symbols to use, all standard shapes and their definitions are explained on this page.
Watch this with a 10-15 minute audiotrack at http://vimeo.com/novusprogram/powerpoint1
This lesson provides information on the basics of PowerPoint, Microsoft’s powerful presentation development tool. The topics covered include a basic review of the program’s toolbars and options, and an introduction to slide creation. The objective of the lesson is for the user to be comfortable with operations like opening and creating PowerPoint documents, saving PowerPoint documents, navigating the options and toolbar, adding new slides, formatting text, formatting textboxes, using different program views, and starting a presentation. The lesson teaches concepts through a combination of image-based slides and video tutorials.
The Novus project is a combination of video tutorials designed to be used in conjunction with a free business simulation software program. The Novus Business and IT Program contains 36 business and IT training videos, covering basic finance, accounting, marketing, economics, business strategy, Word, Excel, and PowerPoint. Users will have an opportunity to apply the lessons in the Novus Business Simulator. Over six rounds, the user or teams will have to make decisions on capital purchases, financing, production, financing, and human resources for a microbrewery. This channel has arranged the 36 video lessons into the order in which they are meant to be used with the simulator. To watch this slideshow as a video, please go to our Vimeo page at: https://vimeo.com/novusprogram. To download our free business simulation software, please go to our SourceForge page at: http://sourceforge.net/projects/novus/.
discuss about System system analysis, system design, system analyst's role, Development of System through analysis, SDLC, Case Tools of SAD, Implementation, etc.
To download the editable version of this document, go to www.slidebooks.com
Editable Powerpoint Infographics & icons that you can download at www.slidebooks.com. Very good time saver.
Business & Marketing PowerPoint Template - Business PowerPoint TemplateTheTemplateWizard
Welcome to TheTemplateWizard’s professional business and marketing PowerPoint template section. In this section you can expect to find a nice collection of business PowerPoint templates, marketing PowerPoint templates and sales PowerPoint templates, with attractive designs and backgrounds. These templates are apt for both your internal as well as external communications. All our business and marketing PPT templates are completely editable and help you create PowerPoint presentation material for business and marketing strategy, brand marketing, sales strategy, client services, lead generation, competitor analysis, and other concepts without any problem.
56 Unique Slides
4000+ Vector Icon Include
16:9 & 4:3 HD Widescreen
PPTX & PPT
Fully Animated
Build With Slide Master
No Need Photoshop File
Image Placeholder Ready
Professional & clean design
Handcrafted Infographic in Powerpoint
Easily Editable Ready to use awesome icons
Easy to drop your screen image into Mockup
All Shape Are Vector
Contact: rubelmistry95@gmail.com
Check out our professionally designed billiard table PPT template. Download our billiard table PowerPoint presentation affordably and quickly now. Get started for your next PowerPoint presentation with our billiard table editable ppt template. This royalty free billiard table Powerpoint template lets you to edit text and values and is being used very aptly for billiard table, leisure, recreational, snooker, sports and such PowerPoint presentations.
A look at the sales funnel and what marketing channels are appropriate at what stage.
Check out Trada Reviews here: http://www.trada.com/trada-reviews/
a diagram of the sequence of movements or actions of people or things involved in a complex system or activity.
a graphical representation of a computer program in relation to its sequence of functions (as distinct from the data it processes).
Think You Don't Need to Diagram Your Business Processes? Think Again.Everteam
It’s not a simple task to diagram a business process, but the benefits far outweigh the potential challenges involved. The key is to put together the right group of people who understand the process best and can explain it clearly. When documenting a business process, don’t have it led by a technical analyst. You don’t want to design your processes around technology; you want the technology to work with your process.
How Process Mapping Can Streamline Your Business Tips and Best PracticesKashish Trivedi
So you have business processes that you can’t visualize. They’re inefficient and you don’t know what you can do to improve them. You’ve heard rumors of this great thing called process mapping and you’re intrigued. This is not the new tech taking over the world like AI. This is an ancient practice. An art lost to the toils of time and the Great Computer Age™.Process mapping can be done with a good ol’ pen and paper and can transform your business processes so much that you’ll start noticing the benefits immediately. But how? I’m so glad you asked. Let’s jump right in.
ImportantSummary discussion of chapter not article or sectio.docxbradburgess22840
Important
Summary discussion of chapter not article or section
Due date today 6/30/15 in 8 hours or earlier
No plagiarism in own words
Will run through a plagiarism checker
Will not accept if after due date
Please cite and reference
References and citation page must include a valid URL to take the reader to the electronic copy of each source.
If cannot complete with the given instructions do not reply
Please contact me if you have questions
Write as a discussion of this part of the chapter with another student
Please post I found the material interesting, or what do you think
I may ask to change some areas at later date
Please title first followed by discussion
100 to 200 word count each, can be longer if needed
Please write clearly simplify
I am in the U.S.
No charts or graphs
Needs to be like a discussion in class or post
Make the minimum 10 post for discussion
The Tools of Quality
When we introduce a particular method of doing a job, it is natural to consider whether the method is appropriate or not. The decision is usually based on past results and experience, or perhaps on conventional methods. Procedures will be most effective if a proper evaluation is made, and on-the-job data are essential for making a proper evaluation.
KAORU ISHIKAWA, Quality Tools Inventor 1
1Ishikawa, K., “Guide to Quality Control,” Asia Productivity Organization, Tokyo, Japan, 1985.
Quality improvement in manufacturing or services, to be effective, should address the needs of the system as a whole. In this book we have attempted to address quality management from an integrative perspective. This perspective has encompassed the many functional areas of business, including supply chain management, marketing, accounting, human resources, operations, engineering, and strategy. None of these fields of endeavor operate in a vacuum. They are all interrelated and interdependent.
Improving the System
To be successful, a business or organization must balance the needs of these different functional areas around a coherent business vision and strategy. The objective of the system is to satisfy the customer. Customer satisfaction means higher customer retention, which leads to improved profitability.
A quality system (Figure 10-1) uses the business model with a focus on the customer and includes the dynamics of continual improvement, change, planning, and renewal. Continual improvement is necessary for a company to learn to grow. Companies that are unable to adapt find themselves with stagnant cultures and labor forces. Many managers, on discovering that their organization has reached this point, believe they must resort to draconian measures such as layoffs and organizational reengineering to achieve change. If they had pursued continual improvement and learning in the first place, they might not have reached this juncture.
Figure 10-1 Quality System Model
This quality system is not just a series of variables and relationships. It is an interconnect.
Inspiring quotes from Audrey Hepburn, Shakespeare and Gorge Bernard Shaw. Learn English from enlightening quotes. For more quotes graphics, please visit
https://www.edrawsoft.com/inspiring-quote-images.php
https://www.edrawsoft.com/famous-quote-graphics.php
https://www.edrawsoft.com/graphics-about-love.php
Ultimate guide about fishbone diagram: definition, benefits, history of fishbone diagram, useful tips to create fishbone diagram and simple methods for cause and effect analysis.
featured ppt template about China, illustrating China's economy. politics, education and culture briefly through organized diagrams.
For more unique presentation templates featured by ifopraphics, go to
https://www.edrawsoft.com/free-presentation-templates.php
2024.06.01 Introducing a competency framework for languag learning materials ...Sandy Millin
http://sandymillin.wordpress.com/iateflwebinar2024
Published classroom materials form the basis of syllabuses, drive teacher professional development, and have a potentially huge influence on learners, teachers and education systems. All teachers also create their own materials, whether a few sentences on a blackboard, a highly-structured fully-realised online course, or anything in between. Despite this, the knowledge and skills needed to create effective language learning materials are rarely part of teacher training, and are mostly learnt by trial and error.
Knowledge and skills frameworks, generally called competency frameworks, for ELT teachers, trainers and managers have existed for a few years now. However, until I created one for my MA dissertation, there wasn’t one drawing together what we need to know and do to be able to effectively produce language learning materials.
This webinar will introduce you to my framework, highlighting the key competencies I identified from my research. It will also show how anybody involved in language teaching (any language, not just English!), teacher training, managing schools or developing language learning materials can benefit from using the framework.
Honest Reviews of Tim Han LMA Course Program.pptxtimhan337
Personal development courses are widely available today, with each one promising life-changing outcomes. Tim Han’s Life Mastery Achievers (LMA) Course has drawn a lot of interest. In addition to offering my frank assessment of Success Insider’s LMA Course, this piece examines the course’s effects via a variety of Tim Han LMA course reviews and Success Insider comments.
Francesca Gottschalk - How can education support child empowerment.pptxEduSkills OECD
Francesca Gottschalk from the OECD’s Centre for Educational Research and Innovation presents at the Ask an Expert Webinar: How can education support child empowerment?
Model Attribute Check Company Auto PropertyCeline George
In Odoo, the multi-company feature allows you to manage multiple companies within a single Odoo database instance. Each company can have its own configurations while still sharing common resources such as products, customers, and suppliers.
Biological screening of herbal drugs: Introduction and Need for
Phyto-Pharmacological Screening, New Strategies for evaluating
Natural Products, In vitro evaluation techniques for Antioxidants, Antimicrobial and Anticancer drugs. In vivo evaluation techniques
for Anti-inflammatory, Antiulcer, Anticancer, Wound healing, Antidiabetic, Hepatoprotective, Cardio protective, Diuretics and
Antifertility, Toxicity studies as per OECD guidelines
Palestine last event orientationfvgnh .pptxRaedMohamed3
An EFL lesson about the current events in Palestine. It is intended to be for intermediate students who wish to increase their listening skills through a short lesson in power point.
The French Revolution, which began in 1789, was a period of radical social and political upheaval in France. It marked the decline of absolute monarchies, the rise of secular and democratic republics, and the eventual rise of Napoleon Bonaparte. This revolutionary period is crucial in understanding the transition from feudalism to modernity in Europe.
For more information, visit-www.vavaclasses.com
Read| The latest issue of The Challenger is here! We are thrilled to announce that our school paper has qualified for the NATIONAL SCHOOLS PRESS CONFERENCE (NSPC) 2024. Thank you for your unwavering support and trust. Dive into the stories that made us stand out!
"Protectable subject matters, Protection in biotechnology, Protection of othe...
Flow Chart Guide PPT
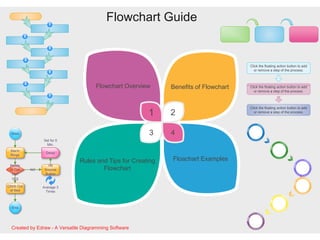
1. Flowchart Guide
Rules and Tips for Creating
Flowchart
Floachart Examples
Flowchart Overview Benefits of Flowchart
3 4
1 2
Start
Alarm
Rings
Ready
to Get
Up?
Climb Out
of Bed
End
Delay
Hit
Snooze
Button
YES
NO
Average 3
Times
Set for 5
Min.
1
2
3
4
5
6
7
Click the floating action button to add
or remove a step of the process.
Click the floating action button to add
or remove a step of the process.
Click the floating action button to add
or remove a step of the process.
Created by Edraw - A Versatile Diagramming Software
2. Definition of Flowchart
Flow is a representation of a series of
logic operations to satisfy specific
requirements. A flow exists naturally. It
can be irregular, unfixed or full of
problems.
Chart, or diagram, is a presentation or
a written description of some regular
and common parts of the flow. A chart
is conducive to communication and
concentration and offers references
for process reengineering.
Flowchart is a means to visually present the flow of data
through an information processing systems, the operations
performed within the system and the sequence in which they
are performed.
Created by Edraw
3. Basic Flowchart
Process Flowchart
Data Flow Diagram
Cross Functional Flowchart
Business Process
Modeling Diagram
Procedure Flowchart
IDEF Flowchart
Major Types of Flowchart
Program Flowchart
Workflow Diagram
IDEF2
Created by Edraw
4. Flowchart Benefits
1.Visual Clarity
Visualize multiple progresses
and their sequence into a
single document.
3. Effective Coordination
Sequence events and reduce
the potential for overburdening
team members. Eliminating
unnecessary steps help to save
time and resources.
2.Instant Communication
Clarifying progresses offers an
easy, visual method to help team
members instantly understand
what they should do.
4. Efficiency Increase
Flowchart help a designer
remove unnecessary steps in a
process, as well as errors.
6. Problem Solving
Flowcharts break a problem up
into easily definable parts. The
defined process displayed
demonstrates the method of
solving a complex problem.
5. Effective Analysis
With the help of flowchart,
problem can be analyzed in more
effective way.
7. Proper Documentation
Digital flowcharts serve as a
good paperless documentation,
which is needed for various
purposes, making things more
efficient.
Created by Edraw
5. The lines with arrows indicate
the work flow and connect each
process. The reader follows the
arrows from the start, usually
starting from the top down or
from left to right.
Apply a rectangle with
the upper edge
sloping upwards to
indicate a manual
input.
A rectangle stand for
an action or operation
that must be taken to
move to the next step
in the process. The
process itself and the
variables involved are
written inside the
shape.
Use a diamond to stand for
decision. Write the specific
conditions near the arrows
leading from the conditional
diamond, which will often be a
simple "TRUE" and "FALSE."
Rules for Flowchart Design
Created by Edraw
6. Identify the right people to develop the chart.
Determine what you expect to get from the flowchart.
Identify who will use it and how.
Define the level of detail you need.
Establish the boundaries of the process to be
improved.
How to Make a Flowchart
Created by Edraw
7. Get started quickly from a ready-made flowchart template.
1
Take advantage of flowcharting software to simplify and accelerate the process.
2
Make sure all of your objects are properly aligned distributed and labeled.
3
Link websites or other resources to enrich the flowchart.
4
Save your flowcharts as JPEGs to avoid
5
Tips to Make Better Flowchart
Created by Edraw
8. How to Interpret Flowcharts
Determine who is involved in the process;1
Form theories about root causes;2
Identify ways to streamline the process;3
Determine how to implement changes to the
process;
4
Locate cost-added-only steps;5
Provide training on how the process works or
should work.
6
Created by Edraw
10. CustomerSales
Technical
support
TesterDevelopment
No
No
Customer request
help or report errors
Sales issue
Resolve the issue and
respond customer
Yes
No
Confirm with
customer
New issue
Test the issue
Fix the issue
Yes
Resolve solution
No
Finished
Technical analysis
Reproduced the
issue
Error report
Yes
Resolved?
Get more details from
customer
Resolve solution
Yes
More feedback
Confirm with
customer
Finished
Software Service Cross-Functional Process
Created by Edraw
11. Cloud
Online Document Storage
Upload electronic files
to Cloud
PC
Business Documents
Scan/Index/Upload
Mobile Workers
Remote Employees
Staff On Site
Spreadsheets PowerPoint
Slides
Word
Documents
Authorized Third Parties
Upload Photos
Created by Edraw
12. Set goals
Negotiate
Sign agreement
Put forward
strategies
Design online shops
Sales goal
Brand goal
Market
support
Business
research
Service
content
Product
strategies
Price
strategies
Channel
strategies
Front Page
Product
Product training
Process
standardization
Operation
Product
Knowledge
Orientation
Photos
Documents
Design
Product description
After sales introduction
Core
selling
point
After
sales
problems
Customer
service
process
Conversion
process
After
sales
process
Goods
delivery
process
New
products
upload
Online
customer
service
Monthly
report
Marketing
plans
Pass assessment and renew contract
Data
analysis
E-commerce Trusteeship Service Flowchart
Created by Edraw