Downloaded 118 times


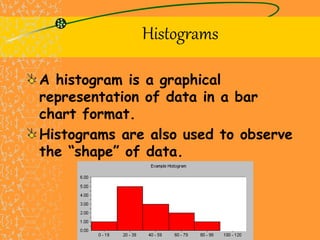
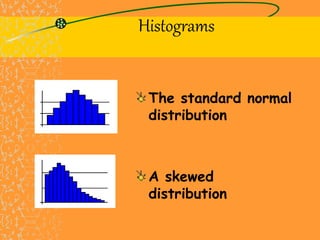


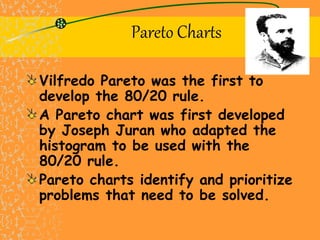


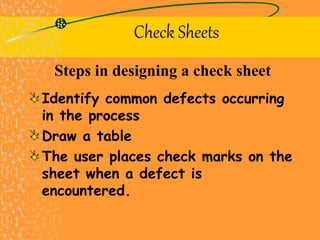


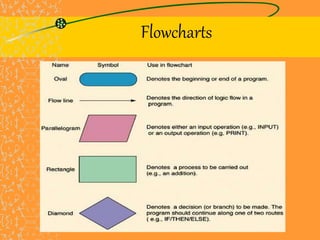


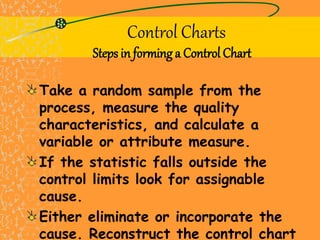


Kaoru Ishikawa developed the basic seven tools of quality - histograms, Pareto charts, cause-and-effect diagrams, check sheets, scatter diagrams, flowcharts, and control charts - to help average people analyze and interpret data for quality improvement. These visual tools have been widely adopted by companies worldwide to continuously improve processes. The presentation provided an overview of each tool and examples of how they can be applied in organizations.


![7 qc tools training material[1]](https://cdn.slidesharecdn.com/ss_thumbnails/7qctoolstrainingmaterial1-120925054558-phpapp02-thumbnail.jpg?width=640&height=640&fit=bounds)


![Rodebaugh sixsigma[1]](https://cdn.slidesharecdn.com/ss_thumbnails/rodebaugh-sixsigma1-191102025225-thumbnail.jpg?width=640&height=640&fit=bounds)


