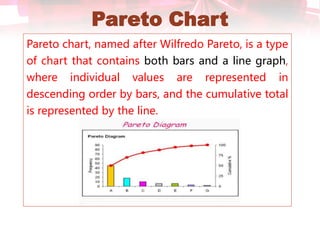
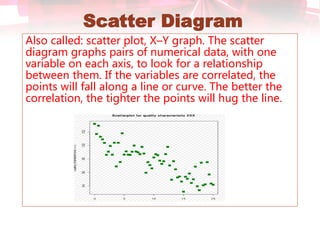
QUALITY
CONTROL
RAZIA HAMEED
2015-AG-194
QUALITY CONTROL
“Quality control is the regulatory process
through which we measure actual quality
performance, compare it with standards,
and act on the difference”
What is QC Tools?
 To make rational decisions using data
obtained on the product, or process, or
from the consumer, organizations use
certain graphical tools.
 Graphical methods are easy to understand
and provide comprehensive information;
they are a viable tool for the analysis of
product and process data.
7 Basic Tools
• Pareto Chart
• Check sheet
• Cause & Effect Diagram
• Control Chart
• Histogram
• Scatter Diagram
• Stratification or Flow chart
Pareto Chart
Pareto chart, named after Wilfredo Pareto, is a type
of chart that contains both bars and a line graph,
where individual values are represented in
descending order by bars, and the cumulative total
is represented by the line.
Check sheet
The check sheet is a form (document) used to collect data in
real time at the location where the data is generated. The
data it captures can be quantitative or qualitative. When the
information is quantitative, the check sheet is sometimes
called a tally sheet.
Cause & Effect Diagram
Common uses of the diagram are product design and
quality defect prevention to identify potential factors
causing an overall effect. Each cause or reason for
imperfection is a source of variation. Causes are
usually grouped into major categories to identify
these sources of variation.
Control Charts
The control chart is a graph used to study how a
process changes over time. Data are plotted in time
order. A control chart always has a central line for
the average, an upper line for the upper control limit
and a lower line for the lower control limit.
Histogram
A histogram is a graphical representation of the
distribution of numerical data. It is an estimate of
the probability distribution of a continuous variable
(quantitative variable) and was first introduced by
Karl Pearson
Scatter Diagram
Also called: scatter plot, X–Y graph. The scatter
diagram graphs pairs of numerical data, with one
variable on each axis, to look for a relationship
between them. If the variables are correlated, the
points will fall along a line or curve. The better the
correlation, the tighter the points will hug the line.
Flow Chart
A flowchart is a formalized graphic representation
of a logic sequence, work or manufacturing
process, organization chart, or similar formalized
structure. Flowcharts use simple geometric
symbols and arrows to define relationships.
Causes of Variation in Quality
CHANCE CAUSES
1. Machine vibrations
2. Voltage variations
3. Composition variation of material, etc.
ASSIGNABLE CAUSES
1. Lack of skill in operation
2. Wrong maintenance practice
3. New vendors
4. Error in setting jigs and fixtures
5. Raw material defects
Quality control and its Tools

Quality control and its Tools

  • 2.
  • 3.
    QUALITY CONTROL “Quality controlis the regulatory process through which we measure actual quality performance, compare it with standards, and act on the difference”
  • 4.
    What is QCTools?  To make rational decisions using data obtained on the product, or process, or from the consumer, organizations use certain graphical tools.  Graphical methods are easy to understand and provide comprehensive information; they are a viable tool for the analysis of product and process data.
  • 5.
    7 Basic Tools •Pareto Chart • Check sheet • Cause & Effect Diagram • Control Chart • Histogram • Scatter Diagram • Stratification or Flow chart
  • 6.
    Pareto Chart Pareto chart,named after Wilfredo Pareto, is a type of chart that contains both bars and a line graph, where individual values are represented in descending order by bars, and the cumulative total is represented by the line.
  • 7.
    Check sheet The checksheet is a form (document) used to collect data in real time at the location where the data is generated. The data it captures can be quantitative or qualitative. When the information is quantitative, the check sheet is sometimes called a tally sheet.
  • 8.
    Cause & EffectDiagram Common uses of the diagram are product design and quality defect prevention to identify potential factors causing an overall effect. Each cause or reason for imperfection is a source of variation. Causes are usually grouped into major categories to identify these sources of variation.
  • 9.
    Control Charts The controlchart is a graph used to study how a process changes over time. Data are plotted in time order. A control chart always has a central line for the average, an upper line for the upper control limit and a lower line for the lower control limit.
  • 10.
    Histogram A histogram isa graphical representation of the distribution of numerical data. It is an estimate of the probability distribution of a continuous variable (quantitative variable) and was first introduced by Karl Pearson
  • 11.
    Scatter Diagram Also called:scatter plot, X–Y graph. The scatter diagram graphs pairs of numerical data, with one variable on each axis, to look for a relationship between them. If the variables are correlated, the points will fall along a line or curve. The better the correlation, the tighter the points will hug the line.
  • 12.
    Flow Chart A flowchartis a formalized graphic representation of a logic sequence, work or manufacturing process, organization chart, or similar formalized structure. Flowcharts use simple geometric symbols and arrows to define relationships.
  • 13.
    Causes of Variationin Quality CHANCE CAUSES 1. Machine vibrations 2. Voltage variations 3. Composition variation of material, etc. ASSIGNABLE CAUSES 1. Lack of skill in operation 2. Wrong maintenance practice 3. New vendors 4. Error in setting jigs and fixtures 5. Raw material defects