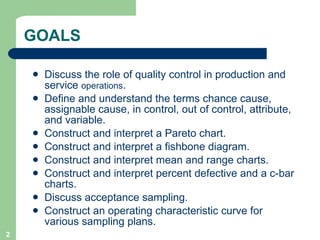
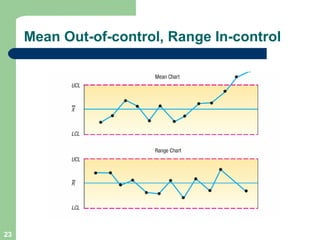
This document discusses statistical process control and quality management techniques. It defines key terms like chance causes, assignable causes, control charts, attributes and variables. It also describes different types of control charts like Pareto charts, fishbone diagrams, mean charts, range charts, p-charts and c-charts. The document provides examples of how to construct and interpret these different control charts. It also discusses acceptance sampling and how to construct an operating characteristic curve.


![Oc Curves[1]](https://cdn.slidesharecdn.com/ss_thumbnails/occurves1-1226090108328626-9-thumbnail.jpg?width=640&height=640&fit=bounds)


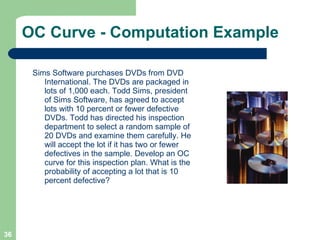
![7 qc tools training material[1]](https://cdn.slidesharecdn.com/ss_thumbnails/7qctoolstrainingmaterial1-120925054558-phpapp02-thumbnail.jpg?width=640&height=640&fit=bounds)