This document provides an overview of key concepts in statistics including:
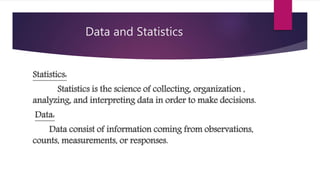
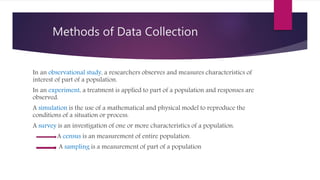
1. Statistics involves collecting, organizing, analyzing, and interpreting data to make decisions. Data comes from observations, counts, or measurements.
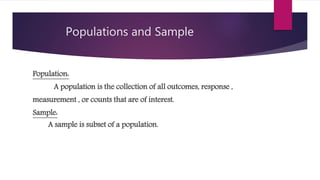
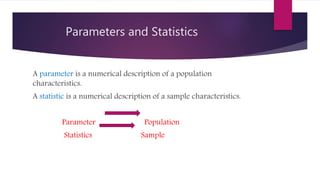
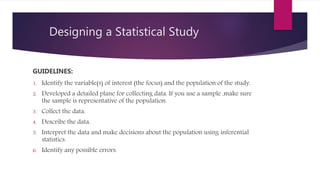
2. A population is the entire group being studied, while a sample is a subset of the population. Parameters describe populations, while statistics describe samples.
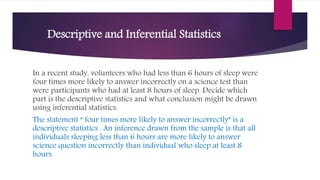
3. Descriptive statistics involve summarizing and displaying data, while inferential statistics use samples to draw conclusions about populations.
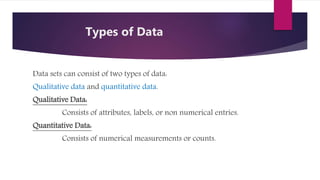
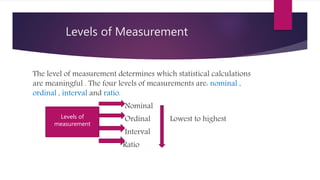
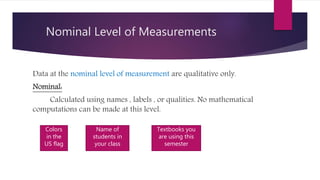
4. Data can be qualitative (attributes) or quantitative (numbers). It can also be measured at the nominal, ordinal, interval, or ratio level.