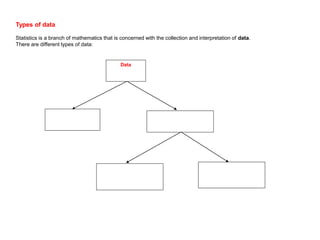
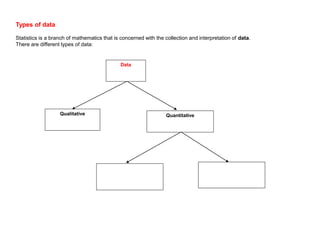
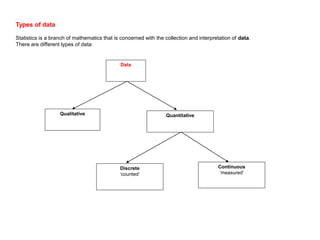
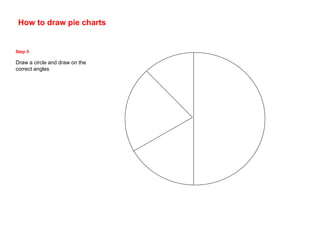
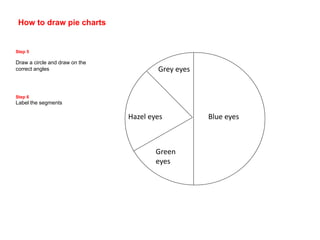
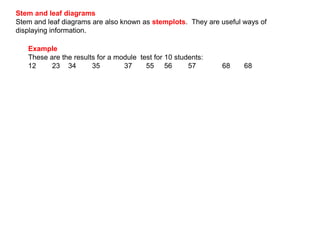
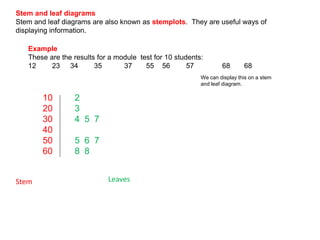
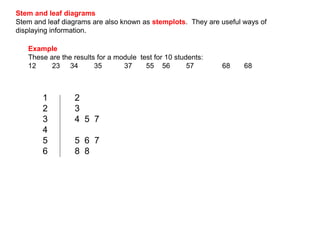
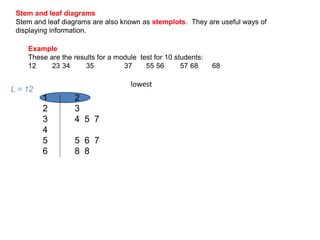
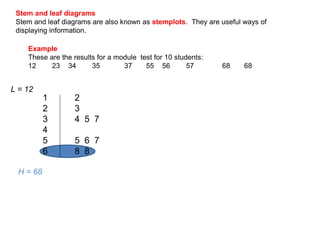
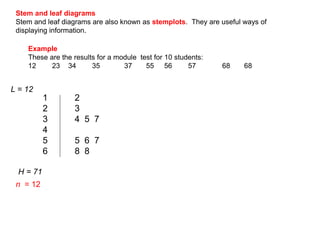
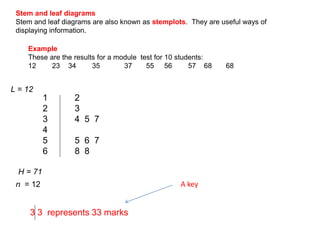
This document discusses different ways to display quantitative and qualitative data, including stem and leaf diagrams, bar charts, pie charts, and pictograms. It provides instructions on how to create stem and leaf diagrams and pie charts. Quantitative data can be discrete (counted) or continuous (measured) and qualitative data describes characteristics. Examples are given of quantitative and qualitative data.