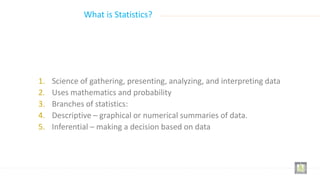
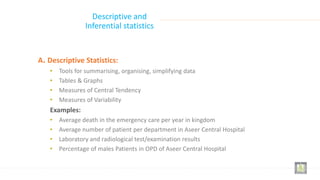
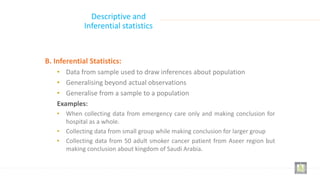
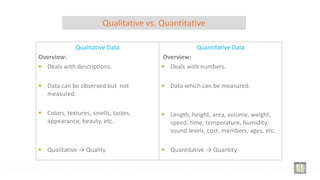
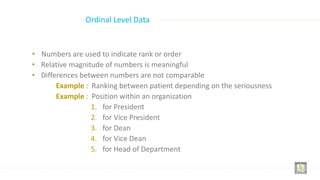
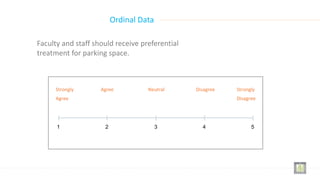
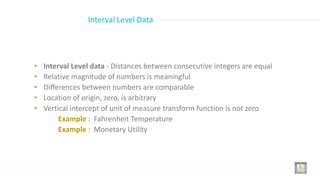
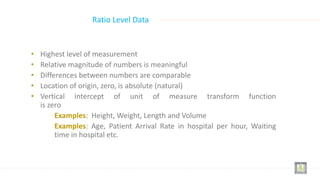
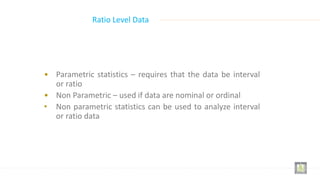
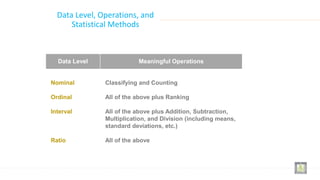
5. What is Statistics?
1. Science of gathering, presenting, analyzing, and interpreting data
2. Uses mathematics and probability
3. Branches of statistics:
4. Descriptive – graphical or numerical summaries of data.
5. Inferential – making a decision based on data
6. What is
BIO-Statistics?
Biostatistics is the branch of statistics responsible for the proper
interpretation of scientific data generated in the biology, public
health and other health sciences (i.e., the biomedical sciences).
Biostatistics involves the theory and application of statistical
science to analyze public health problems and to further biomedical
research.
7. Role of
BIO-Statistician?
1. Biostatisticians play essential roles in designing studies and analyzing
data from research problems. They help formulate the scientific
questions to be answered, determine the appropriate sampling
techniques, coordinate data collection procedures, and carry out
statistical analyses to answer those scientific questions.
8. Role of
BIO-Statistician?
2. Research problems are as diverse as the study of factors affecting heart
and lung disease, testing new drugs to combat AIDS, assessing indoor air
quality in schools, working with various cancer studies, evaluating dental
health and dental procedures, evaluating psychiatric symptoms and drug
and alcohol use, transplanting organs and bone marrow, and studying
inner ear infection.
10. A. Descriptive Statistics:
• Tools for summarising, organising, simplifying data
• Tables & Graphs
• Measures of Central Tendency
• Measures of Variability
Examples:
• Average death in the emergency care per year in kingdom
• Average number of patient per department in Aseer Central Hospital
• Laboratory and radiological test/examination results
• Percentage of males Patients in OPD of Aseer Central Hospital
Descriptive and
Inferential statistics
11. Descriptive and
Inferential statistics
B. Inferential Statistics:
• Data from sample used to draw inferences about population
• Generalising beyond actual observations
• Generalise from a sample to a population
Examples:
• When collecting data from emergency care only and making conclusion for
hospital as a whole.
• Collecting data from small group while making conclusion for larger group
• Collecting data from 50 adult smoker cancer patient from Aseer region but
making conclusion about kingdom of Saudi Arabia.
12. TYPES OF STATISTICS
Statistics is considered as one kind of information.
Any Information can be classified into two branches:
• QUALITATIVE
• QUANTITATIVE
13. Qualitative vs. Quantitative
Qualitative Data
Overview:
Deals with descriptions.
Data can be observed but not
measured.
Colors, textures, smells, tastes,
appearance, beauty, etc.
Qualitative → Quality
Quantitative Data
Overview:
Deals with numbers.
Data which can be measured.
Length, height, area, volume, weight,
speed, time, temperature, humidity,
sound levels, cost, members, ages, etc.
Quantitative → Quantity
14. Population Versus Sample
Population — The whole; a collection of all persons, objects,
or items under study
Census — Gathering data from the entire population
Sample — Gathering data on a subset of the population.
16. Levels of Data Measurement
Nominal — In nominal measurement the values just "name" the
attribute uniquely.
No ordering of the cases is implied.
For example, a persons gender is nominal. It doesn’t matter
whether you call them boys vs. girls or males vs. females or XY
vs. XX chromosomes.
Another example is religion – Catholic, Protestant, Muslim, etc.
17. Ordinal - A variable is ordinal measurable if ranking is possible for
values of the variable.
For example, a gold medal reflects superior performance to a silver or
bronze medal in the Olympics. You can’t say a gold and a bronze
medal average out to a silver medal, though.
Preference scales are typically ordinal – how much do you like this
cereal? Like it a lot, somewhat like it, neutral, somewhat dislike it,
dislike it a lot.
Levels of Data Measurement
18. Interval - In interval measurement the distance between attributes
does have meaning.
Numerical data typically fall into this category
For example, when measuring temperature (in Fahrenheit), the
distance from 30-40 is same as the distance from 70-80. The
interval between values is interpretable.
Levels of Data Measurement
19. Ratio — in ratio measurement there is always a reference point
that is meaningful (either 0 for rates or 1 for ratios)
This means that you can construct a meaningful fraction
(or ratio) with a ratio variable.
In applied social research most "count" variables are ratio, for
example, the number of clients in past six months.
Levels of Data Measurement
20. Cardinal - A variable is cardinally measurable if a given interval
between measures has a consistent meaning, i.e., if the
measure corresponds to points along a straight line.
For example, height, output, and income are cardinally
measurable
Levels of Data Measurement
21. • Numbers are used to classify or categorize
• Example : Employment Classification
1. for Doctor
2. for Manager
3. for Supporting Staff
Nominal Level Data
22. • Numbers are used to indicate rank or order
• Relative magnitude of numbers is meaningful
• Differences between numbers are not comparable
Example : Ranking between patient depending on the seriousness
Example : Position within an organization
1. for President
2. for Vice President
3. for Dean
4. for Vice Dean
5. for Head of Department
Ordinal Level Data
23. Faculty and staff should receive preferential
treatment for parking space.
1 2 3 4 5
Strongly
Agree
Agree Strongly
Disagree
Disagree
Neutral
Ordinal Data
24. • Interval Level data - Distances between consecutive integers are equal
• Relative magnitude of numbers is meaningful
• Differences between numbers are comparable
• Location of origin, zero, is arbitrary
• Vertical intercept of unit of measure transform function is not zero
Example : Fahrenheit Temperature
Example : Monetary Utility
Interval Level Data
25. • Highest level of measurement
• Relative magnitude of numbers is meaningful
• Differences between numbers are comparable
• Location of origin, zero, is absolute (natural)
• Vertical intercept of unit of measure transform function
is zero
Examples: Height, Weight, Length and Volume
Examples: Age, Patient Arrival Rate in hospital per hour, Waiting
time in hospital etc.
Ratio Level Data
26. • Parametric statistics – requires that the data be interval
or ratio
• Non Parametric – used if data are nominal or ordinal
• Non parametric statistics can be used to analyze interval
or ratio data
Ratio Level Data
27. Data Level
Nominal
Ordinal
Interval
Ratio
Meaningful Operations
Classifying and Counting
All of the above plus Ranking
All of the above plus Addition, Subtraction,
Multiplication, and Division (including means,
standard deviations, etc.)
All of the above
Data Level, Operations, and
Statistical Methods