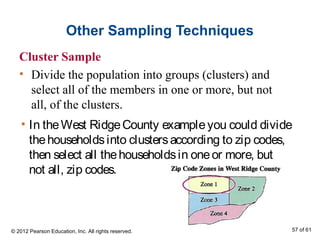
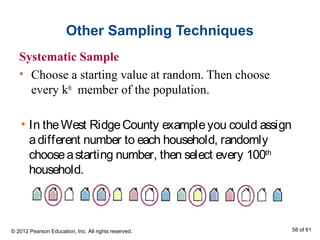
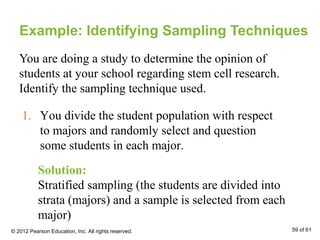
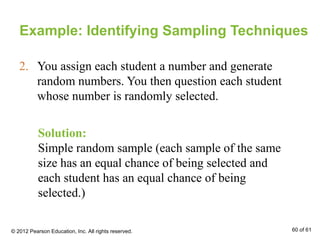
This document provides an overview of key concepts in statistics, including:
- Defining statistics, populations, samples, parameters, and statistics.
- Distinguishing between descriptive and inferential statistics.
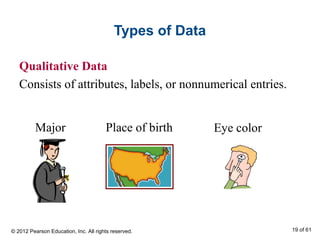
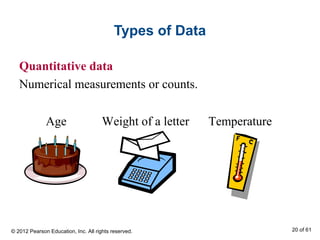
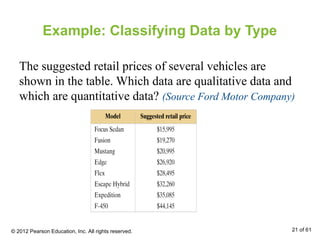
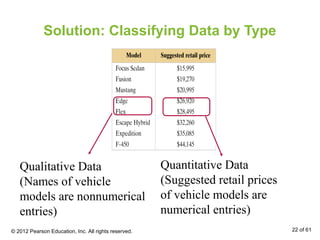
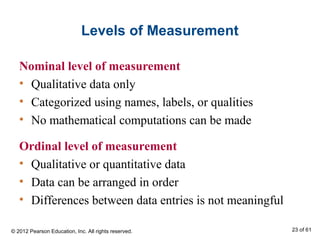
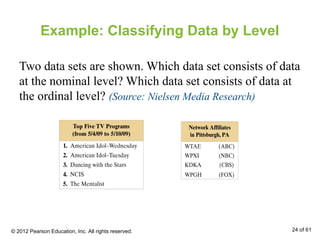
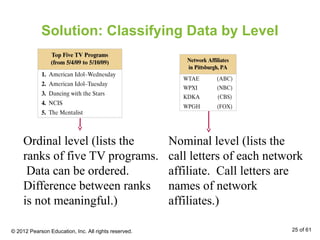
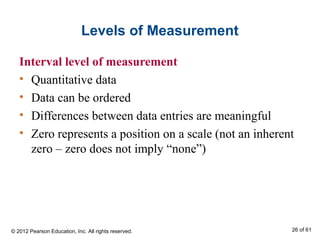
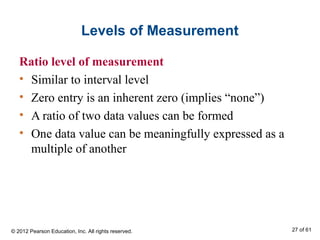
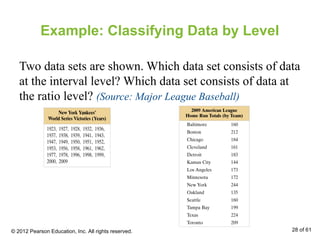
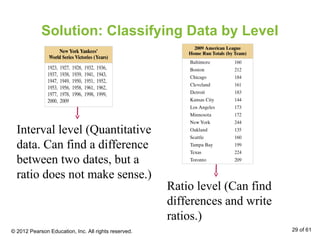
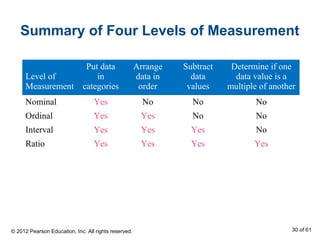
- Classifying data as qualitative or quantitative, and discussing the four levels of measurement.
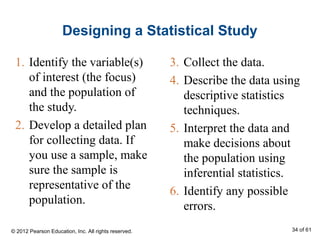
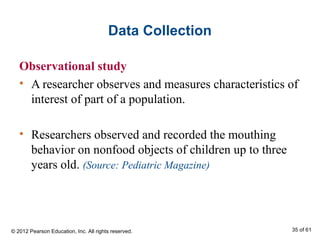
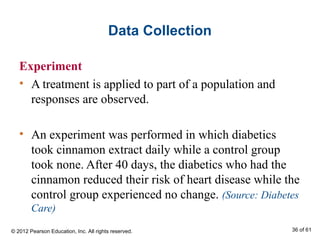
- Outlining the steps for designing statistical studies and experiments, and discussing methods for data collection and sampling.