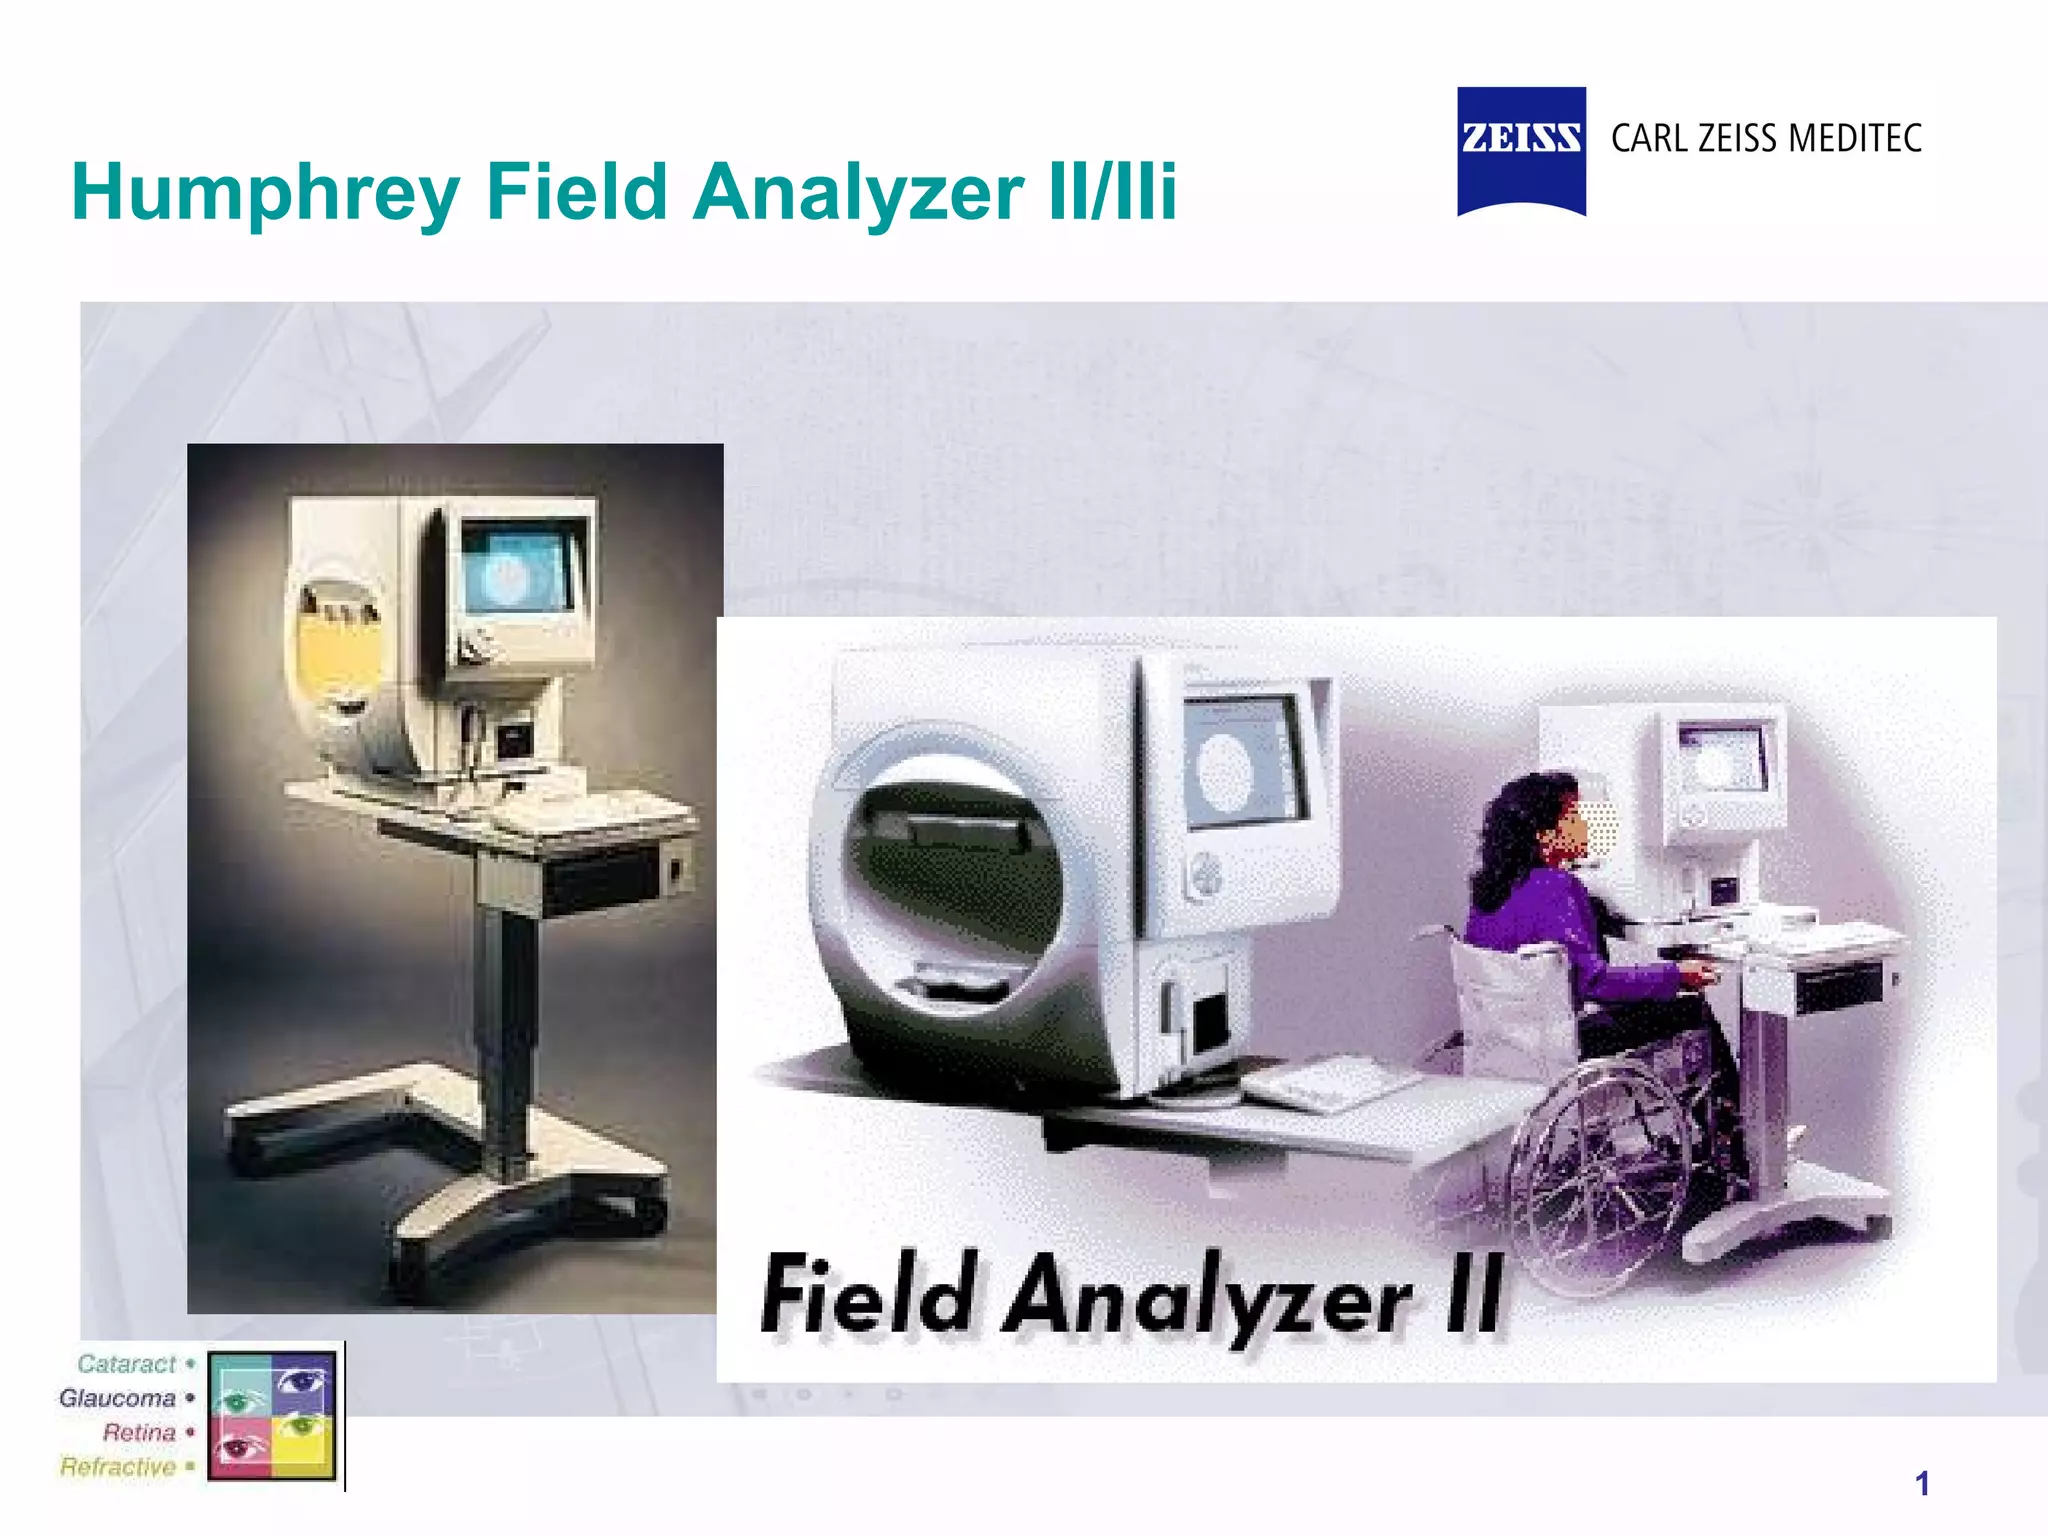
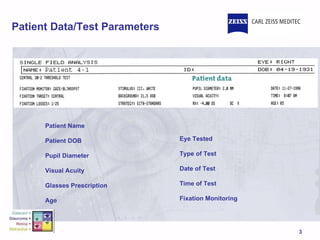
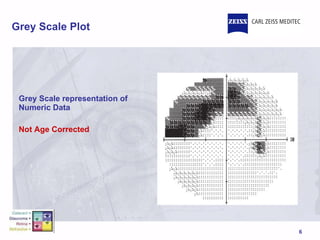
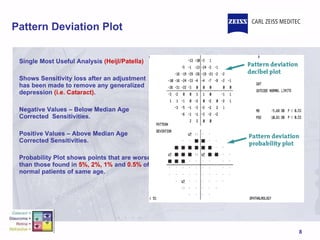
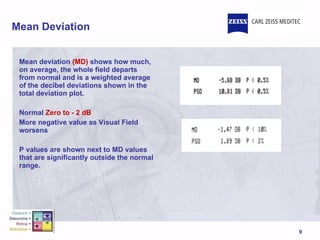
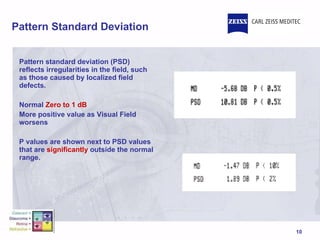
Humphrey Field Analyzer II/IIi
The HFA II Printout What does it all mean??
Patient Data/Test Parameters Eye Tested Type of Test Date of Test Time of Test Fixation Monitoring Patient Name Patient DOB Pupil Diameter Visual Acuity Glasses Prescription Age
Reliability Indicators Fixation Losses False Positive Errors False Negative Errors Gaze Tracking
Raw Numeric Thresholds Numeric Values for Each Data Point Can look for low or high values or pattern of loss
Grey Scale Plot Grey Scale representation of Numeric Data Not Age Corrected
Total Deviation Plot Total Deviation Probability Plots show all locations that are outside of normal limits Threshold Sensitivity is compared at each point with  Age-corrected Normal values . The difference is shown on the Total Deviation Decibel Plot. Negative Values – Below Median Age Corrected  Sensitivities Positive Values – Above Median Age Corrected Sensitivities Probability Plot shows points that are worse than those found in  5%, 2%, 1%  and  0.5%  of normal patients of same age.
Pattern Deviation Plot Single Most Useful Analysis  (Heijl/Patella) Shows Sensitivity loss after an adjustment has been made to remove any generalized depression  (i.e. Cataract) . Negative Values – Below Median Age Corrected  Sensitivities. Positive Values – Above Median Age Corrected Sensitivities. Probability Plot shows points that are worse than those found in  5%, 2%, 1%  and  0.5%  of normal patients of same age.
Mean Deviation Mean deviation  (MD)  shows how much, on average, the whole field departs from normal and is a weighted average of the decibel deviations shown in the total deviation plot. Normal  Zero to - 2 dB More negative value as Visual Field worsens P values are shown next to MD values that are significantly outside the normal range.
Pattern Standard Deviation Pattern standard deviation (PSD) reflects irregularities in the field, such as those caused by localized field defects.  Normal  Zero to 1 dB More positive value as Visual Field worsens P values are shown next to PSD values that are  significantly  outside the normal range.

The hfa ii printout

  • 1.
  • 2.
    The HFA IIPrintout What does it all mean??
  • 3.
    Patient Data/Test ParametersEye Tested Type of Test Date of Test Time of Test Fixation Monitoring Patient Name Patient DOB Pupil Diameter Visual Acuity Glasses Prescription Age
  • 4.
    Reliability Indicators FixationLosses False Positive Errors False Negative Errors Gaze Tracking
  • 5.
    Raw Numeric ThresholdsNumeric Values for Each Data Point Can look for low or high values or pattern of loss
  • 6.
    Grey Scale PlotGrey Scale representation of Numeric Data Not Age Corrected
  • 7.
    Total Deviation PlotTotal Deviation Probability Plots show all locations that are outside of normal limits Threshold Sensitivity is compared at each point with Age-corrected Normal values . The difference is shown on the Total Deviation Decibel Plot. Negative Values – Below Median Age Corrected Sensitivities Positive Values – Above Median Age Corrected Sensitivities Probability Plot shows points that are worse than those found in 5%, 2%, 1% and 0.5% of normal patients of same age.
  • 8.
    Pattern Deviation PlotSingle Most Useful Analysis (Heijl/Patella) Shows Sensitivity loss after an adjustment has been made to remove any generalized depression (i.e. Cataract) . Negative Values – Below Median Age Corrected Sensitivities. Positive Values – Above Median Age Corrected Sensitivities. Probability Plot shows points that are worse than those found in 5%, 2%, 1% and 0.5% of normal patients of same age.
  • 9.
    Mean Deviation Meandeviation (MD) shows how much, on average, the whole field departs from normal and is a weighted average of the decibel deviations shown in the total deviation plot. Normal Zero to - 2 dB More negative value as Visual Field worsens P values are shown next to MD values that are significantly outside the normal range.
  • 10.
    Pattern Standard DeviationPattern standard deviation (PSD) reflects irregularities in the field, such as those caused by localized field defects. Normal Zero to 1 dB More positive value as Visual Field worsens P values are shown next to PSD values that are significantly outside the normal range.