Downloaded 771 times

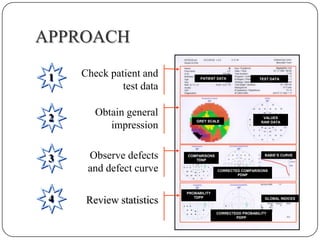
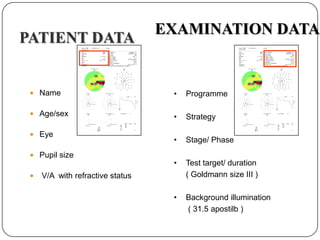
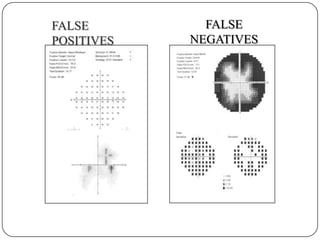
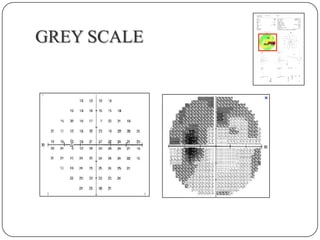
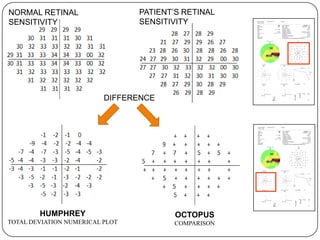
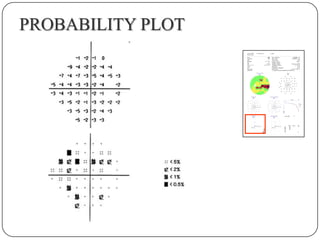
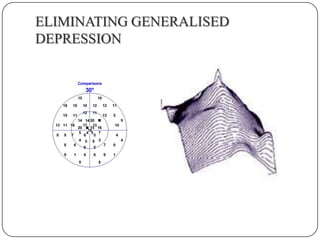
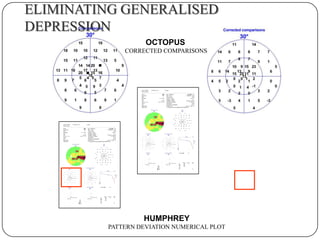
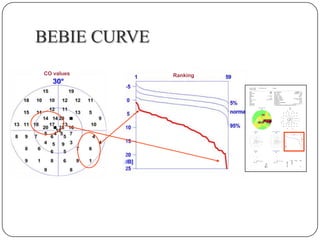
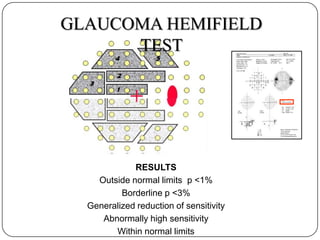
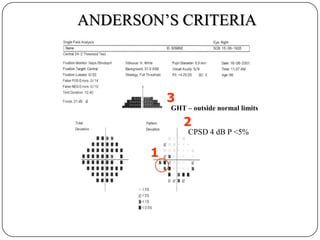
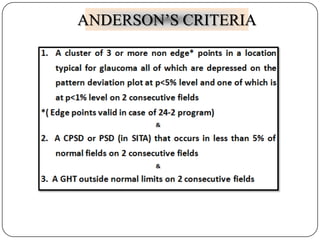
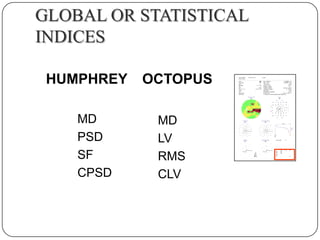
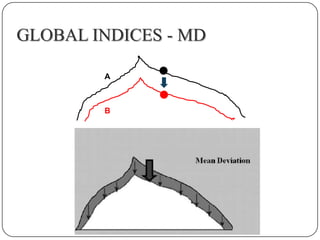
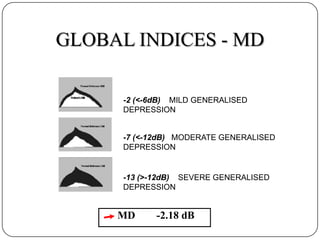
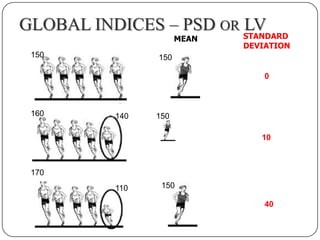
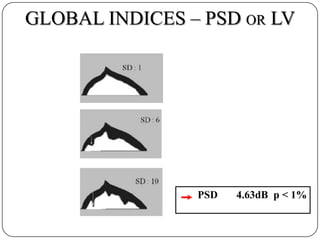
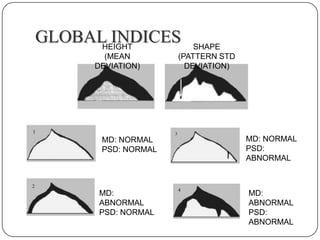
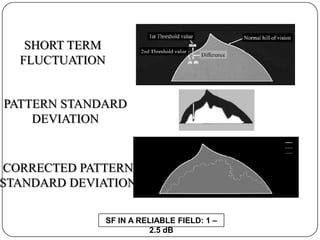


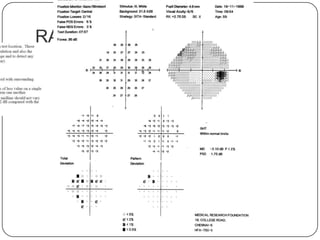
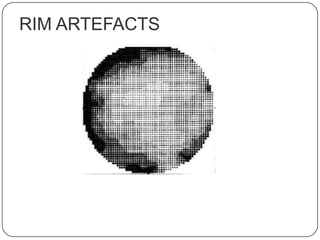
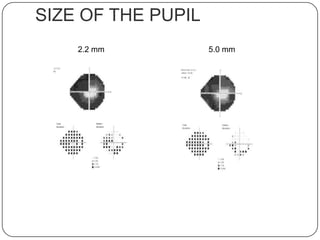
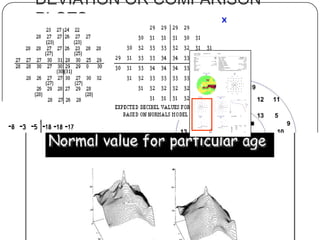
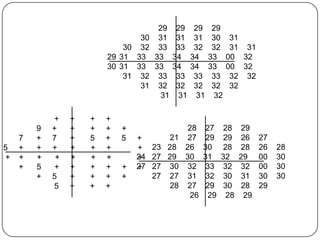
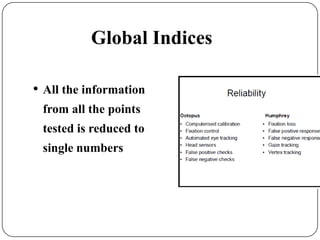
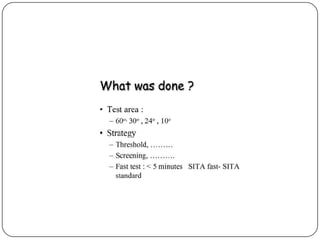
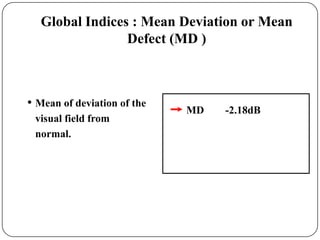
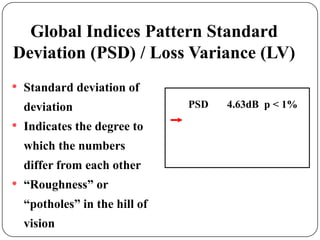
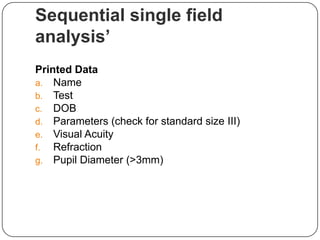
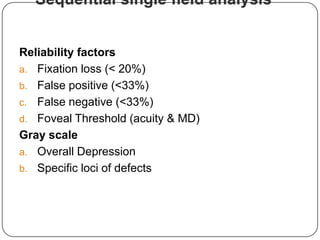
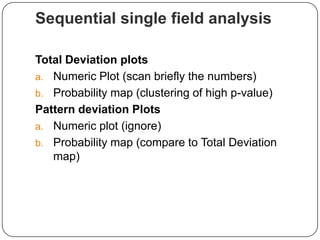
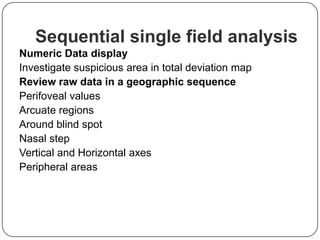
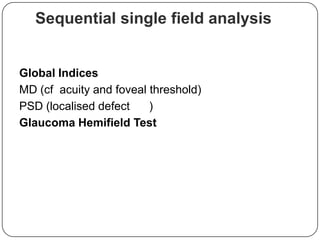

This document provides guidance on interpreting visual field tests. It outlines the key steps which include checking patient and test data, obtaining a general impression, observing defects and curves, and reviewing statistics. Various plots and indices are described that analyze retinal sensitivity values, compare them to normal values, and evaluate for abnormalities. Global indices like mean deviation and pattern standard deviation reduce the field data into single numbers. The reliability and quality of the test are also important to evaluate. Factors like eye conditions, testing procedures, and artifacts can influence results.


