SlideShare a Scribd company logo
1 of 10
Introduction to T-
distribution
The t-distribution is a probability distribution used in statistical analysis
when the sample size is small or the population standard deviation is
unknown. It is commonly used for hypothesis testing and constructing
confidence intervals.
Sa by Shriram Kargaonkar
Definition of T-distribution
The T-distribution, also known as the Student's t-distribution, is a
probability distribution that arises when estimating the mean of a normally
distributed population with a small sample size. It is a bell-shaped curve
that is similar to the standard normal distribution, but with heavier tails,
indicating a greater probability of extreme values.
The T-distribution is used in statistical hypothesis testing and confidence
interval estimation when the population standard deviation is unknown. It
is particularly useful for making inferences about the mean of a small
sample drawn from a normally distributed population.
Properties of T-distribution
1. The T-distribution is a family of continuous probability distributions
that are symmetric, bell-shaped, and centered around 0.
2. The shape of the T-distribution is determined by its degrees of
freedom, which reflects the amount of information available in the
sample.
3. As the degrees of freedom increase, the T-distribution approaches
the standard normal distribution, making it useful for small sample
sizes.
Assumptions of T-distribution
The T-distribution makes several key assumptions that must be met for it
to be applicable. These include that the data is normally distributed, the
samples are independent, and the population variance is unknown.
Violations of these assumptions can lead to inaccurate results when using
T-tests for hypothesis testing. It's crucial to carefully evaluate the data
before selecting the appropriate statistical method.
Hypothesis testing with T-distribution
1
Sampling Distributions
When the sample size is small, the
normal distribution may not accurately
represent the population. The T-
distribution is used to account for the
increased uncertainty in small sample
estimates.
2 Hypothesis Formulation
T-distribution is commonly used to test
hypotheses about population means
when the variance is unknown. The
null and alternative hypotheses are
formulated based on the research
question.
3
Test Statistic Calculation
The T-statistic is calculated by dividing
the difference between the sample
mean and the hypothesized population
mean by the standard error of the
mean. This accounts for the
uncertainty in the sample.
One-sample T-test
The one-sample T-test is a statistical hypothesis
test used to determine if the mean of a
population is significantly different from a
specified value. It is commonly used when the
sample size is small and the population standard
deviation is unknown.
The test assumes the data follows a normal
distribution and calculates a T-statistic that is
compared to a T-distribution to determine the p-
value and make a decision about the hypothesis.
Two-sample T-test
1 Comparing Two Means
The two-sample T-test is used to
determine if the means of two independent
populations are significantly different.
2 Assumptions
The test assumes the two samples are
normally distributed and have equal
variances.
3 Hypothesis Testing
The null hypothesis is that the two
population means are equal, while the
alternative hypothesis is that they are
different.
4 Interpreting Results
The T-statistic and p-value are used to
determine if the difference between the
means is statistically significant.
Paired T-test
The paired T-test is a statistical method used to compare the means of two related samples or
measurements. This test is particularly useful when analyzing data where each observation in one
sample is paired with a corresponding observation in the other sample, such as before-and-after
measurements or data collected from the same individuals under different conditions.
3
Steps
The paired T-test involves three main steps:
calculating the difference between each pair of
observations, finding the mean of these
differences, and then testing whether the mean
difference is significantly different from zero.
95%
Confidence
The paired T-test allows researchers to determine
whether the observed difference between the two
groups is statistically significant, with a
confidence level typically set at 95%.
The key assumptions of the paired T-test are that the differences between the paired observations are
normally distributed and that the observations are independent. Violating these assumptions can affect
the validity of the test results.
Confidence intervals with T-distribution
Concept Overview
T-distribution is used to
construct confidence intervals
when the population standard
deviation is unknown. It
accounts for the uncertainty in
estimating the standard
deviation.
Calculation
The formula uses the t-statistic,
sample mean, sample size,
and a desired confidence level
to determine the range of
plausible values for the
population mean.
Interpretation
The confidence interval
represents the range of values
where the true population
mean is likely to fall. Wider
intervals indicate greater
uncertainty.
Applications and Examples
Real-World
Scenarios
T-distribution is
widely used in
various fields, such
as finance,
engineering, and
medical research, to
make inferences
about population
parameters when
sample sizes are
small.
Hypothesis
Testing
1. Evaluating the
effectiveness
of a new drug
treatment
2. Comparing
the average
income of
two different
regions
3. Assessing
the reliability
of a new
manufacturin
g process
Confidence
Intervals
T-distribution is used
to construct
confidence intervals
for population
means, proportions,
and variances,
providing a range of
plausible values for
the unknown
parameter.
Quality Control
In quality control
applications, T-
distribution is used
to analyze sample
data and make
decisions about the
process, such as
determining if a
production line is
operating within
acceptable limits.

More Related Content

Similar to Introduction-to-Tests based on T-distribution.pptx

Chapter 3 Confidence Interval
Chapter 3 Confidence IntervalChapter 3 Confidence Interval
Chapter 3 Confidence Intervalghalan
 
Review & Hypothesis Testing
Review & Hypothesis TestingReview & Hypothesis Testing
Review & Hypothesis TestingSr Edith Bogue
 
Application of Central Limit Theorem to Study the Student Skills in Verbal, A...
Application of Central Limit Theorem to Study the Student Skills in Verbal, A...Application of Central Limit Theorem to Study the Student Skills in Verbal, A...
Application of Central Limit Theorem to Study the Student Skills in Verbal, A...theijes
 
What is the need of the t Distribution According to the central.pdf
What is the need of the t Distribution According to the central.pdfWhat is the need of the t Distribution According to the central.pdf
What is the need of the t Distribution According to the central.pdfaravlitraders2012
 
Soni_Biostatistics.ppt
Soni_Biostatistics.pptSoni_Biostatistics.ppt
Soni_Biostatistics.pptOgunsina1
 
TREATMENT OF DATA_Scrd.pptx
TREATMENT OF DATA_Scrd.pptxTREATMENT OF DATA_Scrd.pptx
TREATMENT OF DATA_Scrd.pptxCarmela857185
 
Confidence Intervals in the Life Sciences PresentationNamesS.docx
Confidence Intervals in the Life Sciences PresentationNamesS.docxConfidence Intervals in the Life Sciences PresentationNamesS.docx
Confidence Intervals in the Life Sciences PresentationNamesS.docxmaxinesmith73660
 
Chapter 3 Confidence Interval Revby Rao
Chapter 3 Confidence Interval Revby RaoChapter 3 Confidence Interval Revby Rao
Chapter 3 Confidence Interval Revby RaoSumit Prajapati
 
satatistics Presentation.pptx
satatistics Presentation.pptxsatatistics Presentation.pptx
satatistics Presentation.pptxMdMatiurRahman25
 
1. complete stats notes
1. complete stats notes1. complete stats notes
1. complete stats notesBob Smullen
 
Sampling and statistical inference
Sampling and statistical inferenceSampling and statistical inference
Sampling and statistical inferenceBhavik A Shah
 
1 statistical analysis notes
1 statistical analysis notes1 statistical analysis notes
1 statistical analysis notescartlidge
 
Mpu 1033 Kuliah 9
Mpu 1033 Kuliah 9Mpu 1033 Kuliah 9
Mpu 1033 Kuliah 9SITI AHMAD
 

Similar to Introduction-to-Tests based on T-distribution.pptx (20)

Chapter 3 Confidence Interval
Chapter 3 Confidence IntervalChapter 3 Confidence Interval
Chapter 3 Confidence Interval
 
Parametric tests
Parametric testsParametric tests
Parametric tests
 
Review & Hypothesis Testing
Review & Hypothesis TestingReview & Hypothesis Testing
Review & Hypothesis Testing
 
Application of Central Limit Theorem to Study the Student Skills in Verbal, A...
Application of Central Limit Theorem to Study the Student Skills in Verbal, A...Application of Central Limit Theorem to Study the Student Skills in Verbal, A...
Application of Central Limit Theorem to Study the Student Skills in Verbal, A...
 
Basic statistics
Basic statisticsBasic statistics
Basic statistics
 
The t test mean comparison 1
The t test mean comparison 1The t test mean comparison 1
The t test mean comparison 1
 
What is the need of the t Distribution According to the central.pdf
What is the need of the t Distribution According to the central.pdfWhat is the need of the t Distribution According to the central.pdf
What is the need of the t Distribution According to the central.pdf
 
Soni_Biostatistics.ppt
Soni_Biostatistics.pptSoni_Biostatistics.ppt
Soni_Biostatistics.ppt
 
TREATMENT OF DATA_Scrd.pptx
TREATMENT OF DATA_Scrd.pptxTREATMENT OF DATA_Scrd.pptx
TREATMENT OF DATA_Scrd.pptx
 
Confidence Intervals in the Life Sciences PresentationNamesS.docx
Confidence Intervals in the Life Sciences PresentationNamesS.docxConfidence Intervals in the Life Sciences PresentationNamesS.docx
Confidence Intervals in the Life Sciences PresentationNamesS.docx
 
Chapter 3 Confidence Interval Revby Rao
Chapter 3 Confidence Interval Revby RaoChapter 3 Confidence Interval Revby Rao
Chapter 3 Confidence Interval Revby Rao
 
satatistics Presentation.pptx
satatistics Presentation.pptxsatatistics Presentation.pptx
satatistics Presentation.pptx
 
T‑tests
T‑testsT‑tests
T‑tests
 
1. complete stats notes
1. complete stats notes1. complete stats notes
1. complete stats notes
 
STAT-t statistic.ppt
STAT-t statistic.pptSTAT-t statistic.ppt
STAT-t statistic.ppt
 
Sampling and statistical inference
Sampling and statistical inferenceSampling and statistical inference
Sampling and statistical inference
 
1 statistical analysis notes
1 statistical analysis notes1 statistical analysis notes
1 statistical analysis notes
 
Parametric Test
Parametric TestParametric Test
Parametric Test
 
Mpu 1033 Kuliah 9
Mpu 1033 Kuliah 9Mpu 1033 Kuliah 9
Mpu 1033 Kuliah 9
 
Descriptive Analysis.pptx
Descriptive Analysis.pptxDescriptive Analysis.pptx
Descriptive Analysis.pptx
 

More from ShriramKargaonkar

Introduction-to-Parametric-and-Non-Parametric-Tests.pptx
Introduction-to-Parametric-and-Non-Parametric-Tests.pptxIntroduction-to-Parametric-and-Non-Parametric-Tests.pptx
Introduction-to-Parametric-and-Non-Parametric-Tests.pptxShriramKargaonkar
 
Chi-square-Distribution: Introduction & Applications
Chi-square-Distribution: Introduction & ApplicationsChi-square-Distribution: Introduction & Applications
Chi-square-Distribution: Introduction & ApplicationsShriramKargaonkar
 
Introduction-to-Hypothesis-Testing Explained in detail
Introduction-to-Hypothesis-Testing Explained in detailIntroduction-to-Hypothesis-Testing Explained in detail
Introduction-to-Hypothesis-Testing Explained in detailShriramKargaonkar
 
Introduction-to-Non-Linear-Regression.pptx
Introduction-to-Non-Linear-Regression.pptxIntroduction-to-Non-Linear-Regression.pptx
Introduction-to-Non-Linear-Regression.pptxShriramKargaonkar
 
REGRESSION ANALYSIS THEORY EXPLAINED HERE
REGRESSION ANALYSIS THEORY EXPLAINED HEREREGRESSION ANALYSIS THEORY EXPLAINED HERE
REGRESSION ANALYSIS THEORY EXPLAINED HEREShriramKargaonkar
 
2. Introduction-to-Measures-of-Central-Tendency.pptx
2. Introduction-to-Measures-of-Central-Tendency.pptx2. Introduction-to-Measures-of-Central-Tendency.pptx
2. Introduction-to-Measures-of-Central-Tendency.pptxShriramKargaonkar
 
An-Introduction-to-Correlation-and-Linear-Regression FYBSc(IT) SNK.pptx
An-Introduction-to-Correlation-and-Linear-Regression FYBSc(IT) SNK.pptxAn-Introduction-to-Correlation-and-Linear-Regression FYBSc(IT) SNK.pptx
An-Introduction-to-Correlation-and-Linear-Regression FYBSc(IT) SNK.pptxShriramKargaonkar
 
PPT Concepts Relating to Testing of Hypothesis.pptx
PPT Concepts Relating to Testing of Hypothesis.pptxPPT Concepts Relating to Testing of Hypothesis.pptx
PPT Concepts Relating to Testing of Hypothesis.pptxShriramKargaonkar
 
Population and Sample Testing of Hypothesis
Population and Sample Testing of HypothesisPopulation and Sample Testing of Hypothesis
Population and Sample Testing of HypothesisShriramKargaonkar
 
MS 1_Definition of Statistics.pptx
MS 1_Definition of Statistics.pptxMS 1_Definition of Statistics.pptx
MS 1_Definition of Statistics.pptxShriramKargaonkar
 
Population and Sample CPDTH.pptx
Population and Sample CPDTH.pptxPopulation and Sample CPDTH.pptx
Population and Sample CPDTH.pptxShriramKargaonkar
 
3. Concepts Relating to Testing of Hypothesis.pptx
3. Concepts Relating to Testing of Hypothesis.pptx3. Concepts Relating to Testing of Hypothesis.pptx
3. Concepts Relating to Testing of Hypothesis.pptxShriramKargaonkar
 

More from ShriramKargaonkar (16)

Introduction-to-Parametric-and-Non-Parametric-Tests.pptx
Introduction-to-Parametric-and-Non-Parametric-Tests.pptxIntroduction-to-Parametric-and-Non-Parametric-Tests.pptx
Introduction-to-Parametric-and-Non-Parametric-Tests.pptx
 
Chi-square-Distribution: Introduction & Applications
Chi-square-Distribution: Introduction & ApplicationsChi-square-Distribution: Introduction & Applications
Chi-square-Distribution: Introduction & Applications
 
Introduction-to-Hypothesis-Testing Explained in detail
Introduction-to-Hypothesis-Testing Explained in detailIntroduction-to-Hypothesis-Testing Explained in detail
Introduction-to-Hypothesis-Testing Explained in detail
 
Introduction-to-Non-Linear-Regression.pptx
Introduction-to-Non-Linear-Regression.pptxIntroduction-to-Non-Linear-Regression.pptx
Introduction-to-Non-Linear-Regression.pptx
 
REGRESSION ANALYSIS THEORY EXPLAINED HERE
REGRESSION ANALYSIS THEORY EXPLAINED HEREREGRESSION ANALYSIS THEORY EXPLAINED HERE
REGRESSION ANALYSIS THEORY EXPLAINED HERE
 
2. Introduction-to-Measures-of-Central-Tendency.pptx
2. Introduction-to-Measures-of-Central-Tendency.pptx2. Introduction-to-Measures-of-Central-Tendency.pptx
2. Introduction-to-Measures-of-Central-Tendency.pptx
 
An-Introduction-to-Correlation-and-Linear-Regression FYBSc(IT) SNK.pptx
An-Introduction-to-Correlation-and-Linear-Regression FYBSc(IT) SNK.pptxAn-Introduction-to-Correlation-and-Linear-Regression FYBSc(IT) SNK.pptx
An-Introduction-to-Correlation-and-Linear-Regression FYBSc(IT) SNK.pptx
 
PPT Concepts Relating to Testing of Hypothesis.pptx
PPT Concepts Relating to Testing of Hypothesis.pptxPPT Concepts Relating to Testing of Hypothesis.pptx
PPT Concepts Relating to Testing of Hypothesis.pptx
 
Population and Sample Testing of Hypothesis
Population and Sample Testing of HypothesisPopulation and Sample Testing of Hypothesis
Population and Sample Testing of Hypothesis
 
MS 1_Definition of Statistics.pptx
MS 1_Definition of Statistics.pptxMS 1_Definition of Statistics.pptx
MS 1_Definition of Statistics.pptx
 
DS-Intro.pptx
DS-Intro.pptxDS-Intro.pptx
DS-Intro.pptx
 
MS-Intro.pptx
MS-Intro.pptxMS-Intro.pptx
MS-Intro.pptx
 
DS 4_CT_1.pptx
DS 4_CT_1.pptxDS 4_CT_1.pptx
DS 4_CT_1.pptx
 
Sampling Methods.pptx
Sampling Methods.pptxSampling Methods.pptx
Sampling Methods.pptx
 
Population and Sample CPDTH.pptx
Population and Sample CPDTH.pptxPopulation and Sample CPDTH.pptx
Population and Sample CPDTH.pptx
 
3. Concepts Relating to Testing of Hypothesis.pptx
3. Concepts Relating to Testing of Hypothesis.pptx3. Concepts Relating to Testing of Hypothesis.pptx
3. Concepts Relating to Testing of Hypothesis.pptx
 

Recently uploaded

Call Girls in Dwarka Mor Delhi Contact Us 9654467111
Call Girls in Dwarka Mor Delhi Contact Us 9654467111Call Girls in Dwarka Mor Delhi Contact Us 9654467111
Call Girls in Dwarka Mor Delhi Contact Us 9654467111Sapana Sha
 
The Most Excellent Way | 1 Corinthians 13
The Most Excellent Way | 1 Corinthians 13The Most Excellent Way | 1 Corinthians 13
The Most Excellent Way | 1 Corinthians 13Steve Thomason
 
SOCIAL AND HISTORICAL CONTEXT - LFTVD.pptx
SOCIAL AND HISTORICAL CONTEXT - LFTVD.pptxSOCIAL AND HISTORICAL CONTEXT - LFTVD.pptx
SOCIAL AND HISTORICAL CONTEXT - LFTVD.pptxiammrhaywood
 
_Math 4-Q4 Week 5.pptx Steps in Collecting Data
_Math 4-Q4 Week 5.pptx Steps in Collecting Data_Math 4-Q4 Week 5.pptx Steps in Collecting Data
_Math 4-Q4 Week 5.pptx Steps in Collecting DataJhengPantaleon
 
Mastering the Unannounced Regulatory Inspection
Mastering the Unannounced Regulatory InspectionMastering the Unannounced Regulatory Inspection
Mastering the Unannounced Regulatory InspectionSafetyChain Software
 
Alper Gobel In Media Res Media Component
Alper Gobel In Media Res Media ComponentAlper Gobel In Media Res Media Component
Alper Gobel In Media Res Media ComponentInMediaRes1
 
call girls in Kamla Market (DELHI) 🔝 >༒9953330565🔝 genuine Escort Service 🔝✔️✔️
call girls in Kamla Market (DELHI) 🔝 >༒9953330565🔝 genuine Escort Service 🔝✔️✔️call girls in Kamla Market (DELHI) 🔝 >༒9953330565🔝 genuine Escort Service 🔝✔️✔️
call girls in Kamla Market (DELHI) 🔝 >༒9953330565🔝 genuine Escort Service 🔝✔️✔️9953056974 Low Rate Call Girls In Saket, Delhi NCR
 
CARE OF CHILD IN INCUBATOR..........pptx
CARE OF CHILD IN INCUBATOR..........pptxCARE OF CHILD IN INCUBATOR..........pptx
CARE OF CHILD IN INCUBATOR..........pptxGaneshChakor2
 
Class 11 Legal Studies Ch-1 Concept of State .pdf
Class 11 Legal Studies Ch-1 Concept of State .pdfClass 11 Legal Studies Ch-1 Concept of State .pdf
Class 11 Legal Studies Ch-1 Concept of State .pdfakmcokerachita
 
Proudly South Africa powerpoint Thorisha.pptx
Proudly South Africa powerpoint Thorisha.pptxProudly South Africa powerpoint Thorisha.pptx
Proudly South Africa powerpoint Thorisha.pptxthorishapillay1
 
Software Engineering Methodologies (overview)
Software Engineering Methodologies (overview)Software Engineering Methodologies (overview)
Software Engineering Methodologies (overview)eniolaolutunde
 
भारत-रोम व्यापार.pptx, Indo-Roman Trade,
भारत-रोम व्यापार.pptx, Indo-Roman Trade,भारत-रोम व्यापार.pptx, Indo-Roman Trade,
भारत-रोम व्यापार.pptx, Indo-Roman Trade,Virag Sontakke
 
Hybridoma Technology ( Production , Purification , and Application )
Hybridoma Technology  ( Production , Purification , and Application  ) Hybridoma Technology  ( Production , Purification , and Application  )
Hybridoma Technology ( Production , Purification , and Application ) Sakshi Ghasle
 
Blooming Together_ Growing a Community Garden Worksheet.docx
Blooming Together_ Growing a Community Garden Worksheet.docxBlooming Together_ Growing a Community Garden Worksheet.docx
Blooming Together_ Growing a Community Garden Worksheet.docxUnboundStockton
 
How to Configure Email Server in Odoo 17
How to Configure Email Server in Odoo 17How to Configure Email Server in Odoo 17
How to Configure Email Server in Odoo 17Celine George
 
Presiding Officer Training module 2024 lok sabha elections
Presiding Officer Training module 2024 lok sabha electionsPresiding Officer Training module 2024 lok sabha elections
Presiding Officer Training module 2024 lok sabha electionsanshu789521
 
Organic Name Reactions for the students and aspirants of Chemistry12th.pptx
Organic Name Reactions  for the students and aspirants of Chemistry12th.pptxOrganic Name Reactions  for the students and aspirants of Chemistry12th.pptx
Organic Name Reactions for the students and aspirants of Chemistry12th.pptxVS Mahajan Coaching Centre
 

Recently uploaded (20)

Call Girls in Dwarka Mor Delhi Contact Us 9654467111
Call Girls in Dwarka Mor Delhi Contact Us 9654467111Call Girls in Dwarka Mor Delhi Contact Us 9654467111
Call Girls in Dwarka Mor Delhi Contact Us 9654467111
 
The Most Excellent Way | 1 Corinthians 13
The Most Excellent Way | 1 Corinthians 13The Most Excellent Way | 1 Corinthians 13
The Most Excellent Way | 1 Corinthians 13
 
TataKelola dan KamSiber Kecerdasan Buatan v022.pdf
TataKelola dan KamSiber Kecerdasan Buatan v022.pdfTataKelola dan KamSiber Kecerdasan Buatan v022.pdf
TataKelola dan KamSiber Kecerdasan Buatan v022.pdf
 
SOCIAL AND HISTORICAL CONTEXT - LFTVD.pptx
SOCIAL AND HISTORICAL CONTEXT - LFTVD.pptxSOCIAL AND HISTORICAL CONTEXT - LFTVD.pptx
SOCIAL AND HISTORICAL CONTEXT - LFTVD.pptx
 
_Math 4-Q4 Week 5.pptx Steps in Collecting Data
_Math 4-Q4 Week 5.pptx Steps in Collecting Data_Math 4-Q4 Week 5.pptx Steps in Collecting Data
_Math 4-Q4 Week 5.pptx Steps in Collecting Data
 
Mastering the Unannounced Regulatory Inspection
Mastering the Unannounced Regulatory InspectionMastering the Unannounced Regulatory Inspection
Mastering the Unannounced Regulatory Inspection
 
Model Call Girl in Bikash Puri Delhi reach out to us at 🔝9953056974🔝
Model Call Girl in Bikash Puri  Delhi reach out to us at 🔝9953056974🔝Model Call Girl in Bikash Puri  Delhi reach out to us at 🔝9953056974🔝
Model Call Girl in Bikash Puri Delhi reach out to us at 🔝9953056974🔝
 
Alper Gobel In Media Res Media Component
Alper Gobel In Media Res Media ComponentAlper Gobel In Media Res Media Component
Alper Gobel In Media Res Media Component
 
call girls in Kamla Market (DELHI) 🔝 >༒9953330565🔝 genuine Escort Service 🔝✔️✔️
call girls in Kamla Market (DELHI) 🔝 >༒9953330565🔝 genuine Escort Service 🔝✔️✔️call girls in Kamla Market (DELHI) 🔝 >༒9953330565🔝 genuine Escort Service 🔝✔️✔️
call girls in Kamla Market (DELHI) 🔝 >༒9953330565🔝 genuine Escort Service 🔝✔️✔️
 
CARE OF CHILD IN INCUBATOR..........pptx
CARE OF CHILD IN INCUBATOR..........pptxCARE OF CHILD IN INCUBATOR..........pptx
CARE OF CHILD IN INCUBATOR..........pptx
 
Class 11 Legal Studies Ch-1 Concept of State .pdf
Class 11 Legal Studies Ch-1 Concept of State .pdfClass 11 Legal Studies Ch-1 Concept of State .pdf
Class 11 Legal Studies Ch-1 Concept of State .pdf
 
Proudly South Africa powerpoint Thorisha.pptx
Proudly South Africa powerpoint Thorisha.pptxProudly South Africa powerpoint Thorisha.pptx
Proudly South Africa powerpoint Thorisha.pptx
 
Model Call Girl in Tilak Nagar Delhi reach out to us at 🔝9953056974🔝
Model Call Girl in Tilak Nagar Delhi reach out to us at 🔝9953056974🔝Model Call Girl in Tilak Nagar Delhi reach out to us at 🔝9953056974🔝
Model Call Girl in Tilak Nagar Delhi reach out to us at 🔝9953056974🔝
 
Software Engineering Methodologies (overview)
Software Engineering Methodologies (overview)Software Engineering Methodologies (overview)
Software Engineering Methodologies (overview)
 
भारत-रोम व्यापार.pptx, Indo-Roman Trade,
भारत-रोम व्यापार.pptx, Indo-Roman Trade,भारत-रोम व्यापार.pptx, Indo-Roman Trade,
भारत-रोम व्यापार.pptx, Indo-Roman Trade,
 
Hybridoma Technology ( Production , Purification , and Application )
Hybridoma Technology  ( Production , Purification , and Application  ) Hybridoma Technology  ( Production , Purification , and Application  )
Hybridoma Technology ( Production , Purification , and Application )
 
Blooming Together_ Growing a Community Garden Worksheet.docx
Blooming Together_ Growing a Community Garden Worksheet.docxBlooming Together_ Growing a Community Garden Worksheet.docx
Blooming Together_ Growing a Community Garden Worksheet.docx
 
How to Configure Email Server in Odoo 17
How to Configure Email Server in Odoo 17How to Configure Email Server in Odoo 17
How to Configure Email Server in Odoo 17
 
Presiding Officer Training module 2024 lok sabha elections
Presiding Officer Training module 2024 lok sabha electionsPresiding Officer Training module 2024 lok sabha elections
Presiding Officer Training module 2024 lok sabha elections
 
Organic Name Reactions for the students and aspirants of Chemistry12th.pptx
Organic Name Reactions  for the students and aspirants of Chemistry12th.pptxOrganic Name Reactions  for the students and aspirants of Chemistry12th.pptx
Organic Name Reactions for the students and aspirants of Chemistry12th.pptx
 

Introduction-to-Tests based on T-distribution.pptx

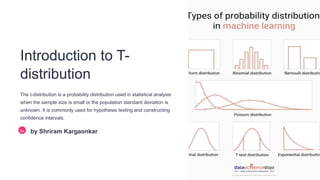
  • 1. Introduction to T- distribution The t-distribution is a probability distribution used in statistical analysis when the sample size is small or the population standard deviation is unknown. It is commonly used for hypothesis testing and constructing confidence intervals. Sa by Shriram Kargaonkar
  • 2. Definition of T-distribution The T-distribution, also known as the Student's t-distribution, is a probability distribution that arises when estimating the mean of a normally distributed population with a small sample size. It is a bell-shaped curve that is similar to the standard normal distribution, but with heavier tails, indicating a greater probability of extreme values. The T-distribution is used in statistical hypothesis testing and confidence interval estimation when the population standard deviation is unknown. It is particularly useful for making inferences about the mean of a small sample drawn from a normally distributed population.
  • 3. Properties of T-distribution 1. The T-distribution is a family of continuous probability distributions that are symmetric, bell-shaped, and centered around 0. 2. The shape of the T-distribution is determined by its degrees of freedom, which reflects the amount of information available in the sample. 3. As the degrees of freedom increase, the T-distribution approaches the standard normal distribution, making it useful for small sample sizes.
  • 4. Assumptions of T-distribution The T-distribution makes several key assumptions that must be met for it to be applicable. These include that the data is normally distributed, the samples are independent, and the population variance is unknown. Violations of these assumptions can lead to inaccurate results when using T-tests for hypothesis testing. It's crucial to carefully evaluate the data before selecting the appropriate statistical method.
  • 5. Hypothesis testing with T-distribution 1 Sampling Distributions When the sample size is small, the normal distribution may not accurately represent the population. The T- distribution is used to account for the increased uncertainty in small sample estimates. 2 Hypothesis Formulation T-distribution is commonly used to test hypotheses about population means when the variance is unknown. The null and alternative hypotheses are formulated based on the research question. 3 Test Statistic Calculation The T-statistic is calculated by dividing the difference between the sample mean and the hypothesized population mean by the standard error of the mean. This accounts for the uncertainty in the sample.
  • 6. One-sample T-test The one-sample T-test is a statistical hypothesis test used to determine if the mean of a population is significantly different from a specified value. It is commonly used when the sample size is small and the population standard deviation is unknown. The test assumes the data follows a normal distribution and calculates a T-statistic that is compared to a T-distribution to determine the p- value and make a decision about the hypothesis.
  • 7. Two-sample T-test 1 Comparing Two Means The two-sample T-test is used to determine if the means of two independent populations are significantly different. 2 Assumptions The test assumes the two samples are normally distributed and have equal variances. 3 Hypothesis Testing The null hypothesis is that the two population means are equal, while the alternative hypothesis is that they are different. 4 Interpreting Results The T-statistic and p-value are used to determine if the difference between the means is statistically significant.
  • 8. Paired T-test The paired T-test is a statistical method used to compare the means of two related samples or measurements. This test is particularly useful when analyzing data where each observation in one sample is paired with a corresponding observation in the other sample, such as before-and-after measurements or data collected from the same individuals under different conditions. 3 Steps The paired T-test involves three main steps: calculating the difference between each pair of observations, finding the mean of these differences, and then testing whether the mean difference is significantly different from zero. 95% Confidence The paired T-test allows researchers to determine whether the observed difference between the two groups is statistically significant, with a confidence level typically set at 95%. The key assumptions of the paired T-test are that the differences between the paired observations are normally distributed and that the observations are independent. Violating these assumptions can affect the validity of the test results.
  • 9. Confidence intervals with T-distribution Concept Overview T-distribution is used to construct confidence intervals when the population standard deviation is unknown. It accounts for the uncertainty in estimating the standard deviation. Calculation The formula uses the t-statistic, sample mean, sample size, and a desired confidence level to determine the range of plausible values for the population mean. Interpretation The confidence interval represents the range of values where the true population mean is likely to fall. Wider intervals indicate greater uncertainty.
  • 10. Applications and Examples Real-World Scenarios T-distribution is widely used in various fields, such as finance, engineering, and medical research, to make inferences about population parameters when sample sizes are small. Hypothesis Testing 1. Evaluating the effectiveness of a new drug treatment 2. Comparing the average income of two different regions 3. Assessing the reliability of a new manufacturin g process Confidence Intervals T-distribution is used to construct confidence intervals for population means, proportions, and variances, providing a range of plausible values for the unknown parameter. Quality Control In quality control applications, T- distribution is used to analyze sample data and make decisions about the process, such as determining if a production line is operating within acceptable limits.