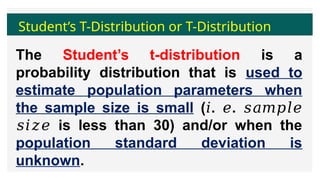
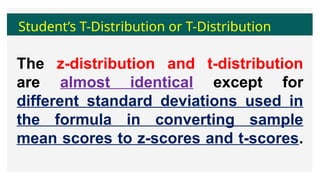
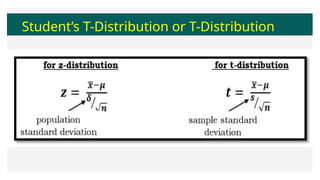
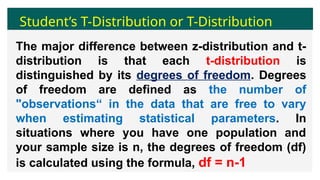
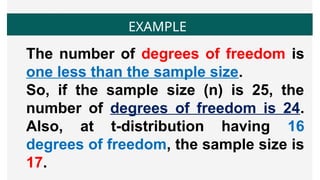
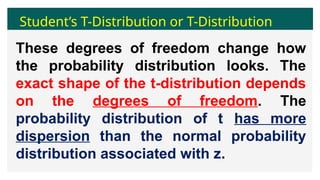
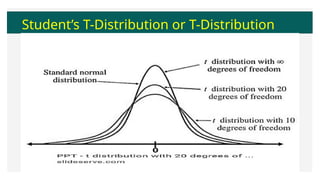
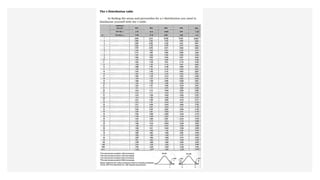
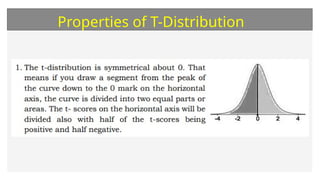
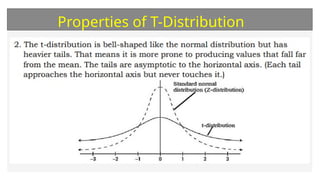
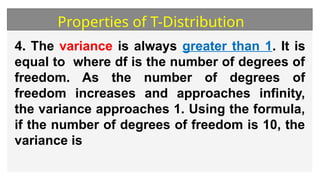
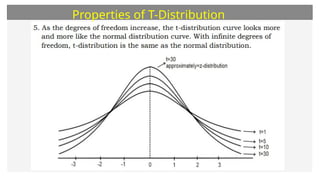
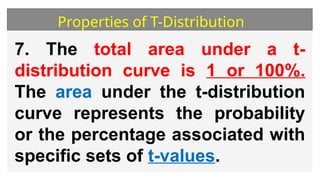
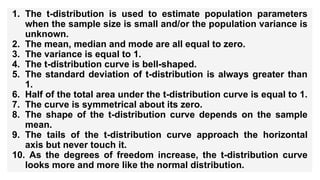
STUDENT’S
T-DISTRIBUTION
LESSON 7
LESSON OBJECTIVES
illustrates a T-Distribution and its
properties;
1
2
3
identifies Percentiles using T-Distribution
table;
Student’s T-Distribution or T-Distribution
The Student’s t-distribution is a
probability distribution that is used to
estimate population parameters when
the sample size is small ( . .
𝑖 𝑒 𝑠𝑎𝑚𝑝𝑙𝑒
is less than 30) and/or when the
𝑠𝑖𝑧𝑒
population standard deviation is
unknown.
Student’s T-Distribution or T-Distribution
The z-distribution and t-distribution
are almost identical except for
different standard deviations used in
the formula in converting sample
mean scores to z-scores and t-scores.
Student’s T-Distribution or T-Distribution
The major difference between z-distribution and t-
distribution is that each t-distribution is
distinguished by its degrees of freedom. Degrees
of freedom are defined as the number of
"observations“ in the data that are free to vary
when estimating statistical parameters. In
situations where you have one population and
your sample size is n, the degrees of freedom (df)
is calculated using the formula, df = n-1
EXAMPLE
The number of degrees of freedom is
one less than the sample size.
So, if the sample size (n) is 25, the
number of degrees of freedom is 24.
Also, at t-distribution having 16
degrees of freedom, the sample size is
17.
Student’s T-Distribution or T-Distribution
These degrees of freedom change how
the probability distribution looks. The
exact shape of the t-distribution depends
on the degrees of freedom. The
probability distribution of t has more
dispersion than the normal probability
distribution associated with z.
Student’s T-Distribution or T-Distribution
Properties of T-Distribution
3. The mean, median, and mode
of the t-distribution are all equal
to zero.
Properties of T-Distribution
4. The variance is always greater than 1. It is
equal to where df is the number of degrees of
freedom. As the number of degrees of
freedom increases and approaches infinity,
the variance approaches 1. Using the formula,
if the number of degrees of freedom is 10, the
variance is
Properties of T-Distribution
6. The standard deviation and
variance of the t-distribution
varies with the sample size. It is
always greater than 1. Unlike the
normal distribution, which has a
standard deviation of 1.
Properties of T-Distribution
7. The total area under a t-
distribution curve is 1 or 100%.
The area under the t-distribution
curve represents the probability
or the percentage associated with
specific sets of t-values.
LET’S TRY IT! – ½ crosswise
A. True or False
B. Solving
1. The t-distribution is used to estimate population parameters
when the sample size is small and/or the population variance is
unknown.
2. The mean, median and mode are all equal to zero.
3. The variance is equal to 1.
4. The t-distribution curve is bell-shaped.
5. The standard deviation of t-distribution is always greater than
1.
6. Half of the total area under the t-distribution curve is equal to 1.
7. The curve is symmetrical about its zero.
8. The shape of the t-distribution curve depends on the sample
mean.
9. The tails of the t-distribution curve approach the horizontal
axis but never touch it.
10. As the degrees of freedom increase, the t-distribution curve
looks more and more like the normal distribution.
Solve the following and show your
solution.
1.Solve the degrees of freedom (df) if the
sample size is 27.
2.Determine the sample size if the
degrees of freedom (df) is 19.
3.If df = 24, n = ?
Lesson 7 - T-DISTRIBUTION.pptx PROBABILITY AND STATISTICS

Lesson 7 - T-DISTRIBUTION.pptx PROBABILITY AND STATISTICS

  • 2.
  • 3.
    LESSON OBJECTIVES illustrates aT-Distribution and its properties; 1 2 3 identifies Percentiles using T-Distribution table;
  • 4.
  • 5.
    Student’s T-Distribution orT-Distribution The Student’s t-distribution is a probability distribution that is used to estimate population parameters when the sample size is small ( . . 𝑖 𝑒 𝑠𝑎𝑚𝑝𝑙𝑒 is less than 30) and/or when the 𝑠𝑖𝑧𝑒 population standard deviation is unknown.
  • 6.
    Student’s T-Distribution orT-Distribution The z-distribution and t-distribution are almost identical except for different standard deviations used in the formula in converting sample mean scores to z-scores and t-scores.
  • 7.
  • 8.
    Student’s T-Distribution orT-Distribution The major difference between z-distribution and t- distribution is that each t-distribution is distinguished by its degrees of freedom. Degrees of freedom are defined as the number of "observations“ in the data that are free to vary when estimating statistical parameters. In situations where you have one population and your sample size is n, the degrees of freedom (df) is calculated using the formula, df = n-1
  • 9.
    EXAMPLE The number ofdegrees of freedom is one less than the sample size. So, if the sample size (n) is 25, the number of degrees of freedom is 24. Also, at t-distribution having 16 degrees of freedom, the sample size is 17.
  • 10.
    Student’s T-Distribution orT-Distribution These degrees of freedom change how the probability distribution looks. The exact shape of the t-distribution depends on the degrees of freedom. The probability distribution of t has more dispersion than the normal probability distribution associated with z.
  • 11.
  • 13.
  • 14.
  • 15.
    Properties of T-Distribution 3.The mean, median, and mode of the t-distribution are all equal to zero.
  • 16.
    Properties of T-Distribution 4.The variance is always greater than 1. It is equal to where df is the number of degrees of freedom. As the number of degrees of freedom increases and approaches infinity, the variance approaches 1. Using the formula, if the number of degrees of freedom is 10, the variance is
  • 17.
  • 18.
    Properties of T-Distribution 6.The standard deviation and variance of the t-distribution varies with the sample size. It is always greater than 1. Unlike the normal distribution, which has a standard deviation of 1.
  • 19.
    Properties of T-Distribution 7.The total area under a t- distribution curve is 1 or 100%. The area under the t-distribution curve represents the probability or the percentage associated with specific sets of t-values.
  • 20.
    LET’S TRY IT!– ½ crosswise A. True or False B. Solving
  • 21.
    1. The t-distributionis used to estimate population parameters when the sample size is small and/or the population variance is unknown. 2. The mean, median and mode are all equal to zero. 3. The variance is equal to 1. 4. The t-distribution curve is bell-shaped. 5. The standard deviation of t-distribution is always greater than 1. 6. Half of the total area under the t-distribution curve is equal to 1. 7. The curve is symmetrical about its zero. 8. The shape of the t-distribution curve depends on the sample mean. 9. The tails of the t-distribution curve approach the horizontal axis but never touch it. 10. As the degrees of freedom increase, the t-distribution curve looks more and more like the normal distribution.
  • 22.
    Solve the followingand show your solution. 1.Solve the degrees of freedom (df) if the sample size is 27. 2.Determine the sample size if the degrees of freedom (df) is 19. 3.If df = 24, n = ?

Editor's Notes

  • #4 Mag based ni sa video na ilahang gi tan aw.
  • #5 Mag based ni sa video na ilahang gi tan aw.
  • #6 Mag based ni sa video na ilahang gi tan aw.
  • #7 Mag based ni sa video na ilahang gi tan aw.
  • #8 Mag based ni sa video na ilahang gi tan aw.
  • #9 Mag based ni sa video na ilahang gi tan aw.
  • #10 Mag based ni sa video na ilahang gi tan aw.