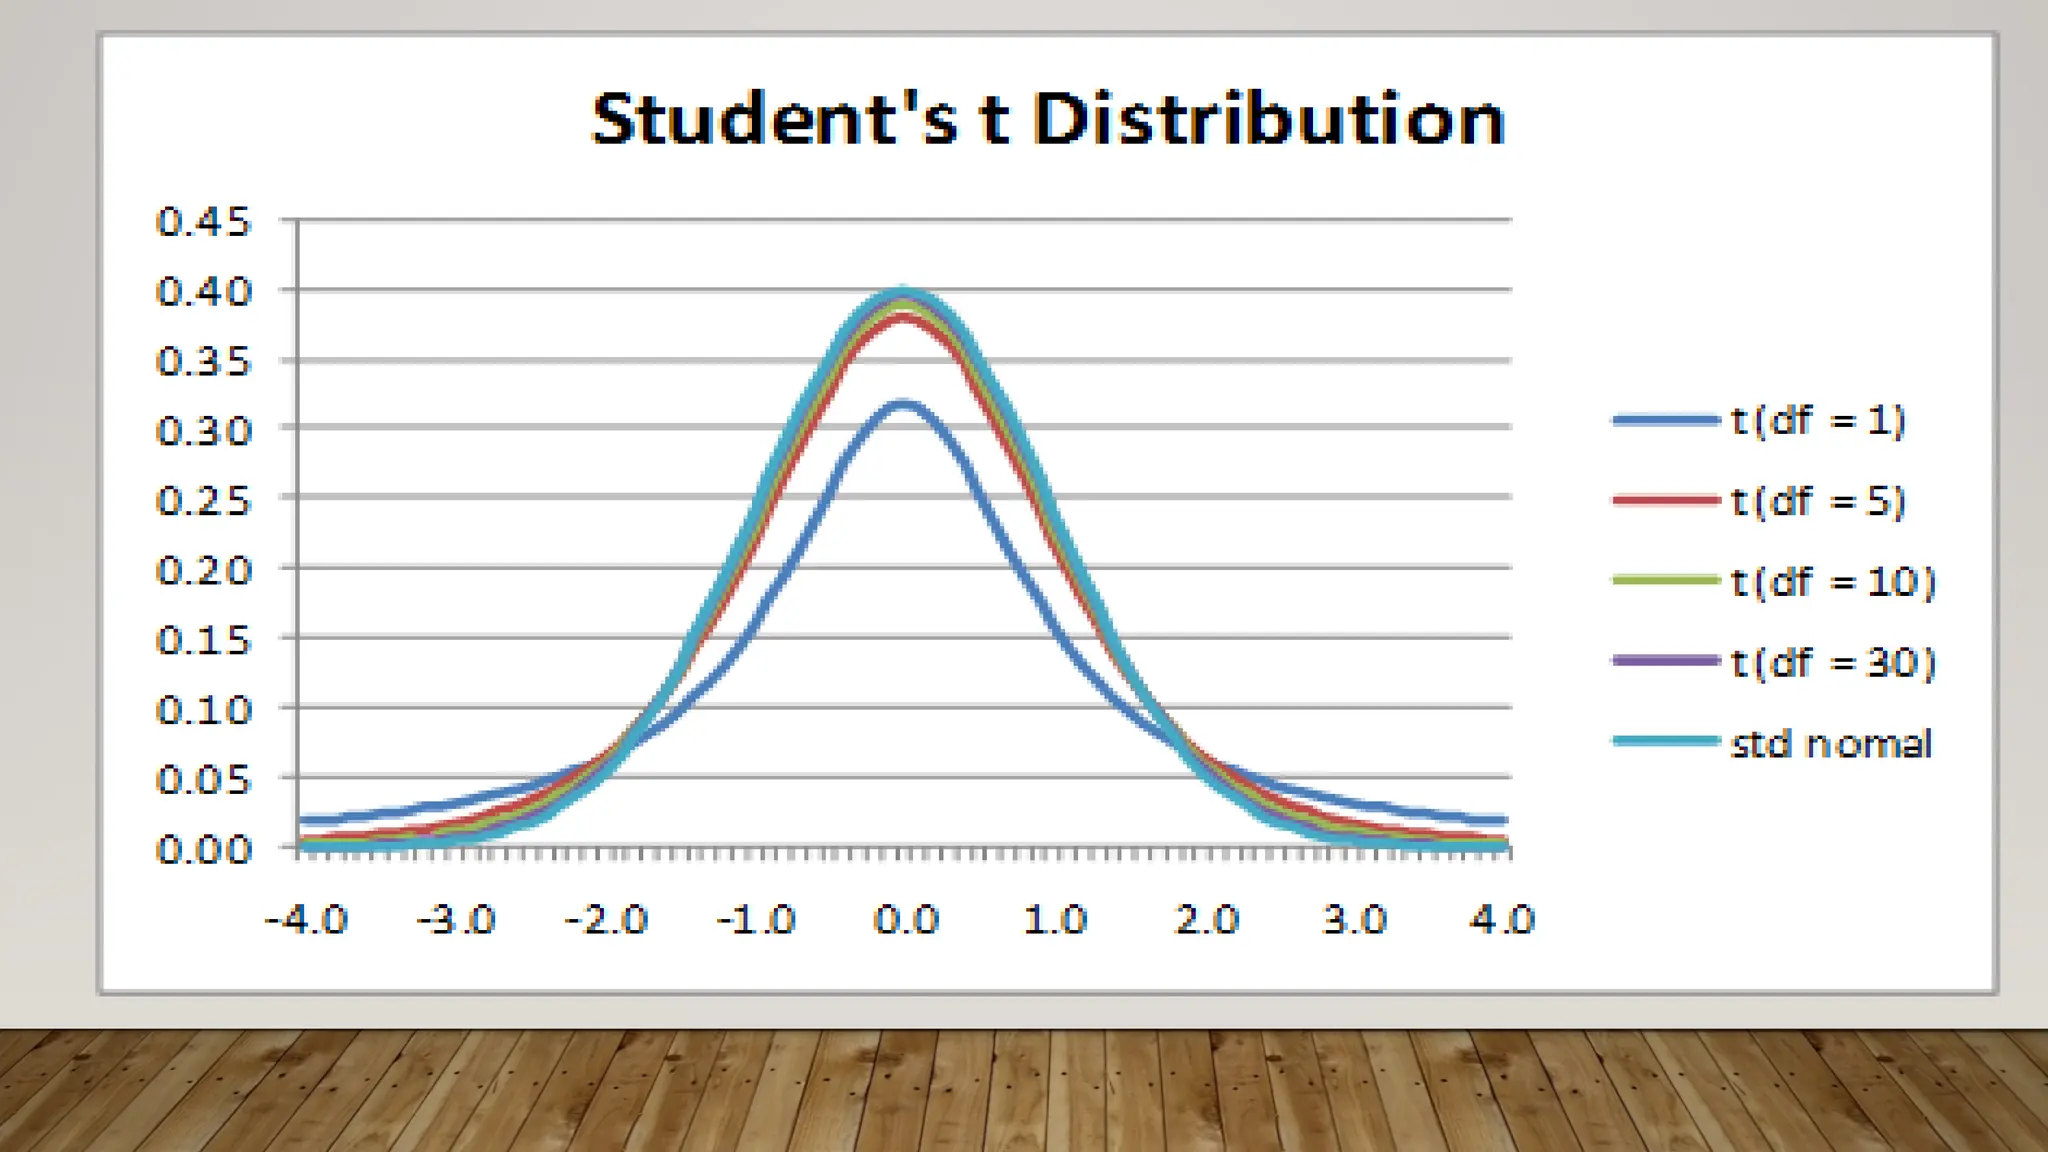
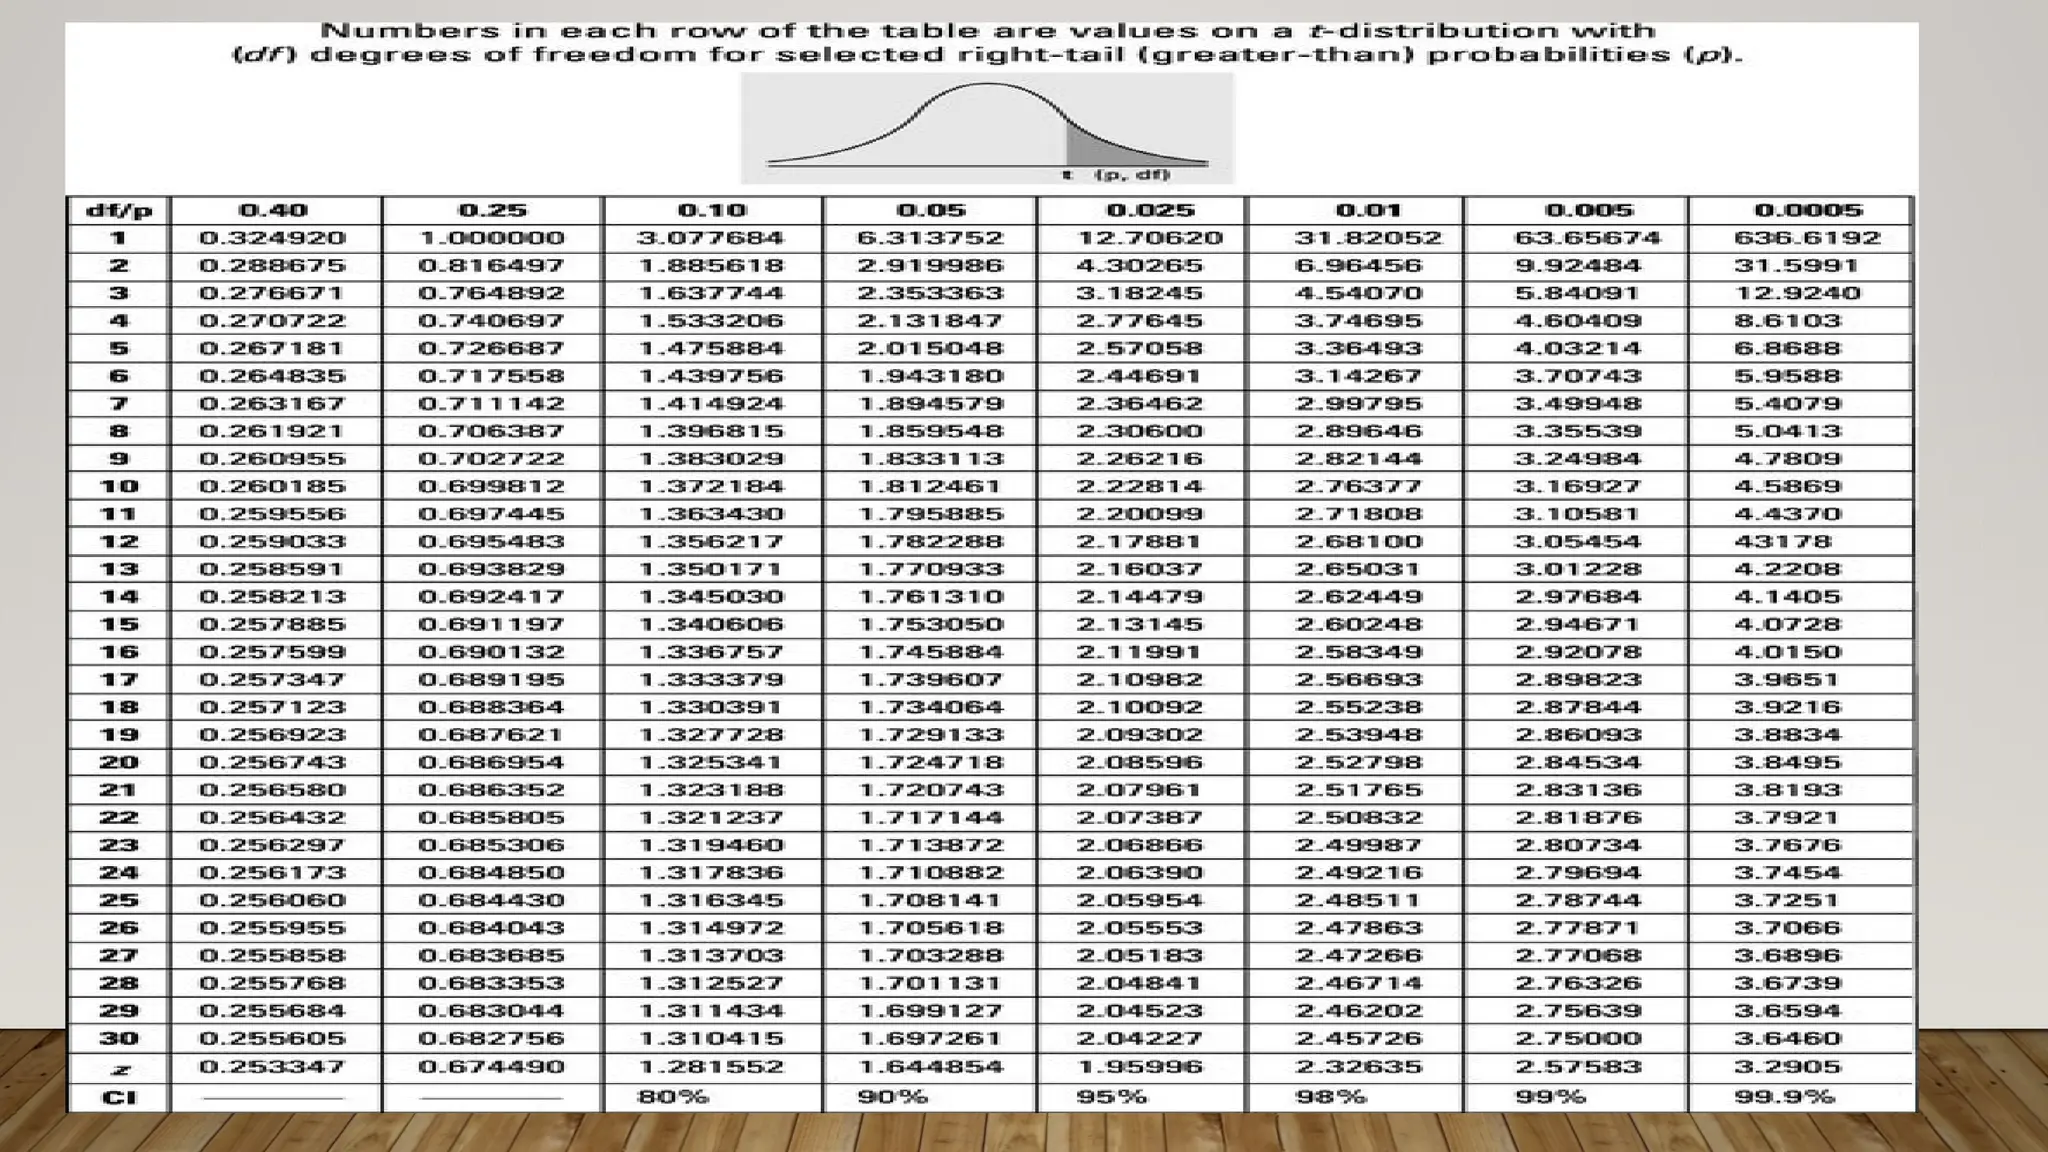
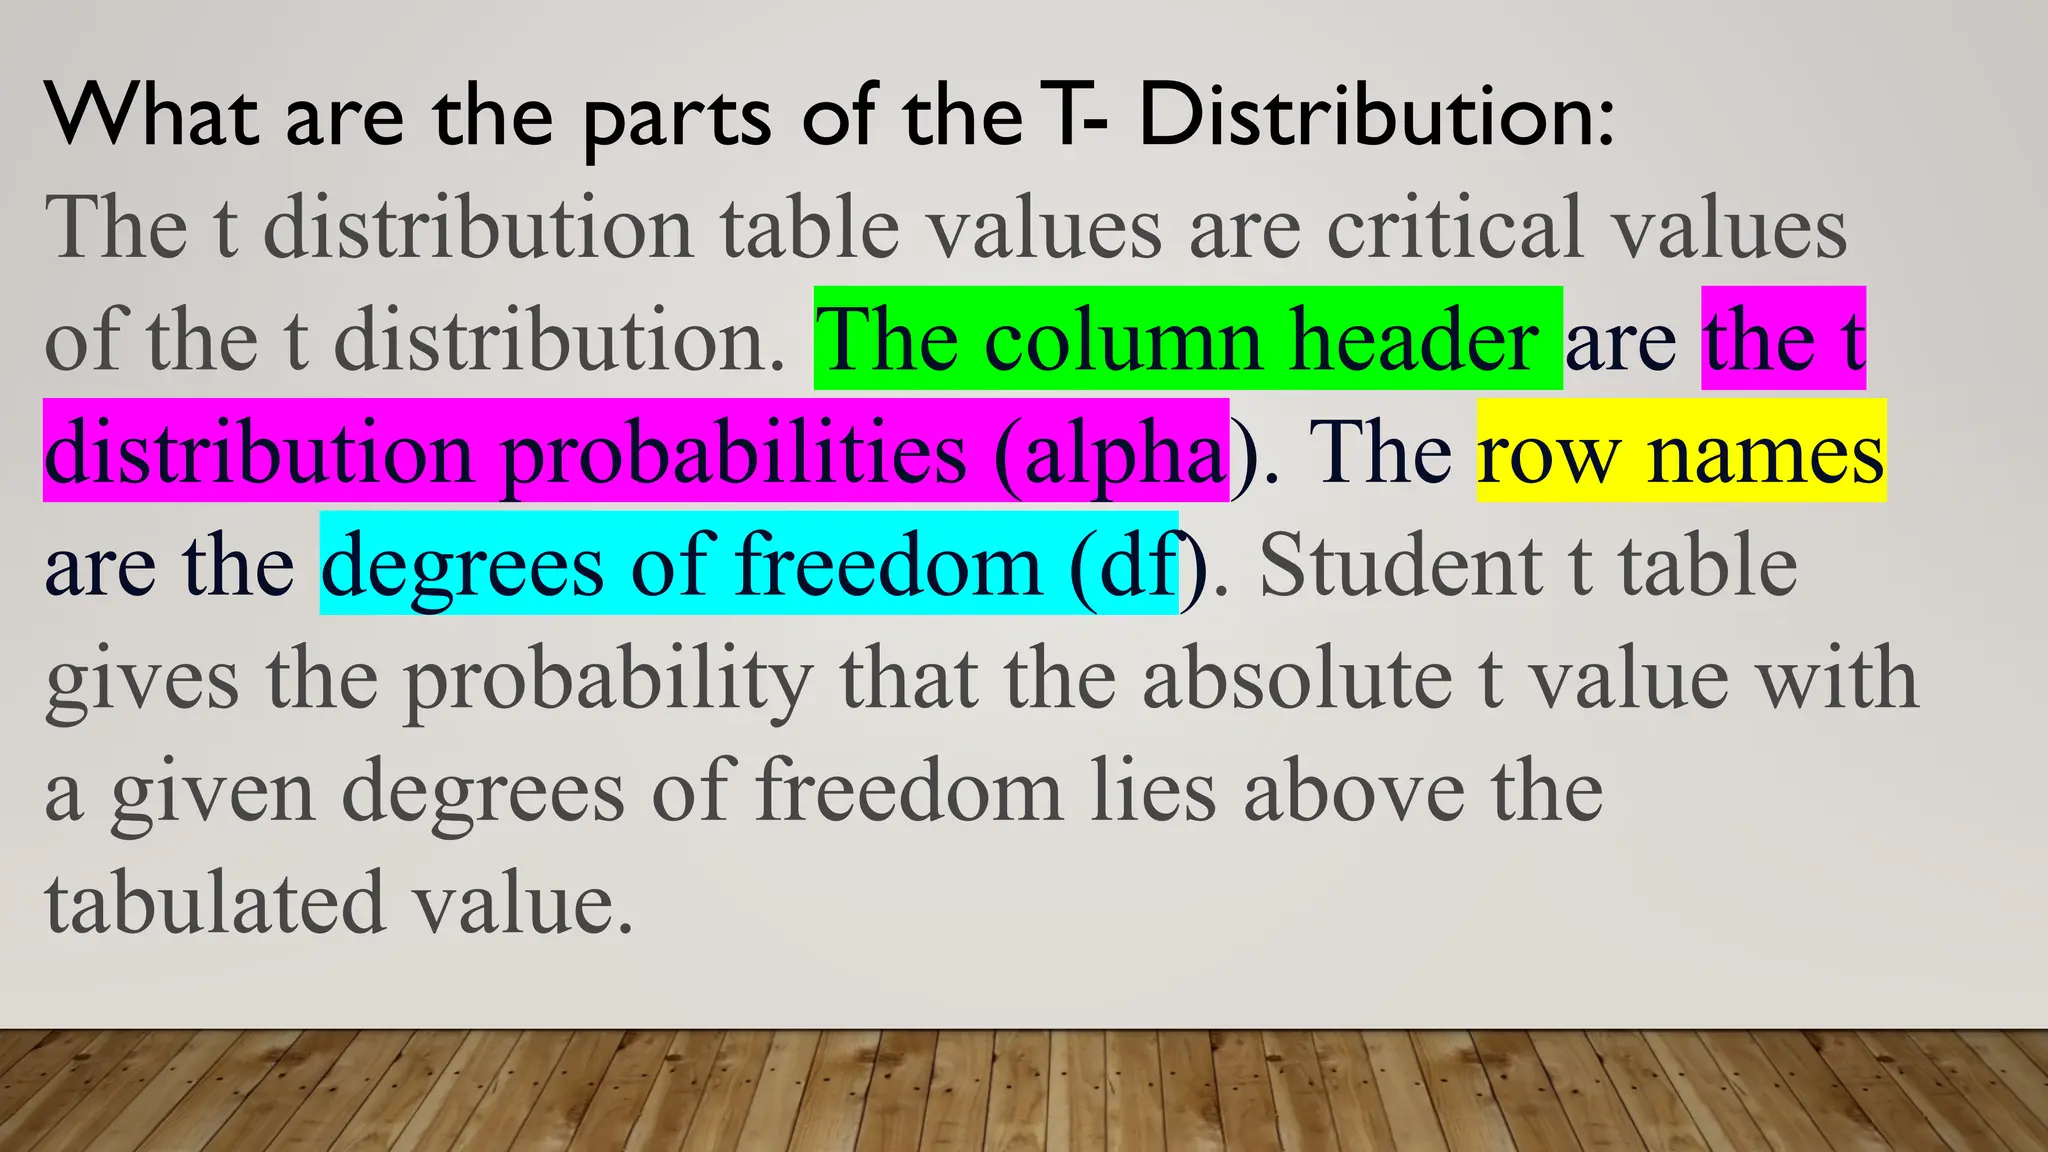
T- DISTRIBUTION
Illustrate the T- Distribution
What Is a T-Distribution?
The t-distribution, also known as the Student’s t-distribution, is
a type of probability distribution that is similar to the
normal distribution with its bell shape but has heavier tails. It
is used for estimating population parameters for small sample
sizes or unknown variances. T-distributions have a greater
chance for extreme values than normal distributions, and as a
result have fatter tails.
What Does a T-Distribution Tell You?
Tail heaviness is determined by a parameter of
the t-distribution called degrees of freedom, with
smaller values giving heavier tails, and with
higher values making the t-distribution resemble
a standard normal distribution with a mean of 0
and a standard deviation of 1
When should you used T-Distribution.
You must use the t-distribution table when
working problems when the population standard
deviation (σ) is not known and the sample size is
small (n<30). General Correct Rule: If σ is not
known, then using t-distribution is correct. If σ is
known, then using the normal distribution is
correct.
Student's t table is also known as the t table, t-
distribution table, t-score table, t-value table,
or t-test table. A critical value of t defines the
threshold for significance for certain statistical
tests and the upper and lower bounds of
confidence intervals for certain estimates.
What are the parts of the T- Distribution:
The t distribution table values are critical values
of the t distribution. The column header are the t
distribution probabilities (alpha). The row names
are the degrees of freedom (df). Student t table
gives the probability that the absolute t value with
a given degrees of freedom lies above the
tabulated value.
What is the mood of T- Distribution:
The mean of the distribution is
equal to 0 for ν > 1 where ν =
degrees of freedom, otherwise
undefined. The median and mode
of the distribution is equal to 0.
How do you identify the T-value of a certain
percentage using the T-Table?
Calculate your T-value by taking the
difference between the mean and
population mean and dividing it over
the standard deviation divided by the
degrees of freedom square root.
T- Distribution formula:
Where: = sample mean
x
̄
S= standard deviation of
the sample mean
n= sample size
To find number degrees of
freedom:
df=n-1
Where: df= degrees of freedom
n= sample size
A student researcher wants to determine whether the
mean score in mathematics of 25 students in Grade 8
Section St. Albert is significant different from the school
mean of 89. The mean and the standard deviation of the
score of the students in section St. Albert are 95 and 15,
respectively. Assume a 95% confidence level.
Sol.
Step 1. Find the degrees of freedom.
df=n-1
= 25-1= 24
Step 2. Find the critical value. Use the table of t Critical
values
Confidence level is 95%.
( 1- 100% = 95%
1- = 0.95
= 0.05
Therefore using the Critical values Table the critical vale is
2.064.
Step 3: Compute the test statistical t.
=
= 2
The computed value of t is equal to 2 which is
smaller than the tabulated value of 2.064
The value of the test statistical or computed t
value does not fall in the critical region.
Therefore, the mean score of grade 8 St. Albert
in mathematics is the same with mean score of
all the students taking up grade 8 mathematics.
Example no.2
A students suspects that the data she collected for
research study do not represent the target population.
Here are the data she collected.
16 27 34 20 29 30 22 30 37 25 30 42
26 32 35
The population mean is 27. Assuming normality in
the target population is the student's suspicion
correct? Use a 90% confidence level.
Observation x X-x
̄ (X- )^2
x
̄
1 16 16-29=-13 169
2 20 20-29=-9 81
3 22 22-29=-7 49
4 25 25-29=-4 16
5 26 26-29=-3 9
6 27 27-29=-2 4
7 29 20-29=0 0
8 30 30-29=1 1
9 30 30-29=1 1
10 32 32-29=3 9
11 34 34-29=5 25
12 30 30-29=1 1
13 37 37-29=8 64
14 42 42-29=13 169
15 35 35-29=6 36
^2= 634
= x/n = 435/15 = 29
x
̄
S^2 = 634/ 15-1 = 45.29
s== 6.73
Step 2. Find the degree of freedom.
df=n-1 = 15-1 = 14
Step 3. Find the critical value.
Confidence level is 90%
( 1- 100% = 90%
1- = 0.90
= 0.10
Step 4. Compute the test statistical t.
Ans. 1.151, How?
The value of the test statistical is less than the
tabular value of 1.761. Therefore, the students is
wrong in suspecting that the data are not
representation of the target population.
Example n0.3 A sample of size n= 20 is a simple
random sample selected from a normally
distributed population. Find the value of t such
that the shaded area to the left of t is 0.05.
a.Find the degrees of freedom df.
Ans. 19, How?
b. t= 1.729, How?
No. 4. Suppose you have a sample of size n= 12 from a
normal distribution. Find the critical value of 7 that
corresponds to a 95% confidence level.
a.Find the degrees of freedom df
df=n-1
Ans. 11, How
b. confidence level of 95%
Ans. 0.025, How?
c. tn/2= 2.025
5. For a t- distribution with 25 degrees of freedom, find
the values of t such that the area of to the right of t is
0.05.
Sol. A. degrees of freedom df= 25, How
tn/2= 1.708
6. For a t-distribution with 14 of freedom, find the value
of t such that area between –t and t is 0.90.
Sol. A. df=14,How?
b. Confidence level 0.05, How?
c. tn/2= 1.761, How?
Identifying Percentiles Using the t-Distribution Table
Percentiles can be identified using the t-Critical Values Table.
a. If the shaded area on the right is 0.05, what is the area to the
left of t1 ?
b.What does t1 represents?
c. Find the value of t1?
Ex. Sol. A. (1- ) 100%= p
(1-0.05)100= p
0.95(100%)= P
P95% area to the left of t1
b. Hence t1 represents the 95th
percentile t 0.95.
c. t=1.753 How?
8. The graph of t-distribution with 18 df
a.If the total shaded area of the curve is 0.02,
what is the area to the left of t1
b.What does t1 represents?
c.What is the value of t1?
Sol. A. p=0.99, How?
B. t0.99 , How?
C t1= 2.552, How?

T-Distribution General Mathematics .pptx

  • 1.
  • 2.
    Illustrate the T-Distribution What Is a T-Distribution? The t-distribution, also known as the Student’s t-distribution, is a type of probability distribution that is similar to the normal distribution with its bell shape but has heavier tails. It is used for estimating population parameters for small sample sizes or unknown variances. T-distributions have a greater chance for extreme values than normal distributions, and as a result have fatter tails.
  • 3.
    What Does aT-Distribution Tell You? Tail heaviness is determined by a parameter of the t-distribution called degrees of freedom, with smaller values giving heavier tails, and with higher values making the t-distribution resemble a standard normal distribution with a mean of 0 and a standard deviation of 1
  • 7.
    When should youused T-Distribution. You must use the t-distribution table when working problems when the population standard deviation (σ) is not known and the sample size is small (n<30). General Correct Rule: If σ is not known, then using t-distribution is correct. If σ is known, then using the normal distribution is correct.
  • 8.
    Student's t tableis also known as the t table, t- distribution table, t-score table, t-value table, or t-test table. A critical value of t defines the threshold for significance for certain statistical tests and the upper and lower bounds of confidence intervals for certain estimates.
  • 10.
    What are theparts of the T- Distribution: The t distribution table values are critical values of the t distribution. The column header are the t distribution probabilities (alpha). The row names are the degrees of freedom (df). Student t table gives the probability that the absolute t value with a given degrees of freedom lies above the tabulated value.
  • 11.
    What is themood of T- Distribution: The mean of the distribution is equal to 0 for ν > 1 where ν = degrees of freedom, otherwise undefined. The median and mode of the distribution is equal to 0.
  • 12.
    How do youidentify the T-value of a certain percentage using the T-Table? Calculate your T-value by taking the difference between the mean and population mean and dividing it over the standard deviation divided by the degrees of freedom square root.
  • 13.
    T- Distribution formula: Where:= sample mean x ̄ S= standard deviation of the sample mean n= sample size
  • 14.
    To find numberdegrees of freedom: df=n-1 Where: df= degrees of freedom n= sample size
  • 15.
    A student researcherwants to determine whether the mean score in mathematics of 25 students in Grade 8 Section St. Albert is significant different from the school mean of 89. The mean and the standard deviation of the score of the students in section St. Albert are 95 and 15, respectively. Assume a 95% confidence level. Sol. Step 1. Find the degrees of freedom. df=n-1 = 25-1= 24
  • 16.
    Step 2. Findthe critical value. Use the table of t Critical values Confidence level is 95%. ( 1- 100% = 95% 1- = 0.95 = 0.05 Therefore using the Critical values Table the critical vale is 2.064.
  • 17.
    Step 3: Computethe test statistical t. = = 2
  • 18.
    The computed valueof t is equal to 2 which is smaller than the tabulated value of 2.064 The value of the test statistical or computed t value does not fall in the critical region. Therefore, the mean score of grade 8 St. Albert in mathematics is the same with mean score of all the students taking up grade 8 mathematics.
  • 19.
    Example no.2 A studentssuspects that the data she collected for research study do not represent the target population. Here are the data she collected. 16 27 34 20 29 30 22 30 37 25 30 42 26 32 35 The population mean is 27. Assuming normality in the target population is the student's suspicion correct? Use a 90% confidence level.
  • 20.
    Observation x X-x ̄(X- )^2 x ̄ 1 16 16-29=-13 169 2 20 20-29=-9 81 3 22 22-29=-7 49 4 25 25-29=-4 16 5 26 26-29=-3 9 6 27 27-29=-2 4 7 29 20-29=0 0 8 30 30-29=1 1 9 30 30-29=1 1 10 32 32-29=3 9 11 34 34-29=5 25 12 30 30-29=1 1 13 37 37-29=8 64 14 42 42-29=13 169 15 35 35-29=6 36 ^2= 634
  • 21.
    = x/n =435/15 = 29 x ̄ S^2 = 634/ 15-1 = 45.29 s== 6.73 Step 2. Find the degree of freedom. df=n-1 = 15-1 = 14 Step 3. Find the critical value. Confidence level is 90% ( 1- 100% = 90% 1- = 0.90 = 0.10
  • 22.
    Step 4. Computethe test statistical t. Ans. 1.151, How? The value of the test statistical is less than the tabular value of 1.761. Therefore, the students is wrong in suspecting that the data are not representation of the target population.
  • 23.
    Example n0.3 Asample of size n= 20 is a simple random sample selected from a normally distributed population. Find the value of t such that the shaded area to the left of t is 0.05. a.Find the degrees of freedom df. Ans. 19, How? b. t= 1.729, How?
  • 24.
    No. 4. Supposeyou have a sample of size n= 12 from a normal distribution. Find the critical value of 7 that corresponds to a 95% confidence level. a.Find the degrees of freedom df df=n-1 Ans. 11, How b. confidence level of 95% Ans. 0.025, How? c. tn/2= 2.025
  • 25.
    5. For at- distribution with 25 degrees of freedom, find the values of t such that the area of to the right of t is 0.05. Sol. A. degrees of freedom df= 25, How tn/2= 1.708 6. For a t-distribution with 14 of freedom, find the value of t such that area between –t and t is 0.90. Sol. A. df=14,How? b. Confidence level 0.05, How? c. tn/2= 1.761, How?
  • 26.
    Identifying Percentiles Usingthe t-Distribution Table Percentiles can be identified using the t-Critical Values Table. a. If the shaded area on the right is 0.05, what is the area to the left of t1 ? b.What does t1 represents? c. Find the value of t1? Ex. Sol. A. (1- ) 100%= p (1-0.05)100= p 0.95(100%)= P P95% area to the left of t1 b. Hence t1 represents the 95th percentile t 0.95. c. t=1.753 How?
  • 27.
    8. The graphof t-distribution with 18 df a.If the total shaded area of the curve is 0.02, what is the area to the left of t1 b.What does t1 represents? c.What is the value of t1? Sol. A. p=0.99, How? B. t0.99 , How? C t1= 2.552, How?