Download as PDF, PPTX
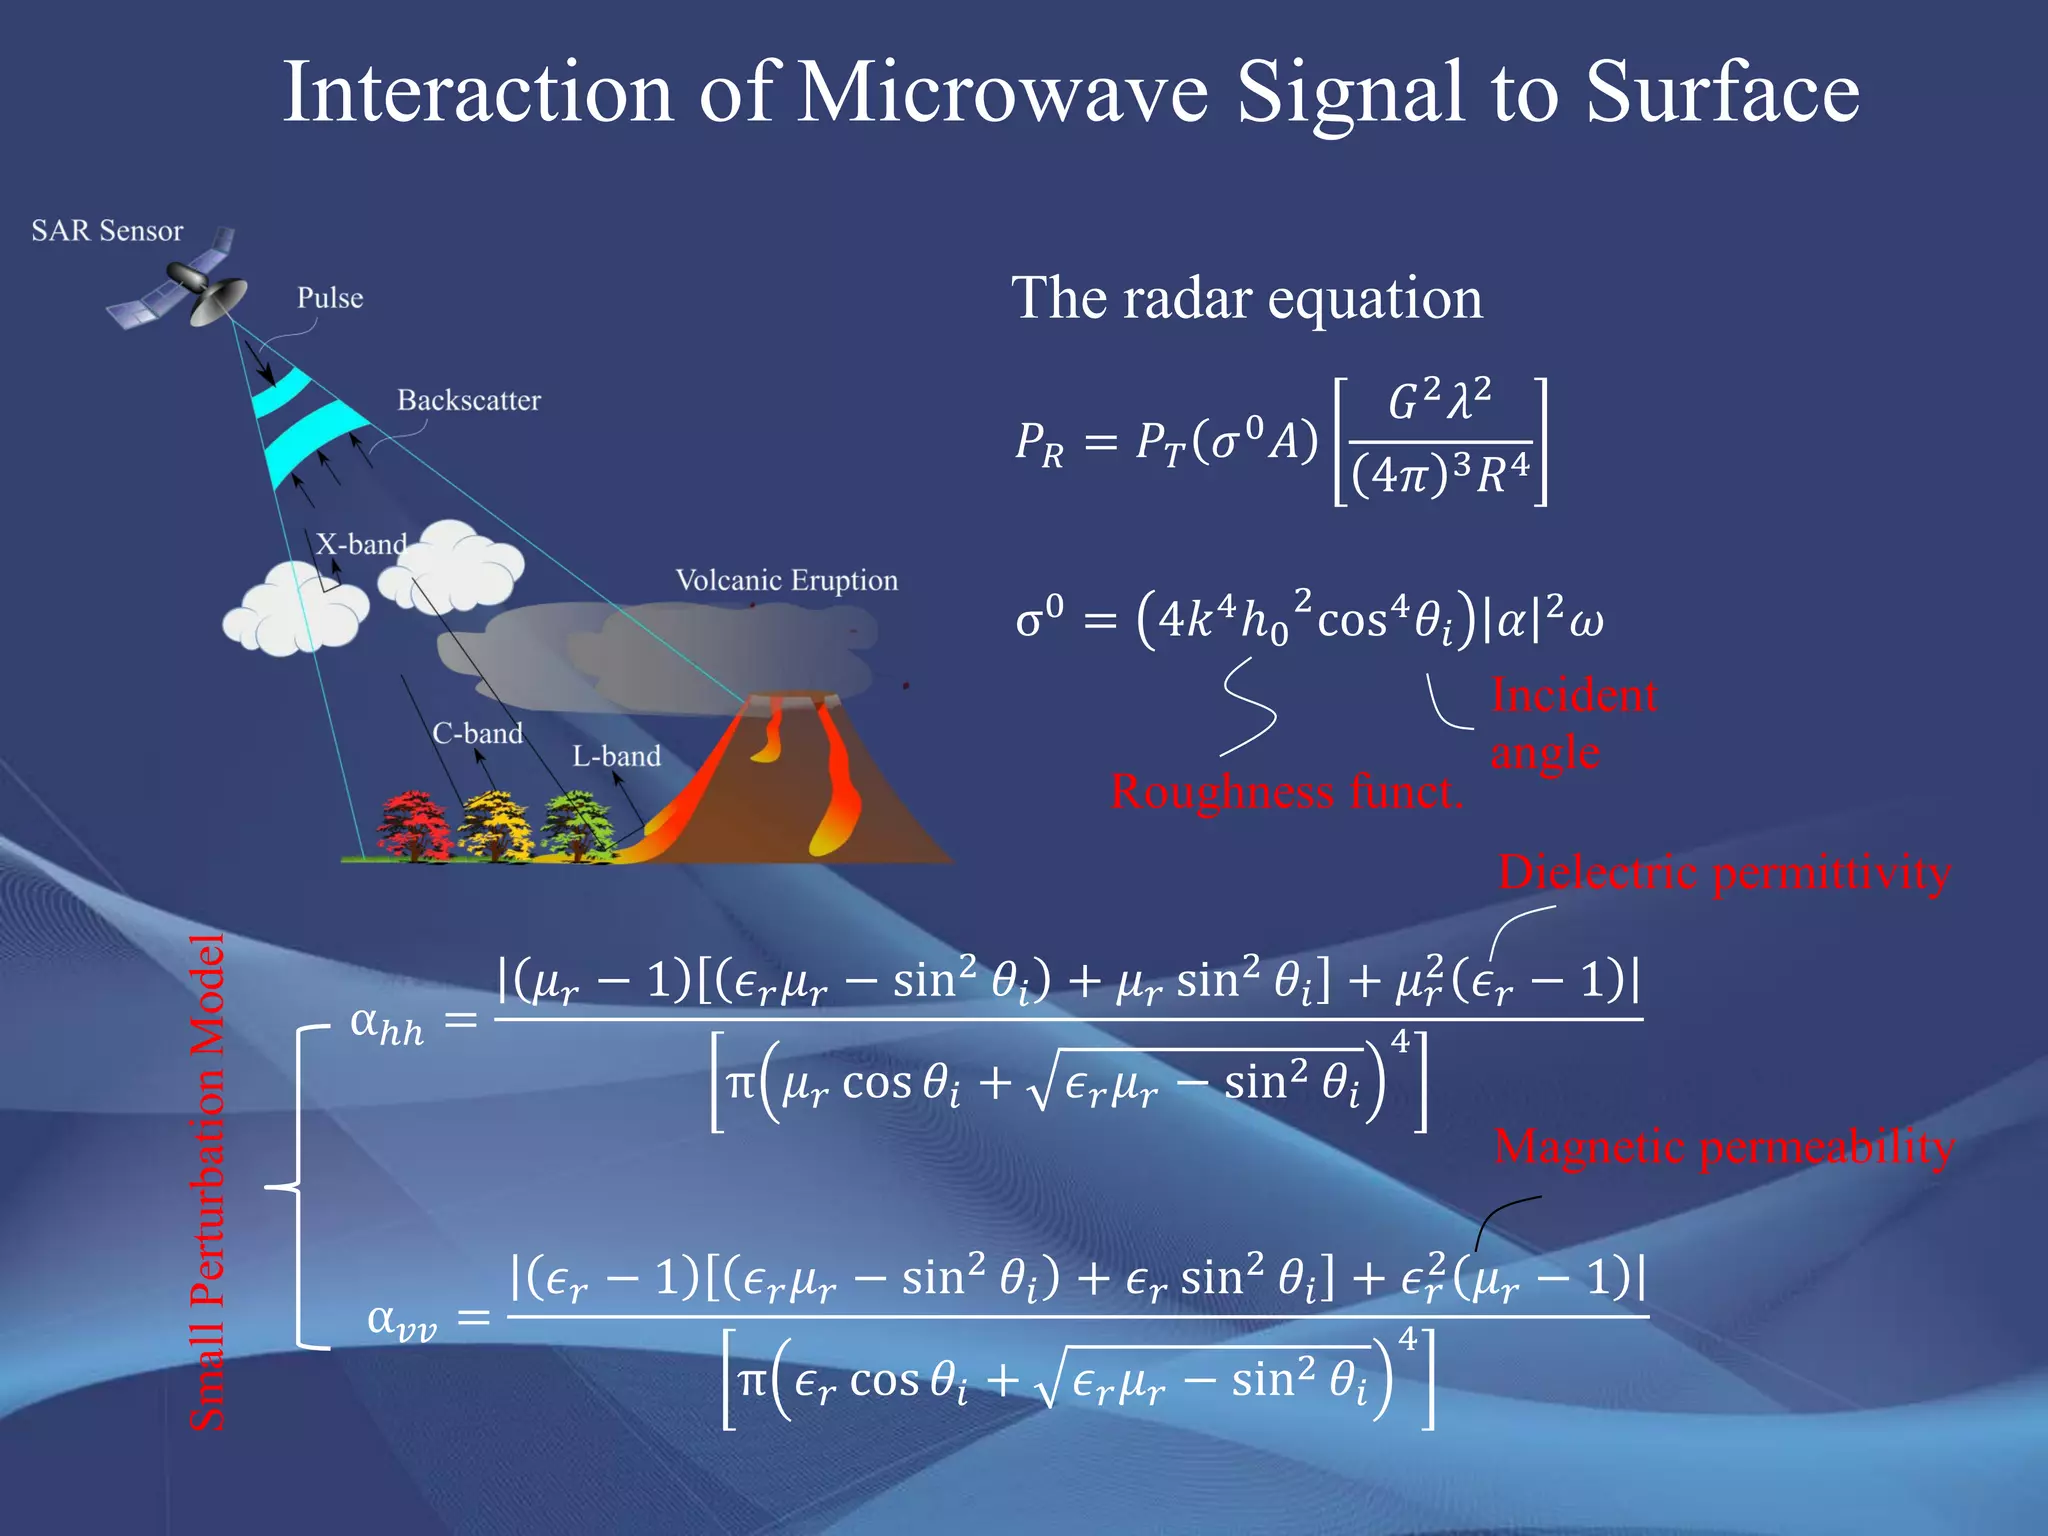
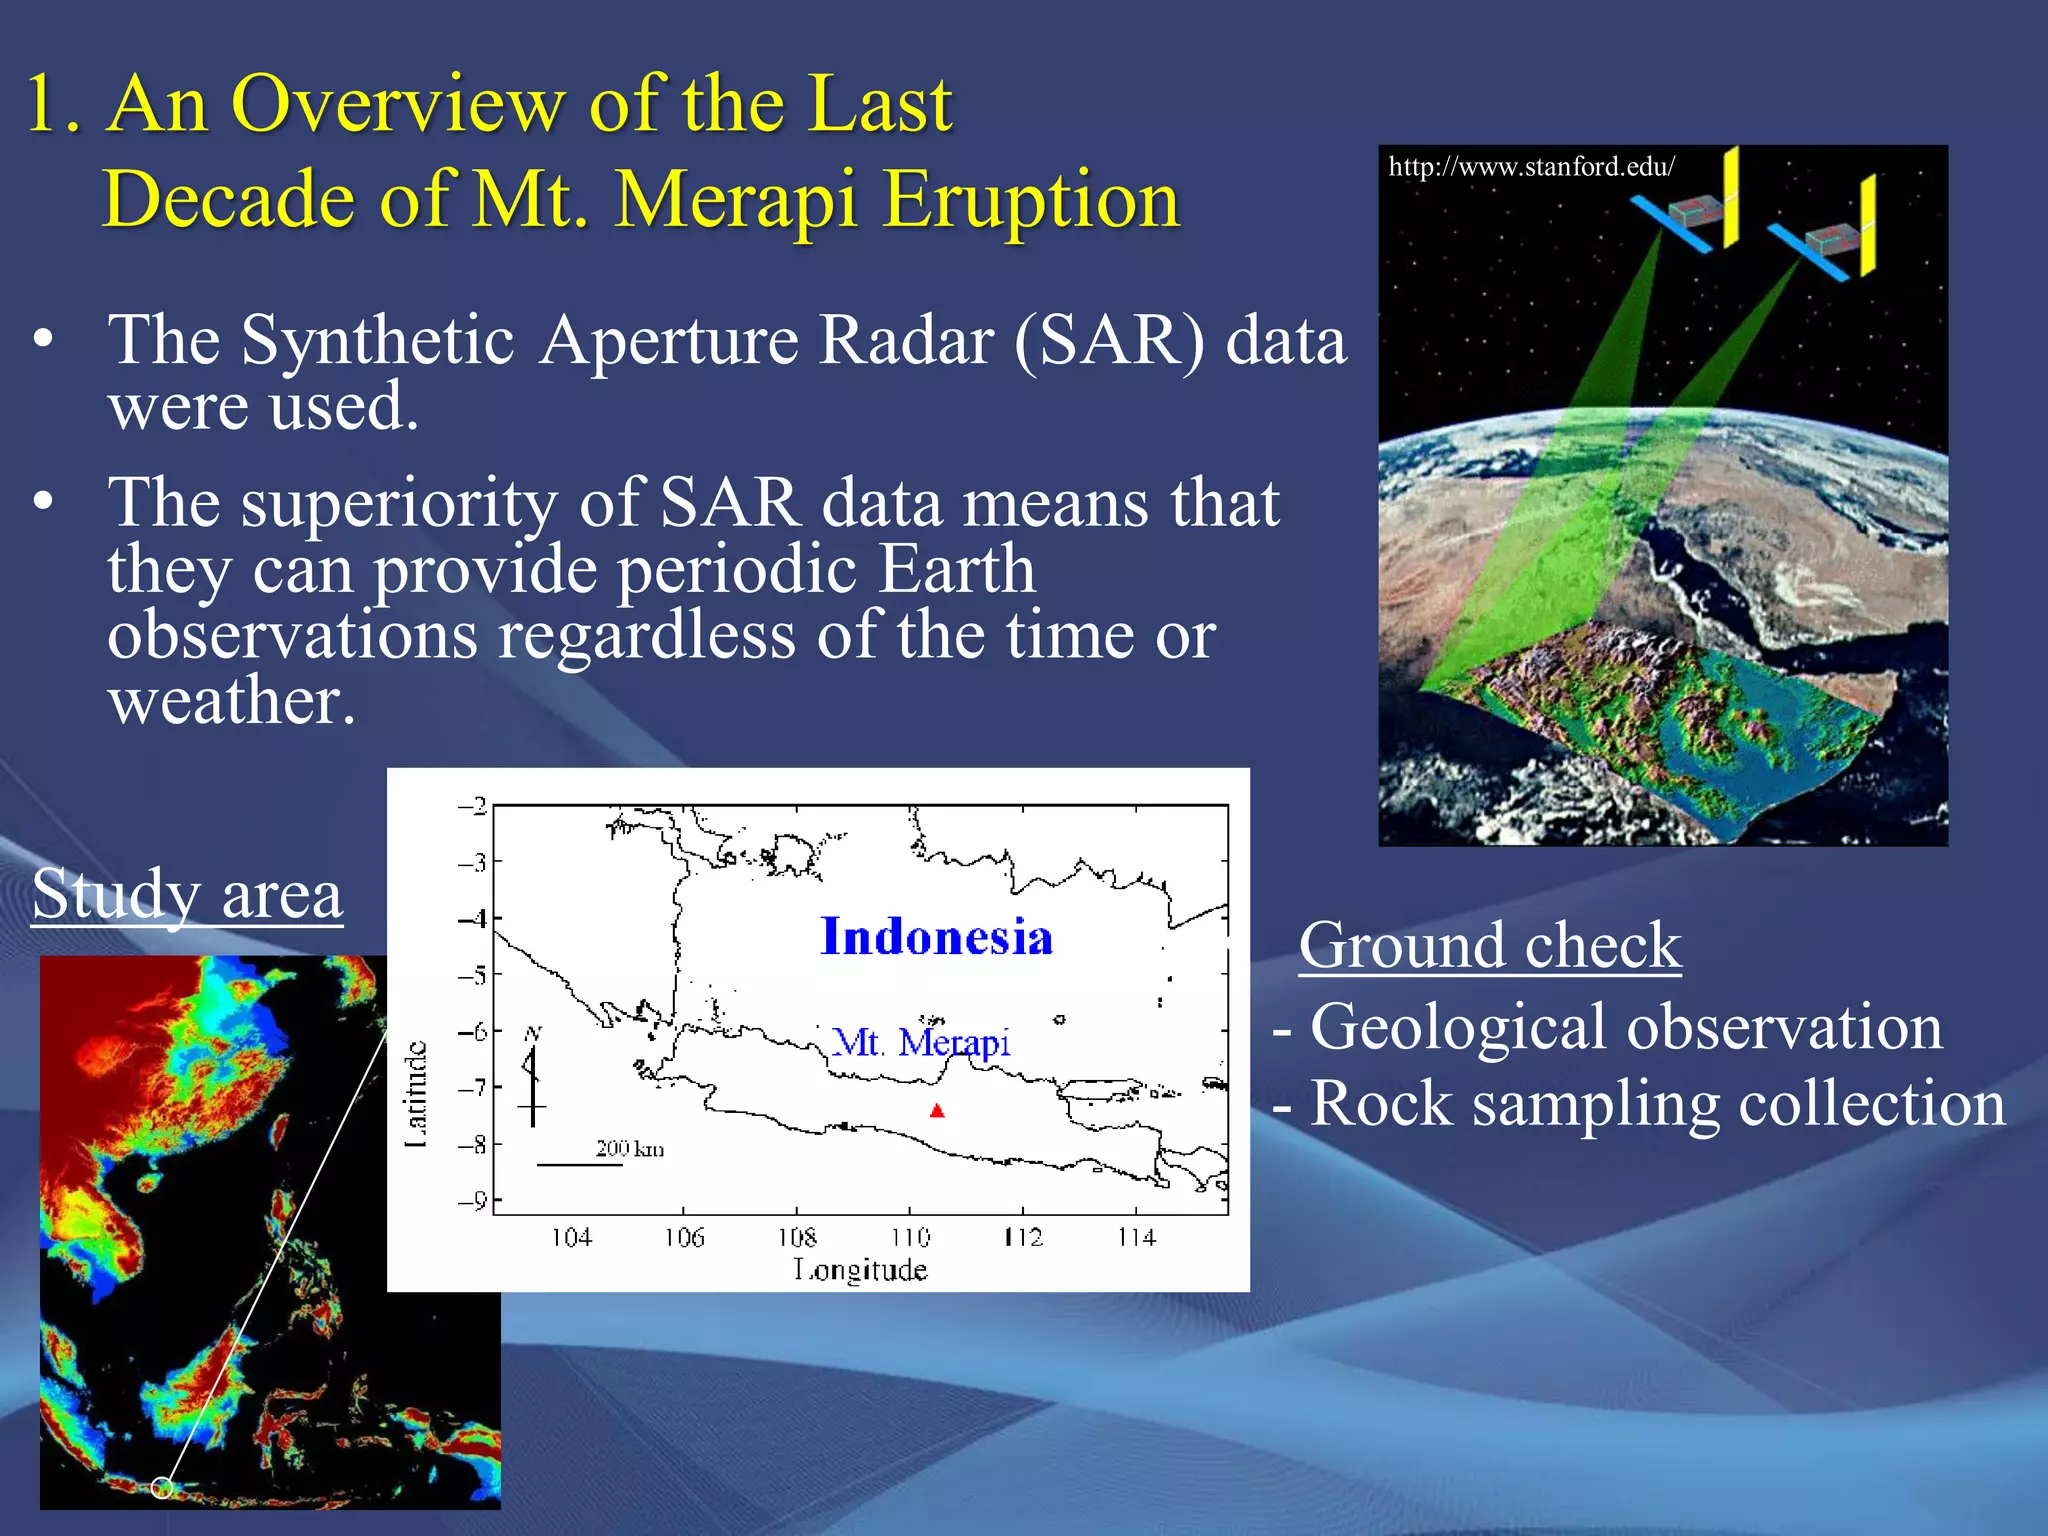
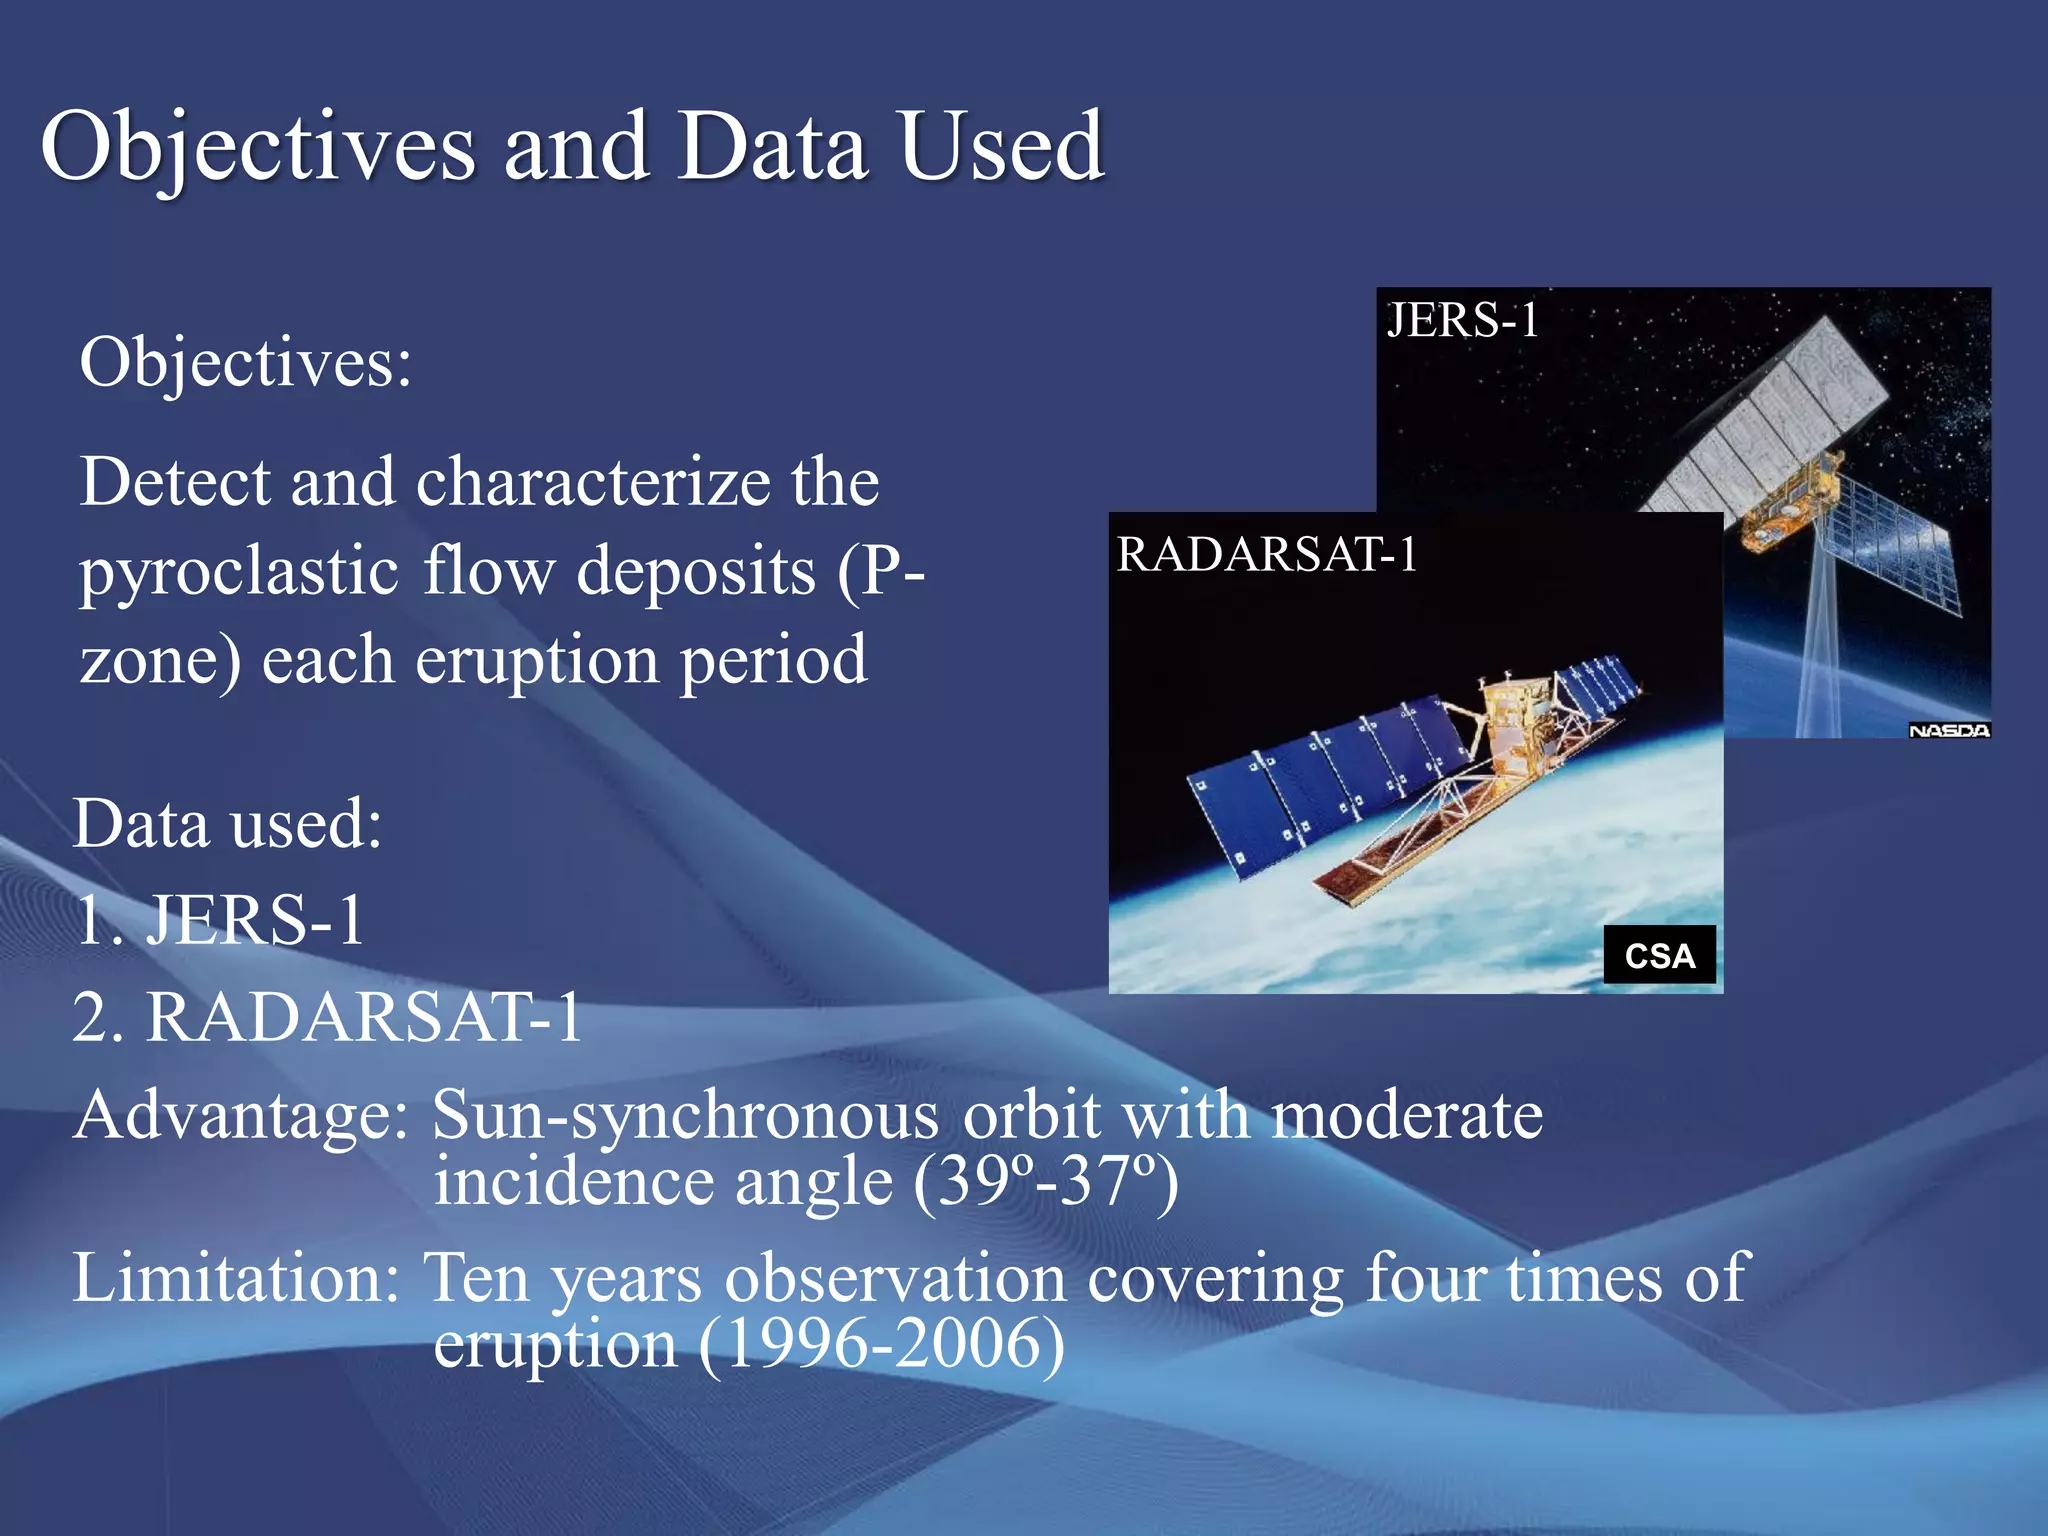
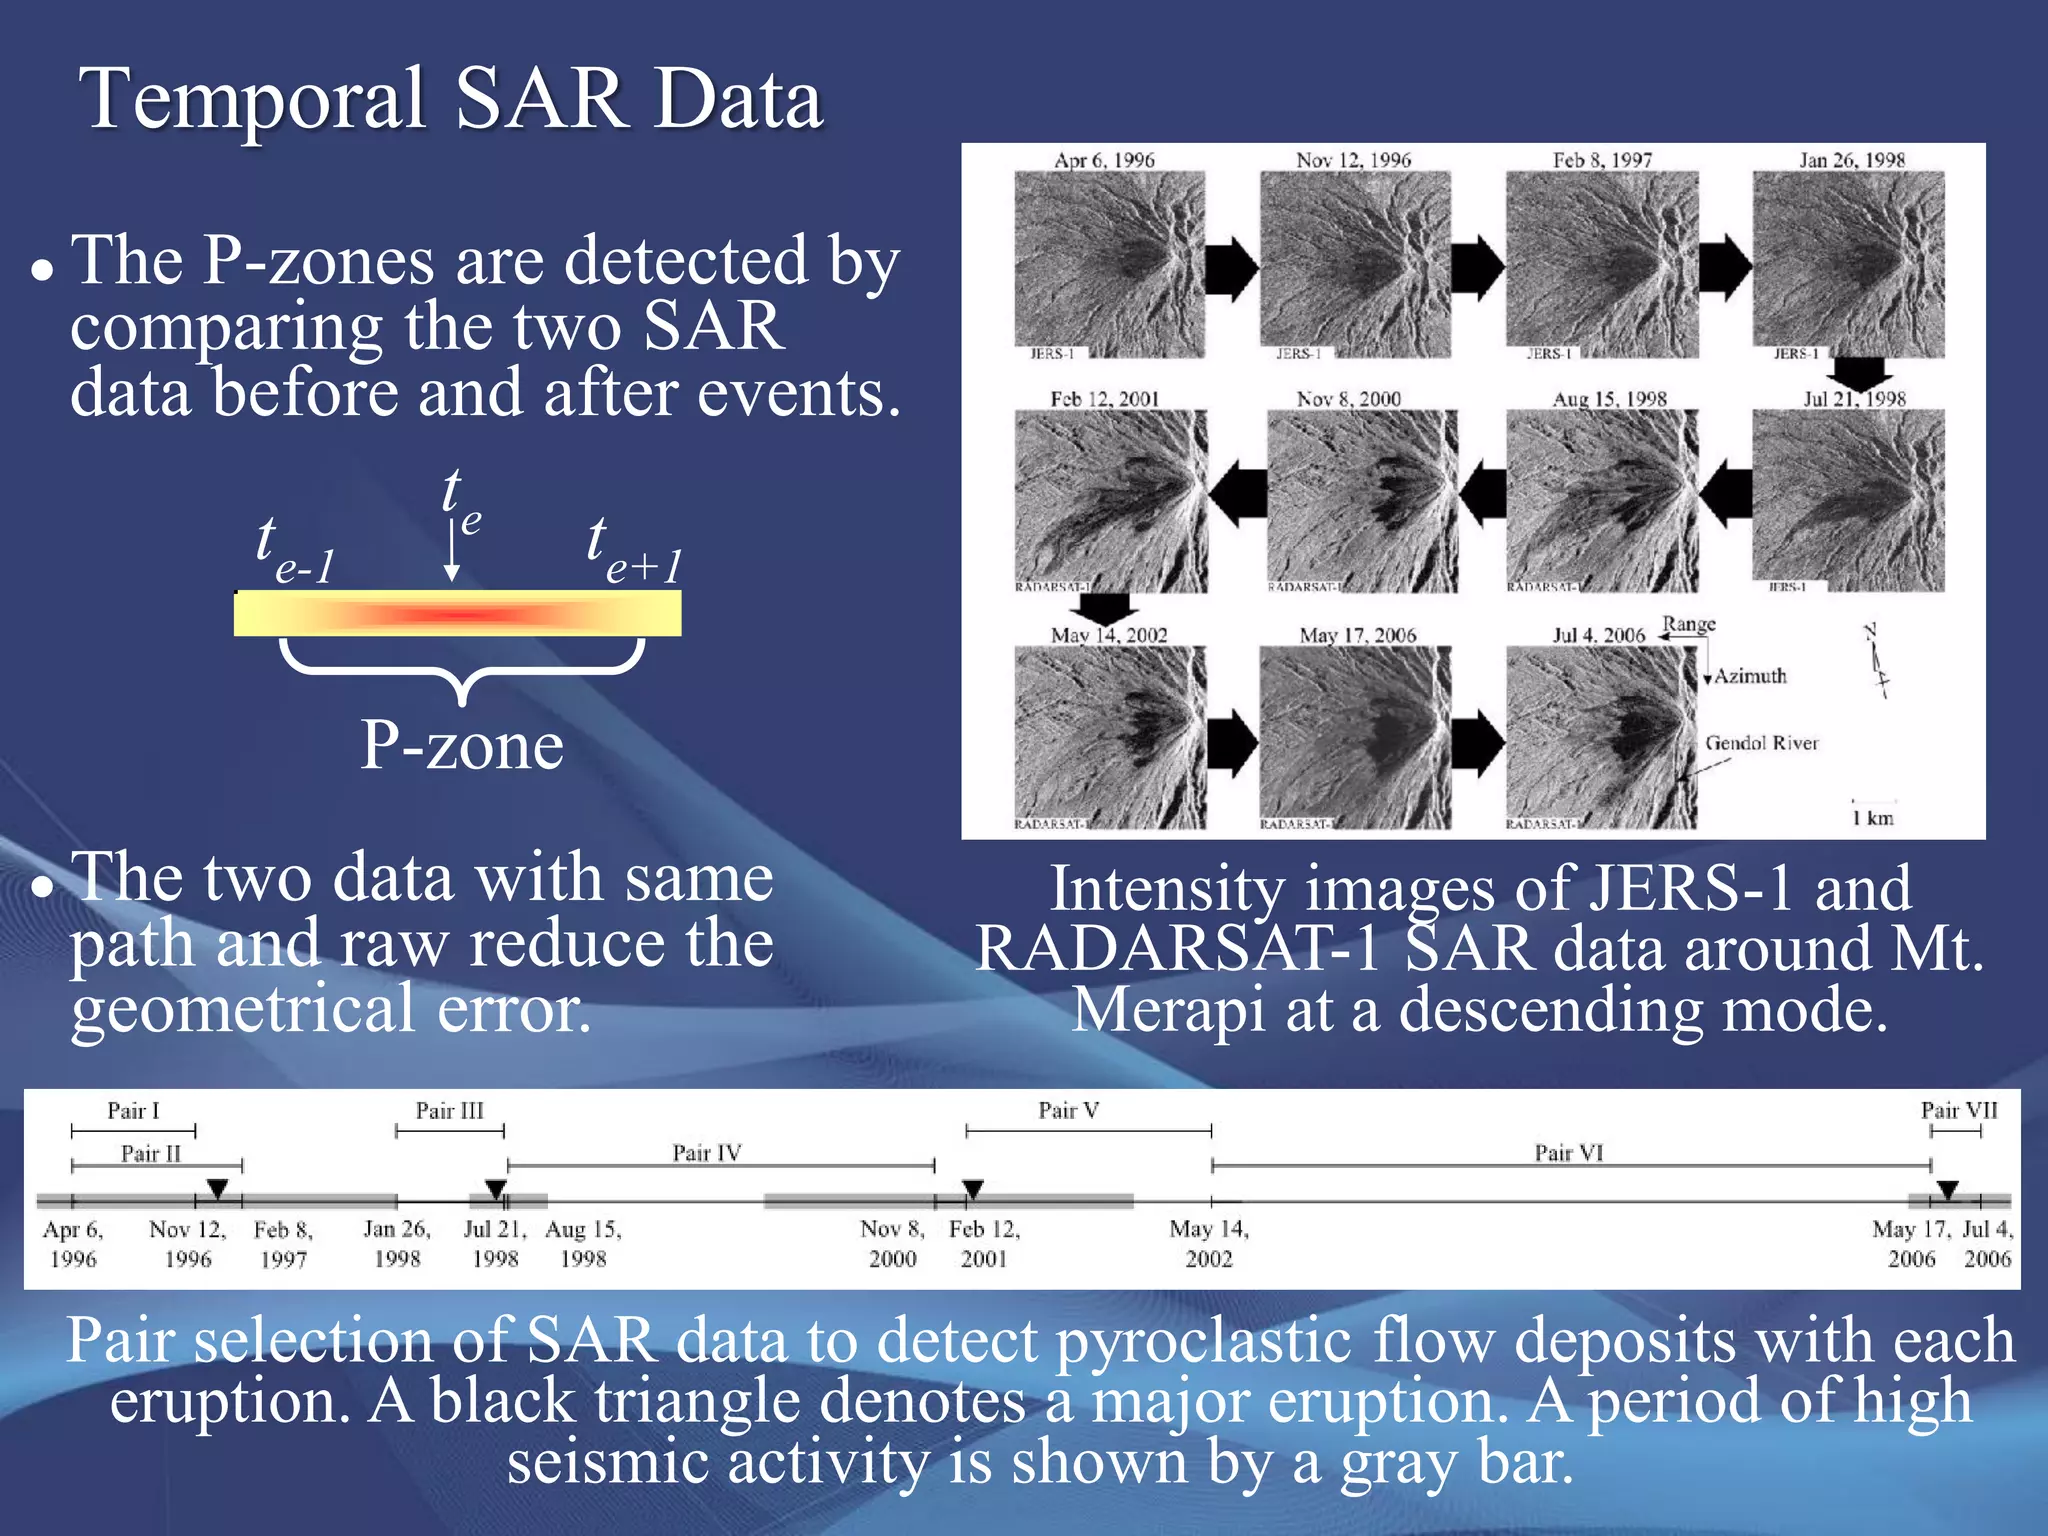
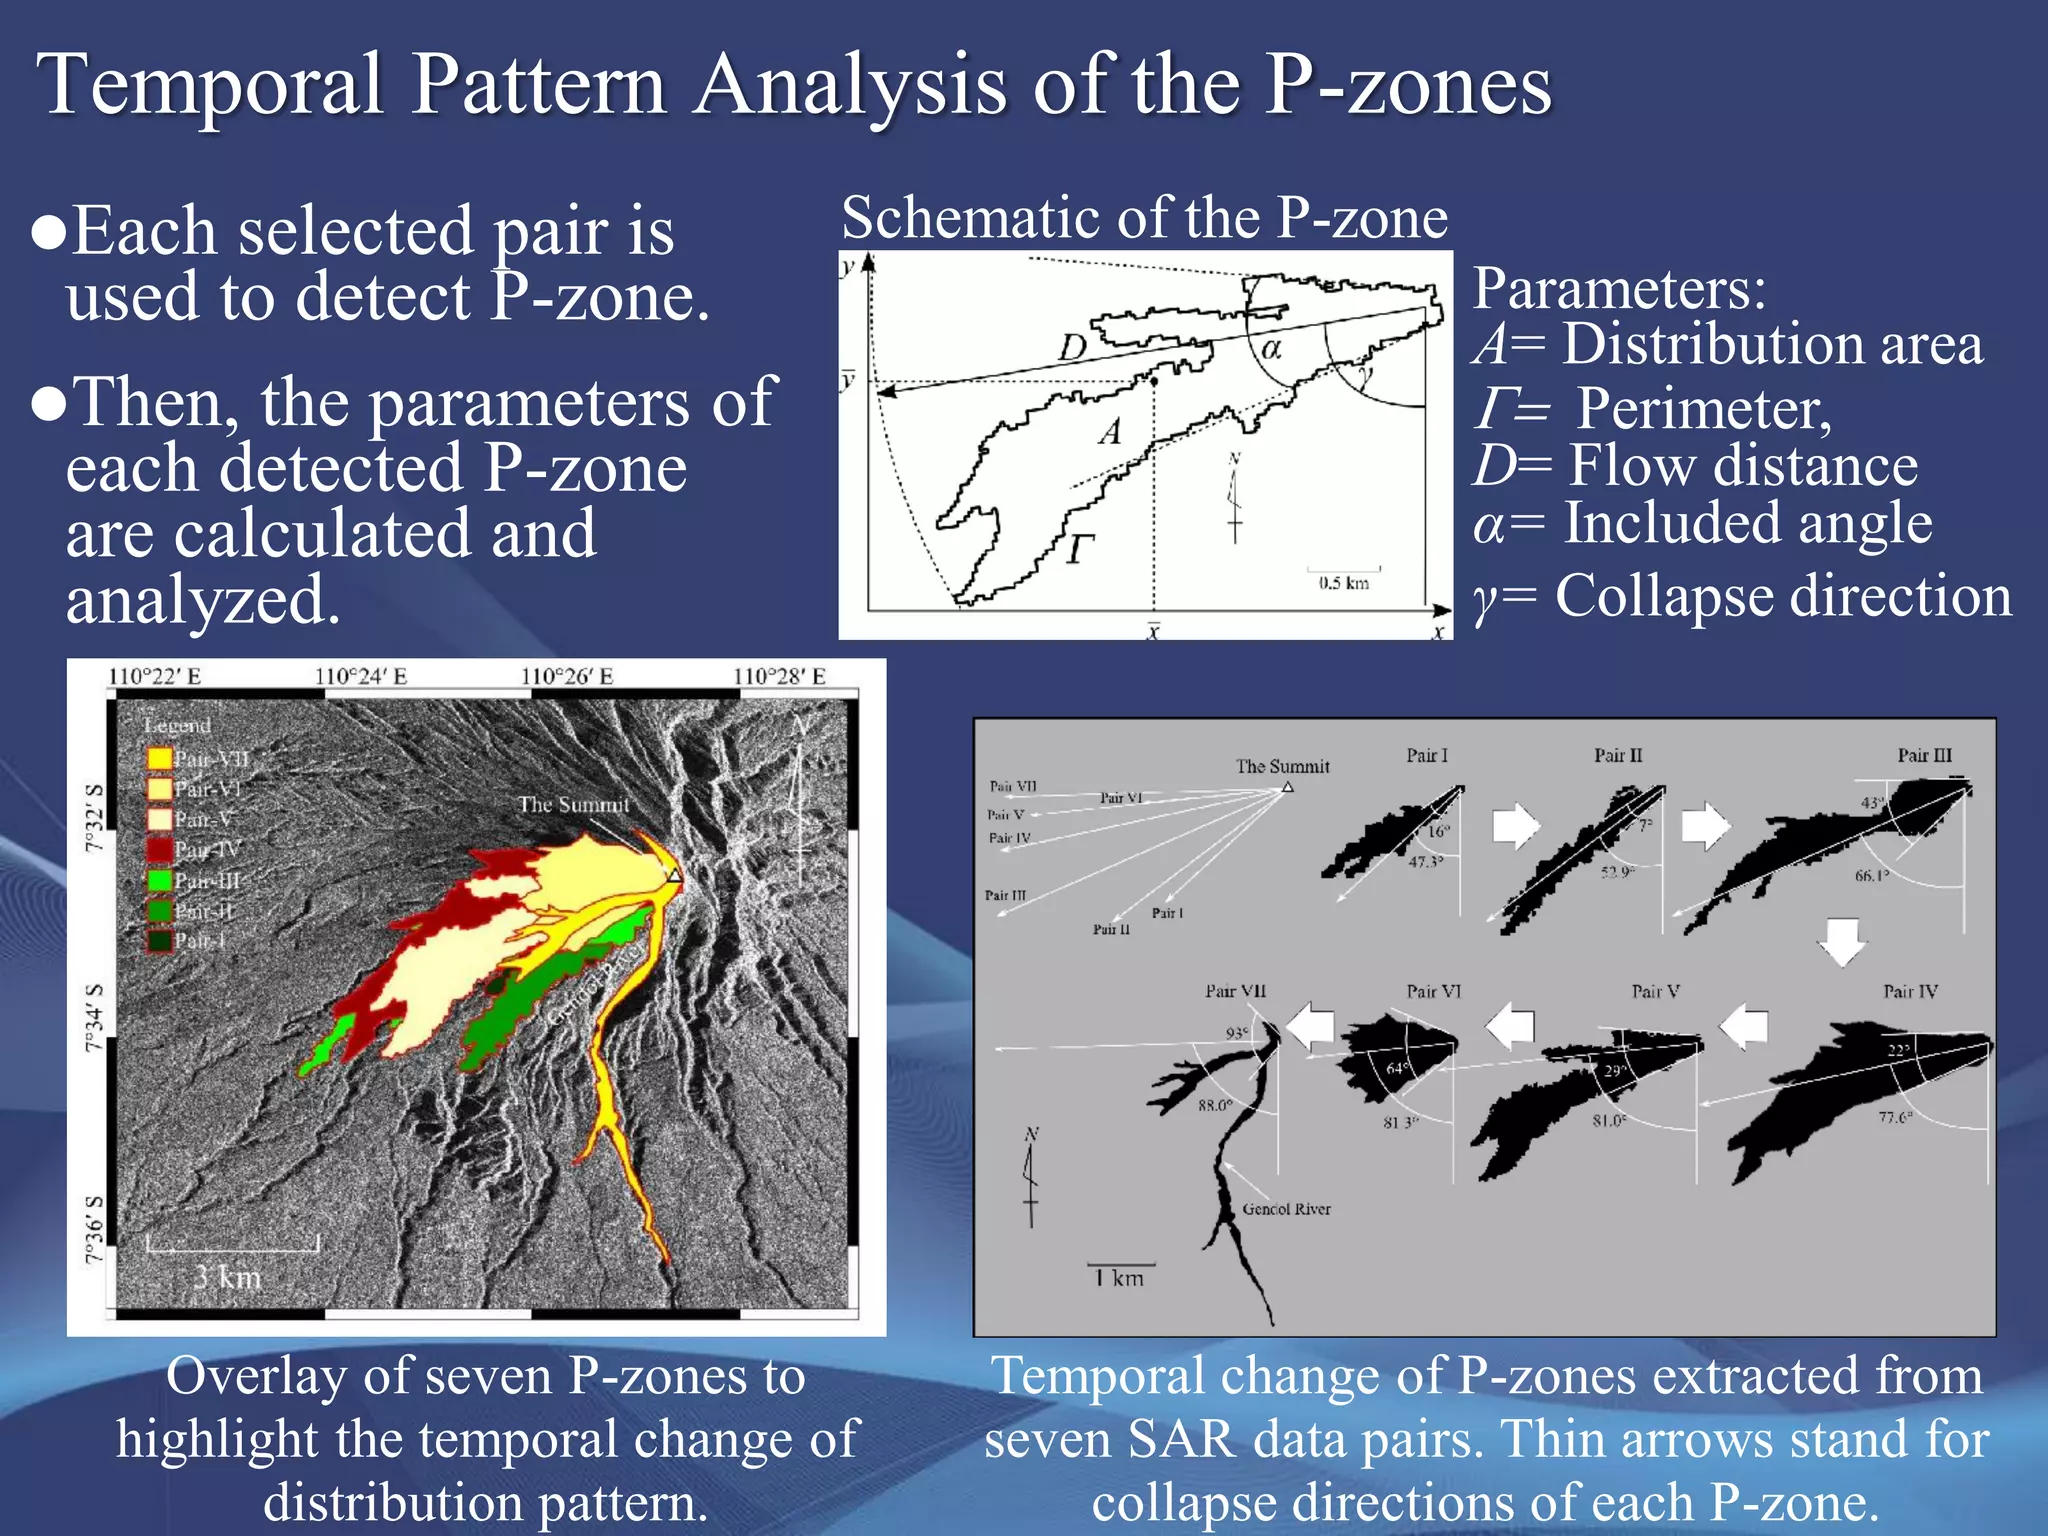
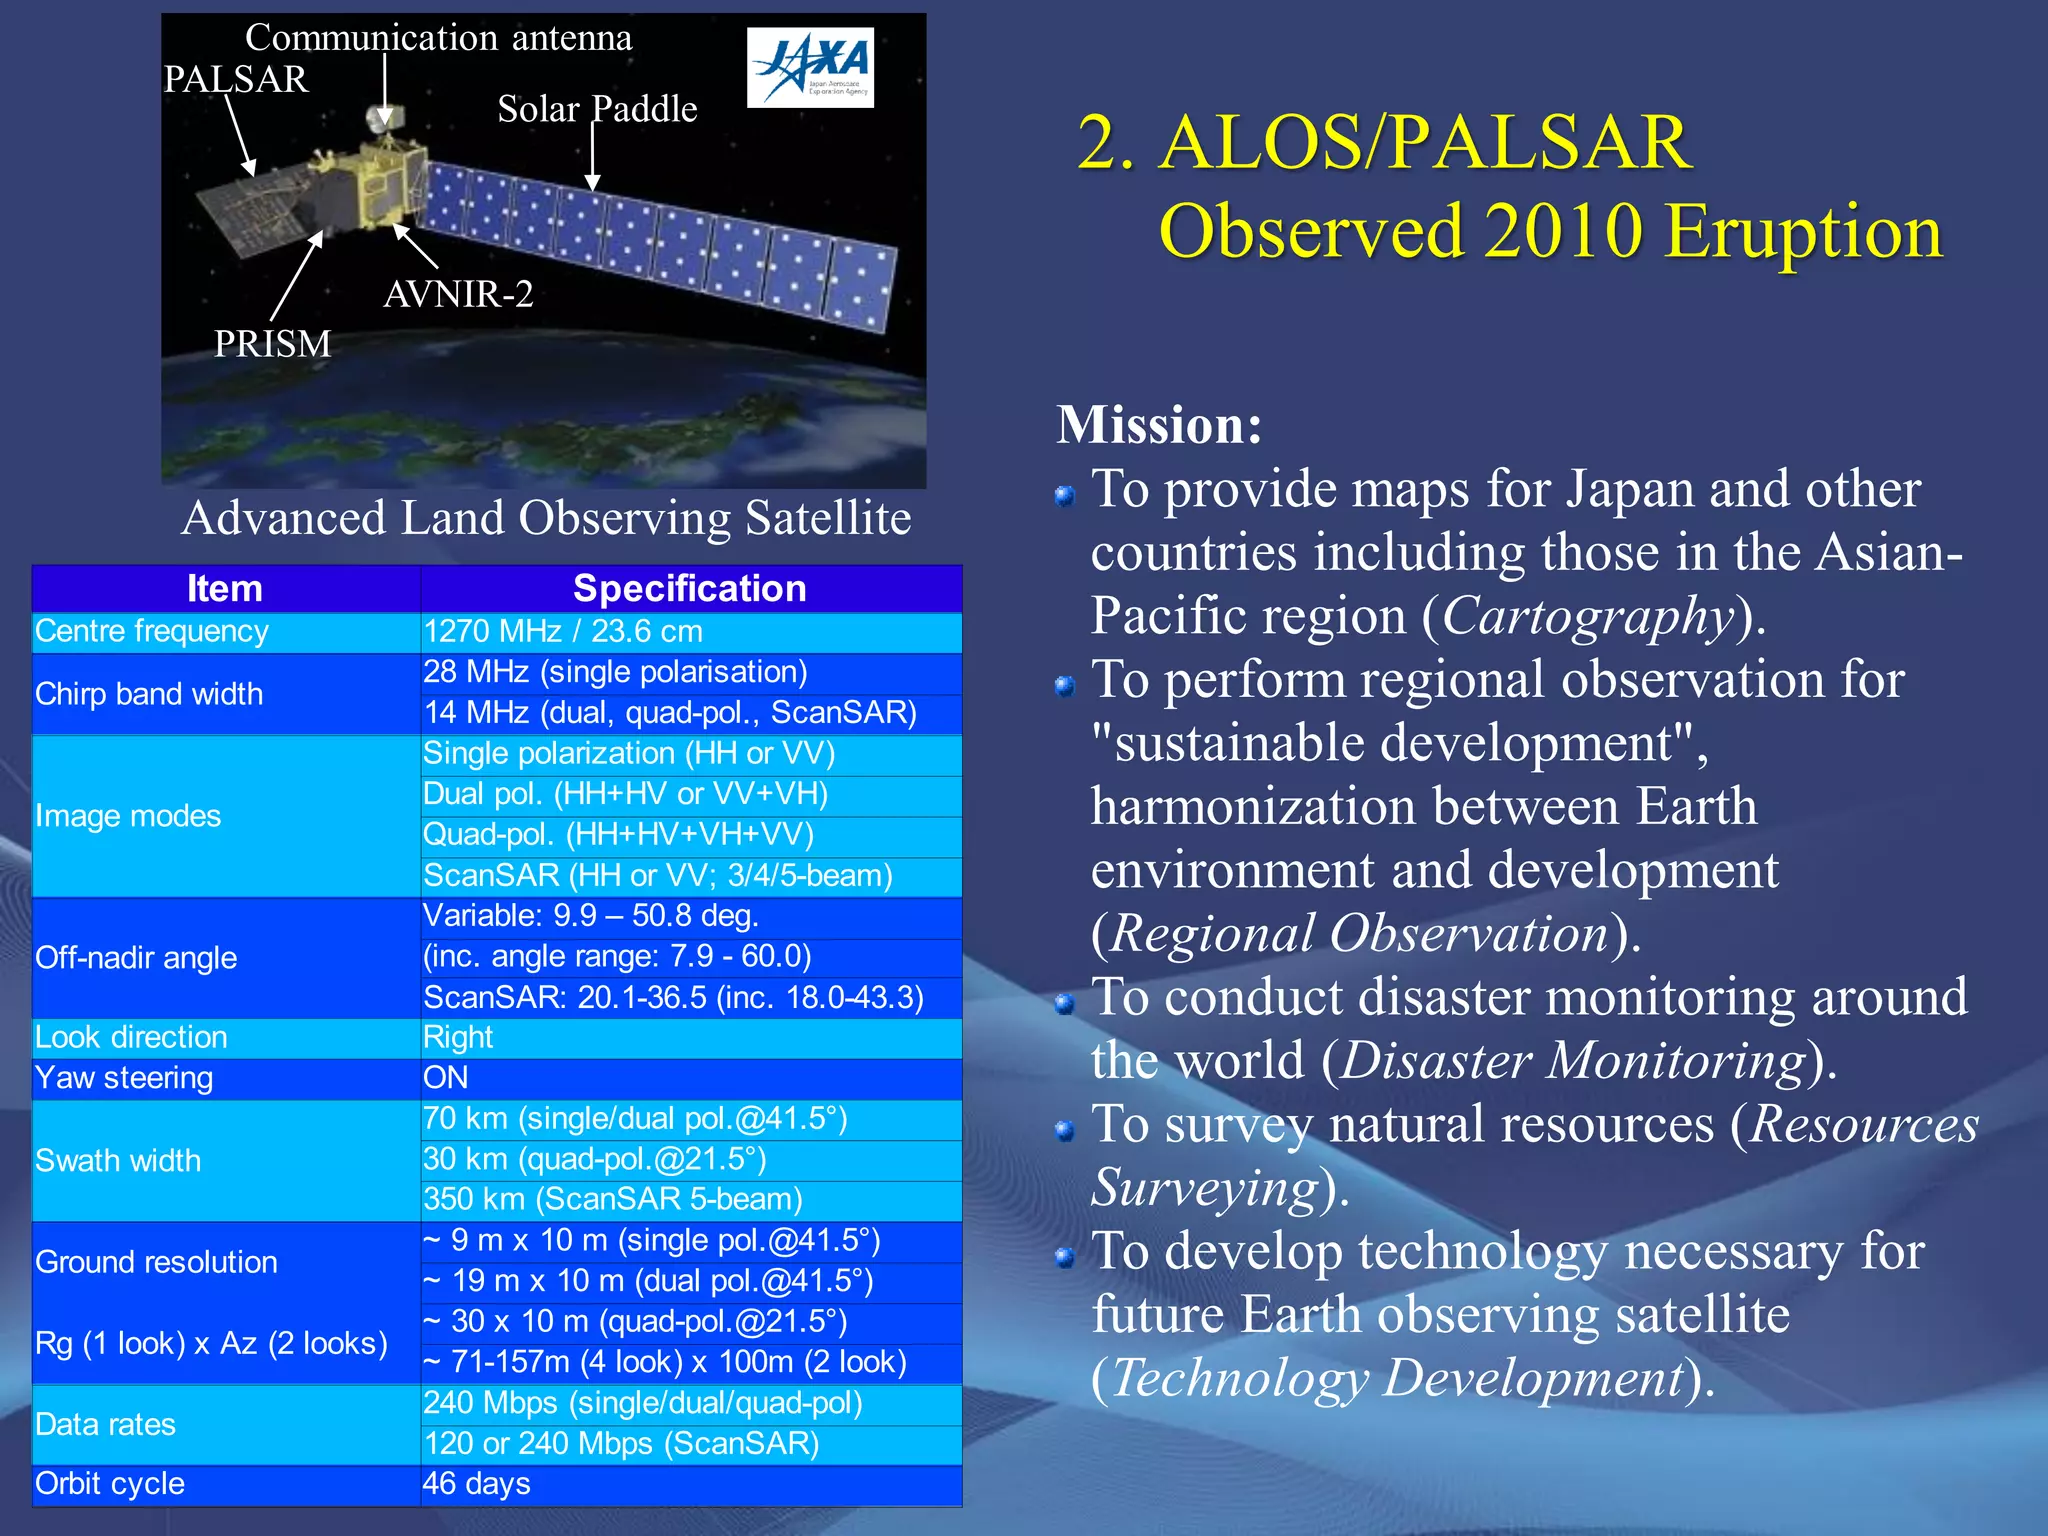
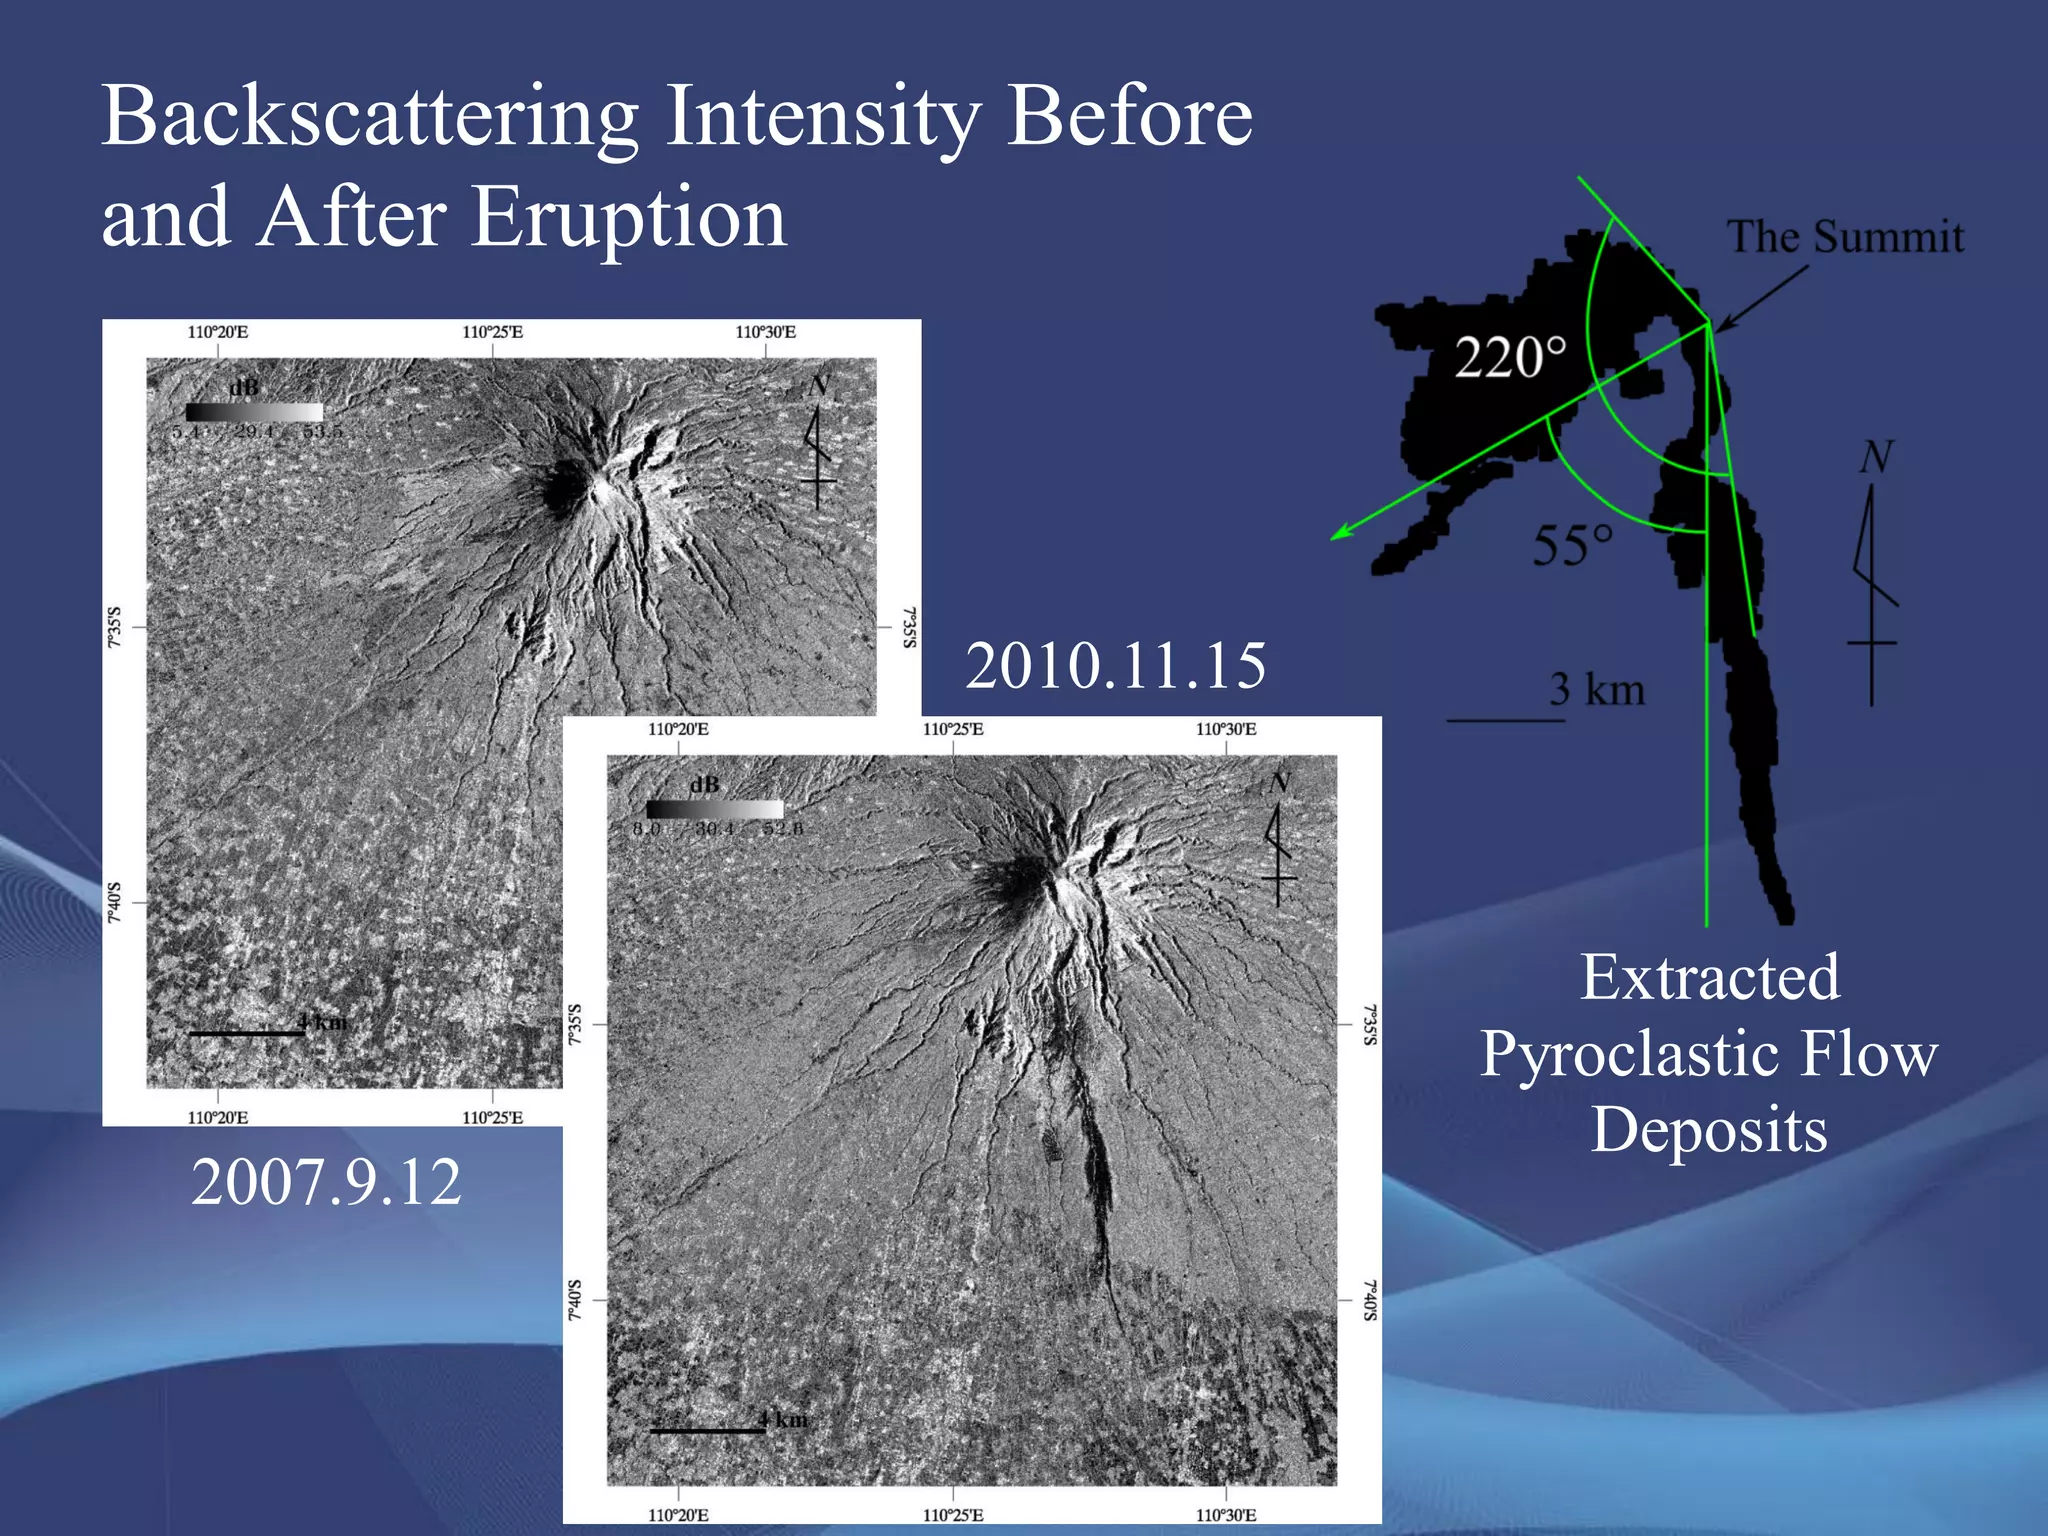
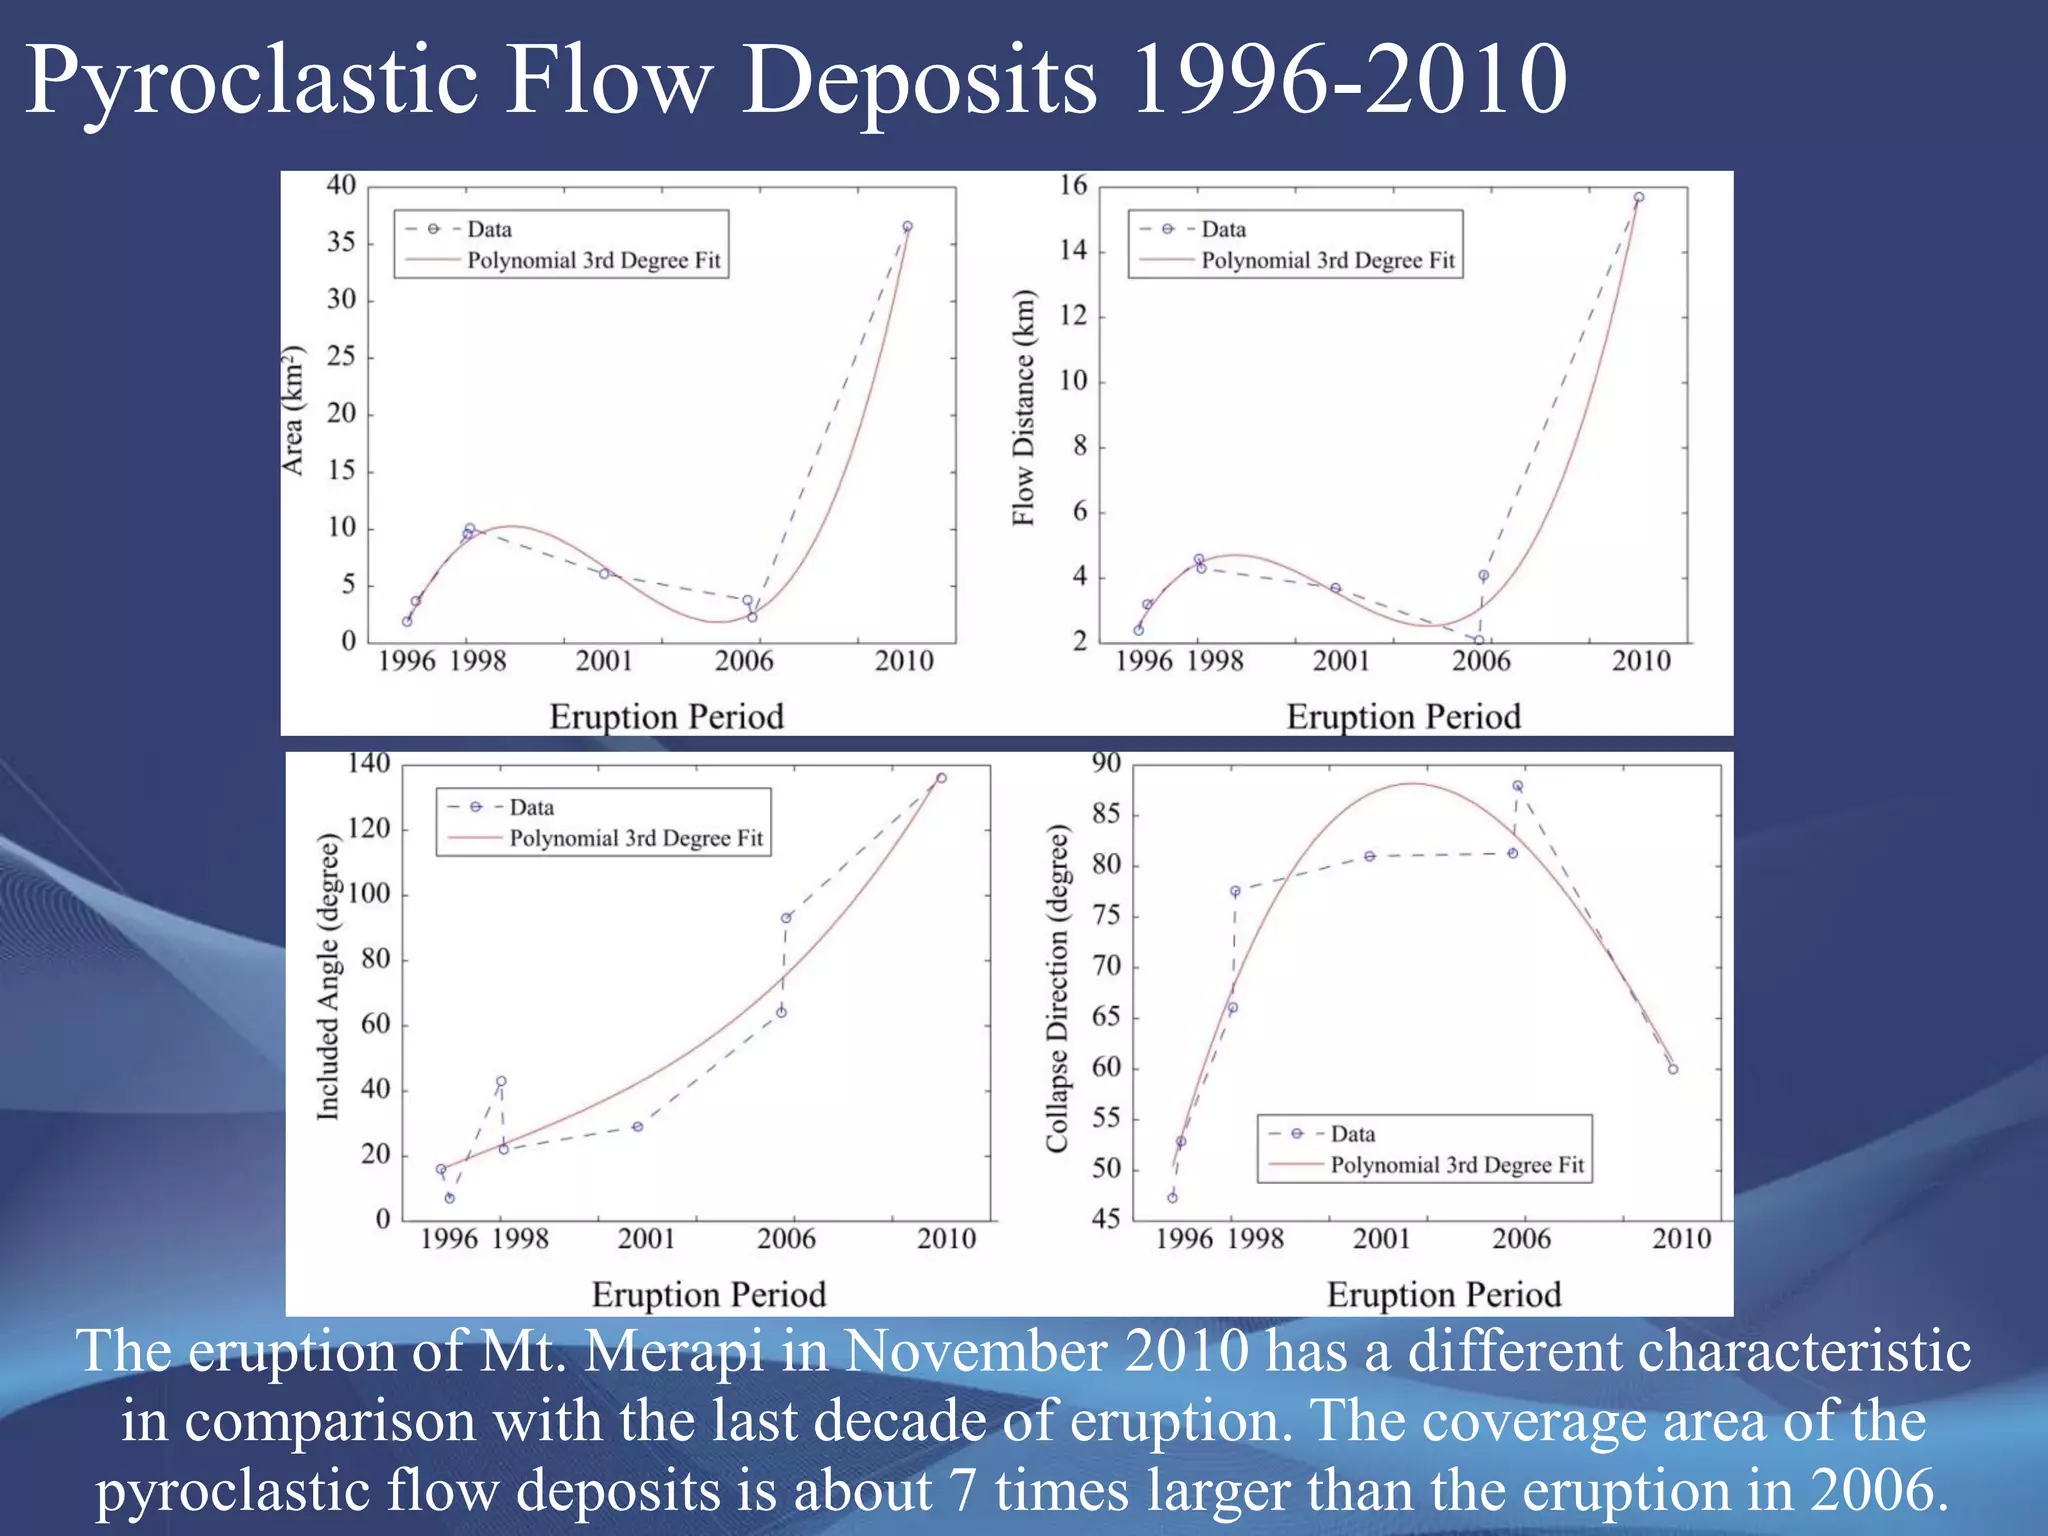
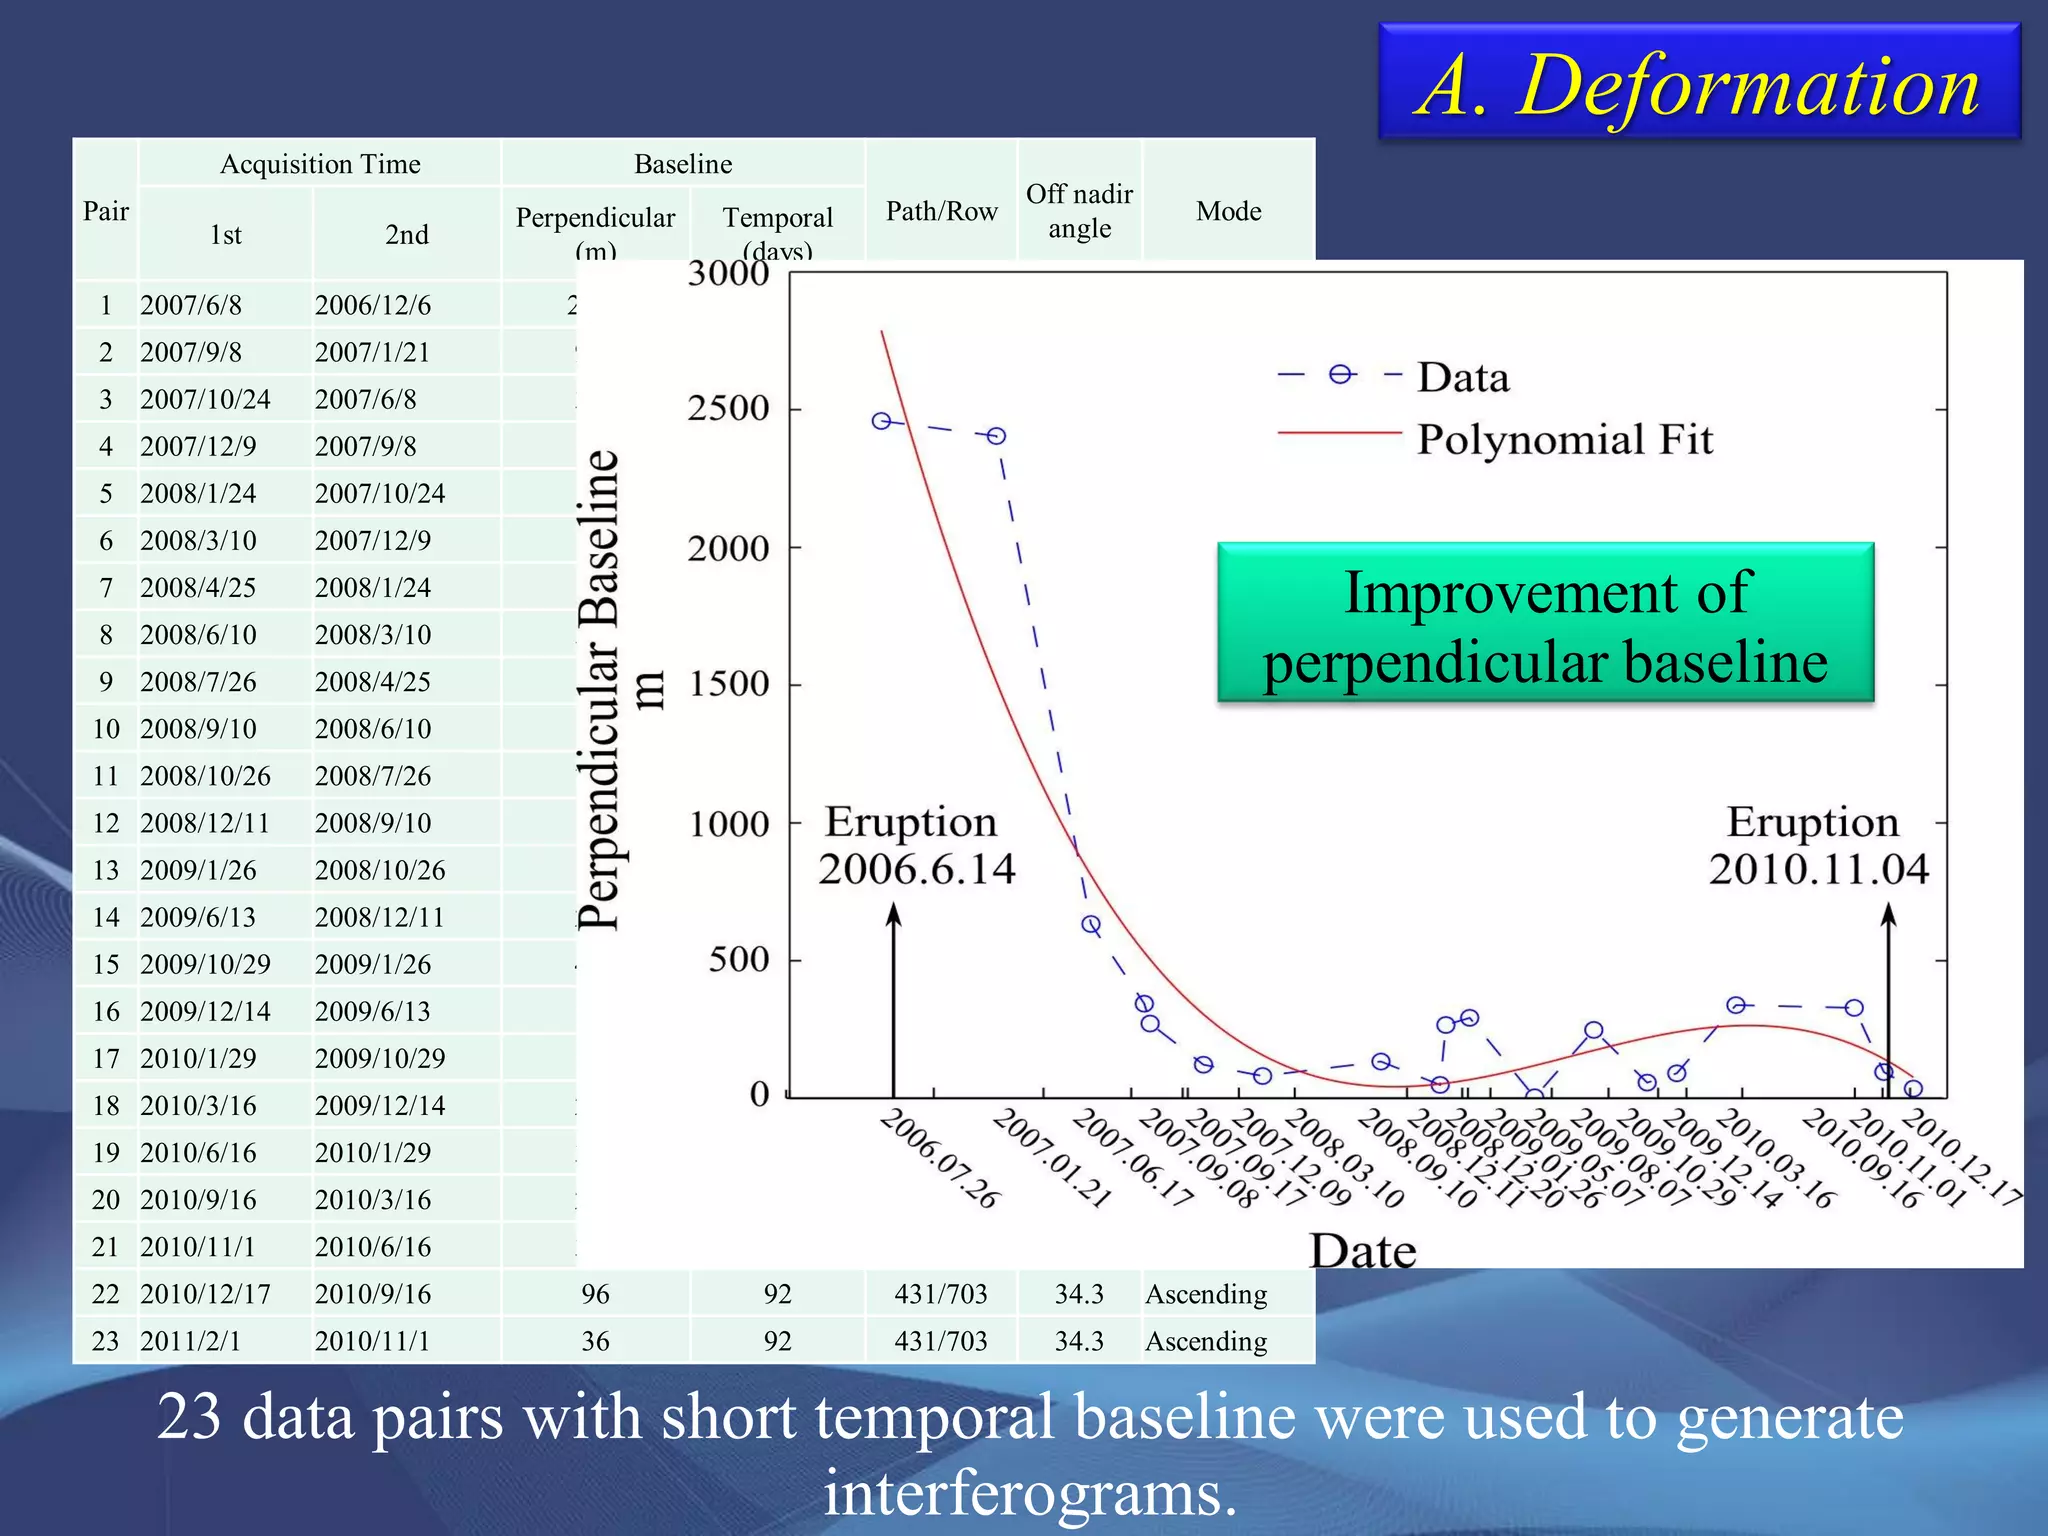
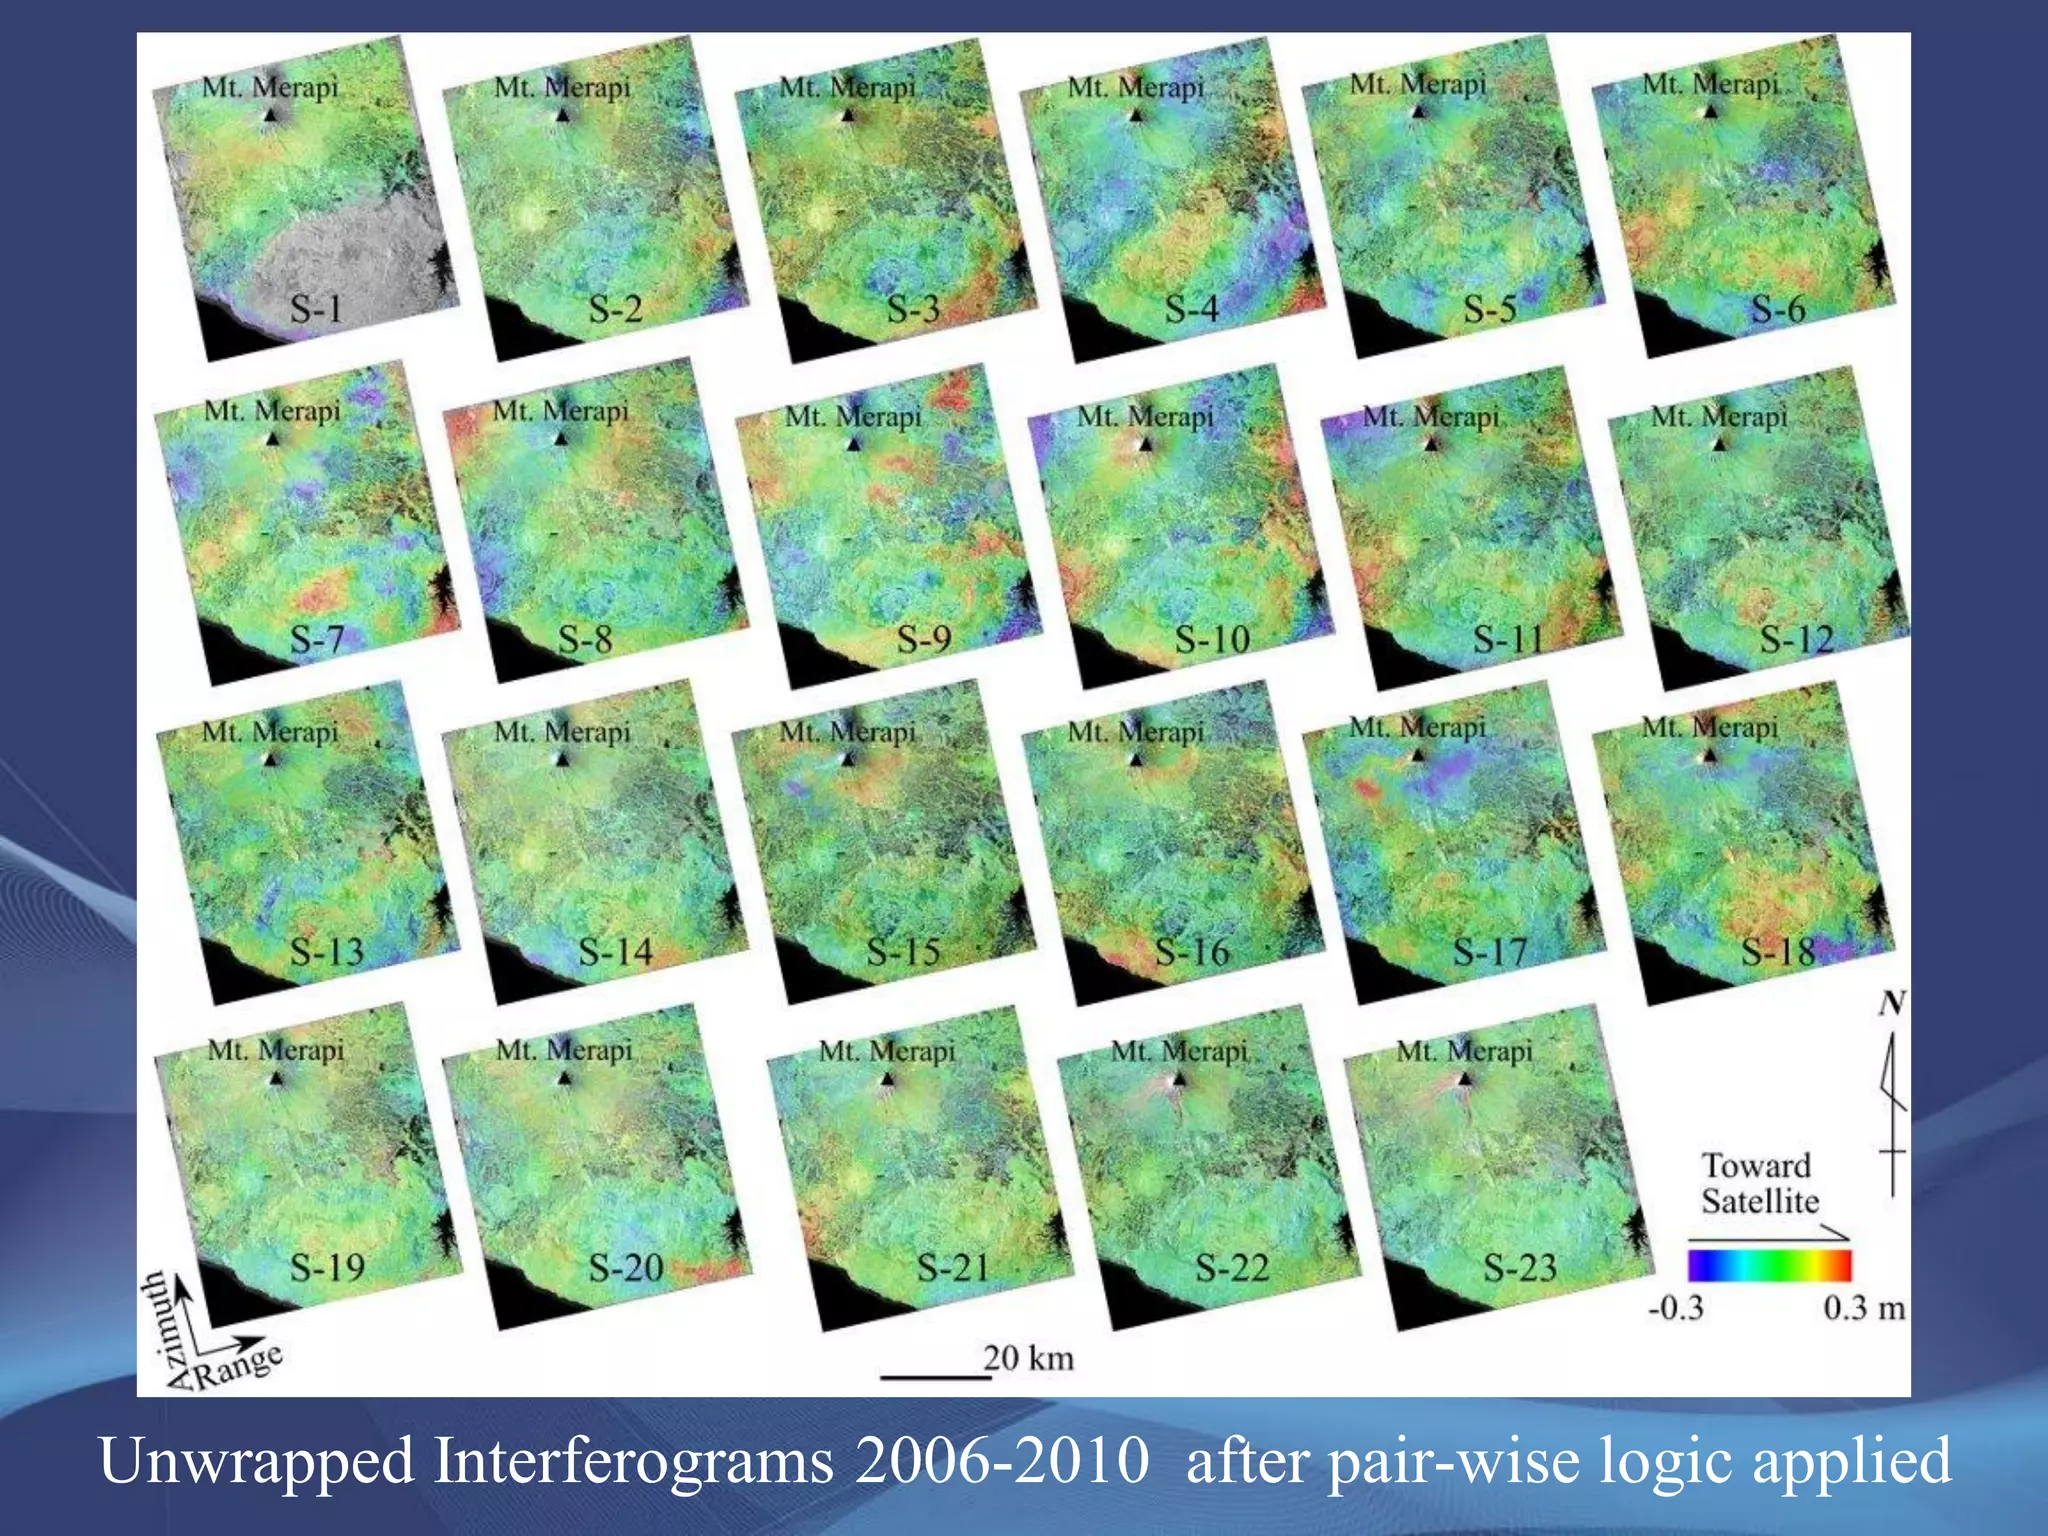
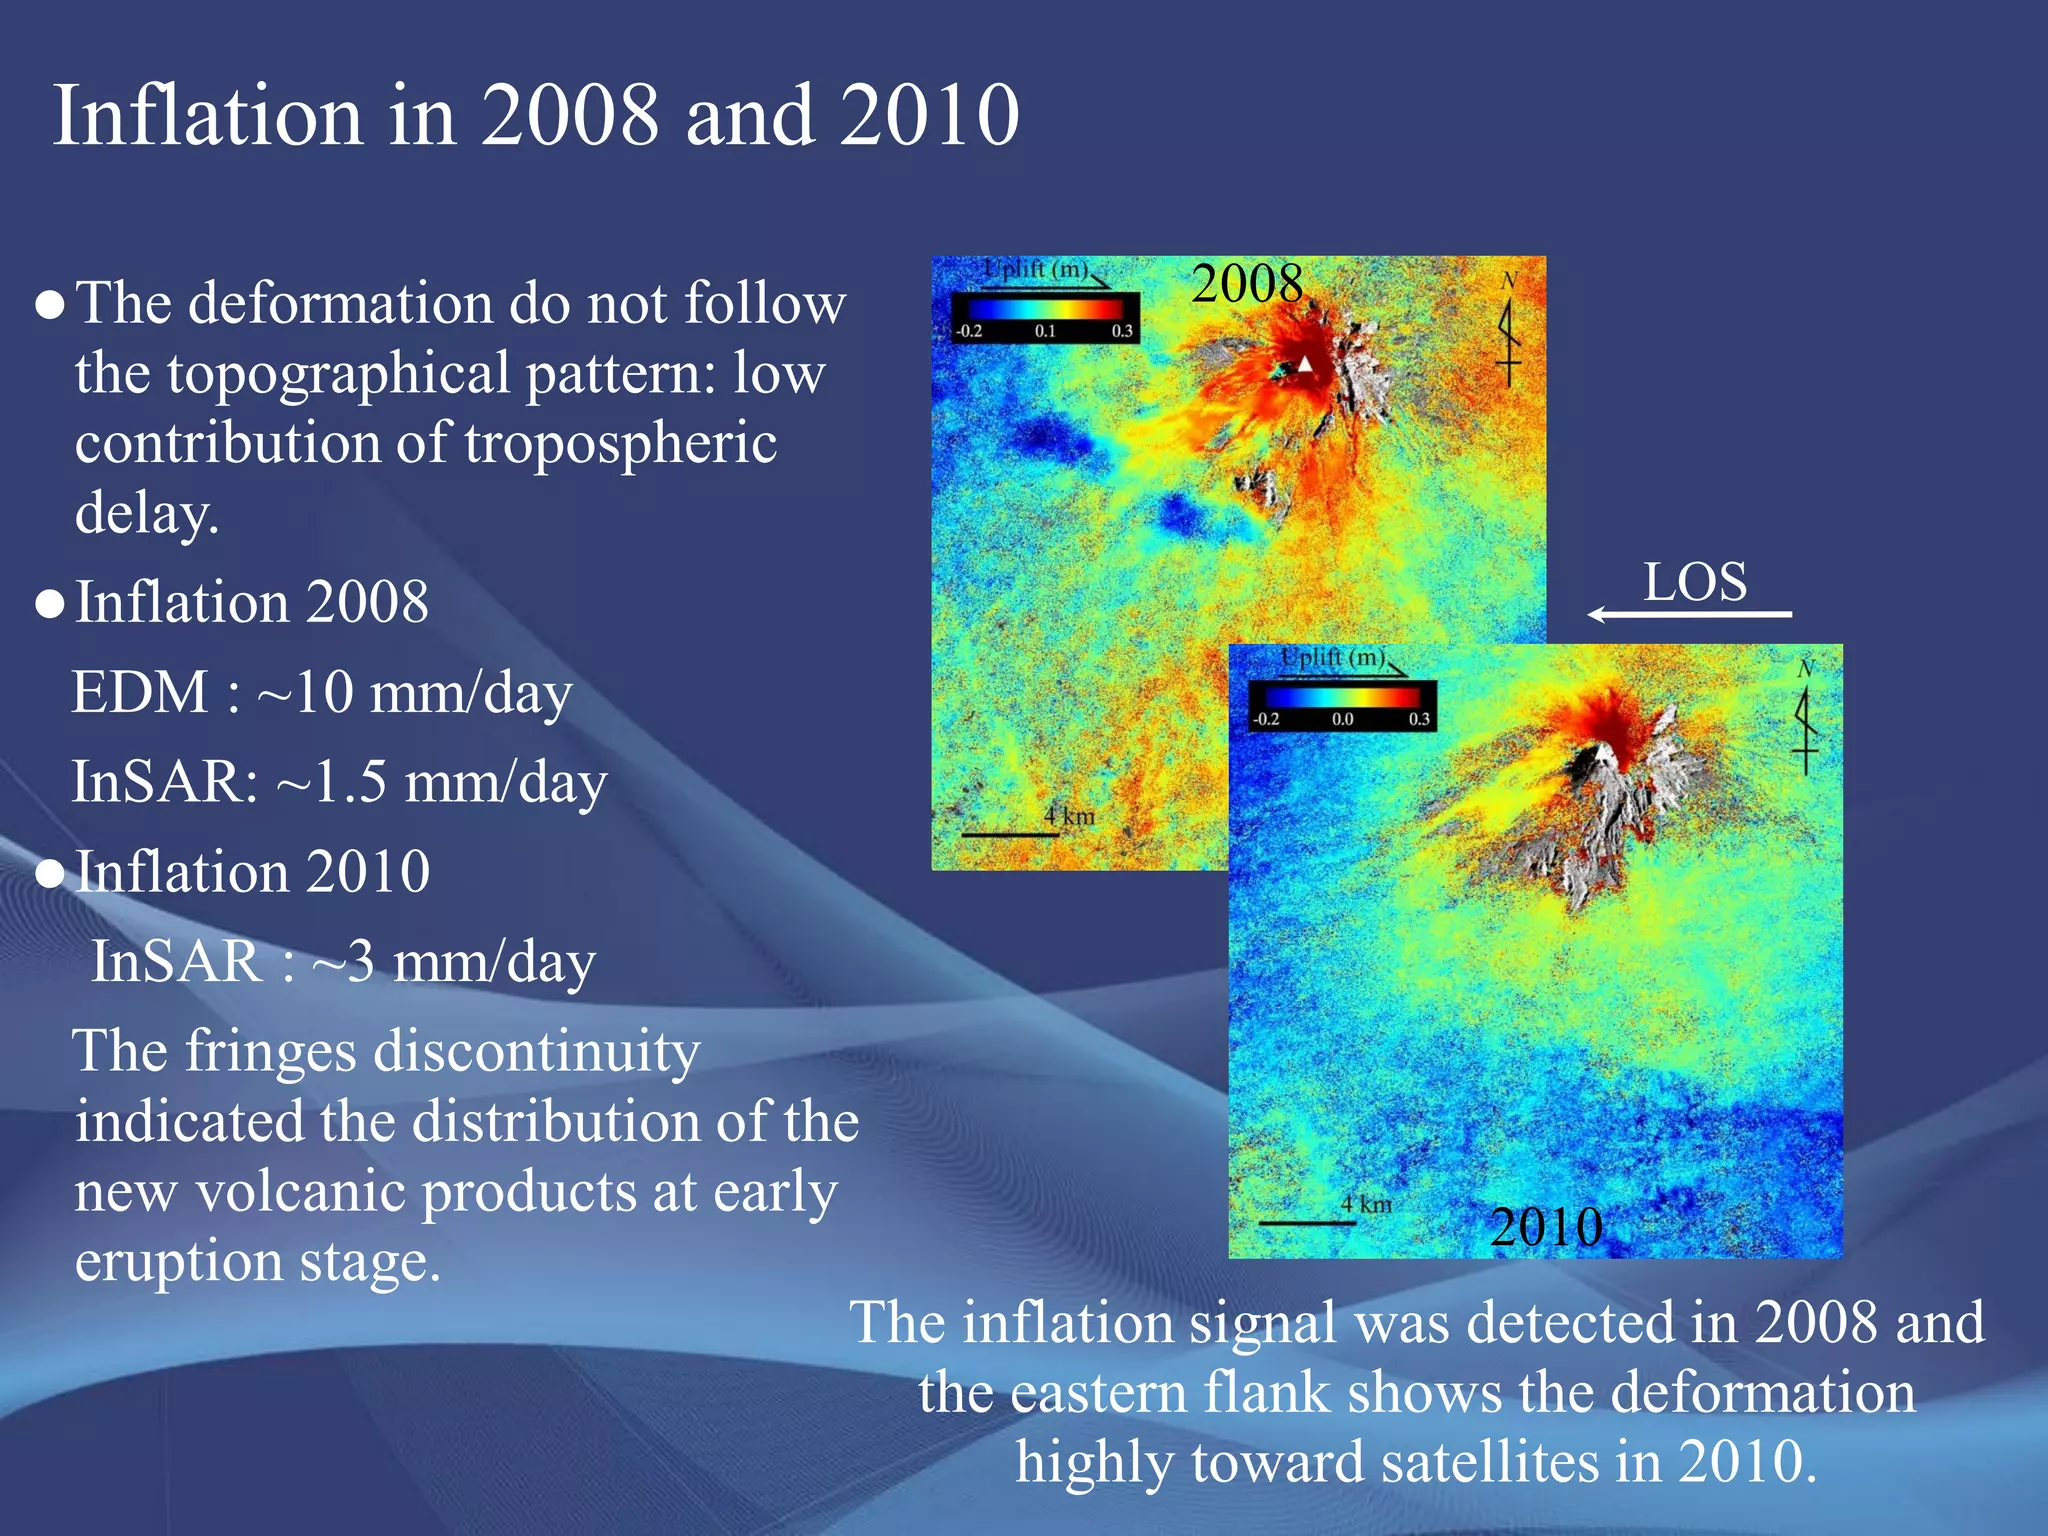
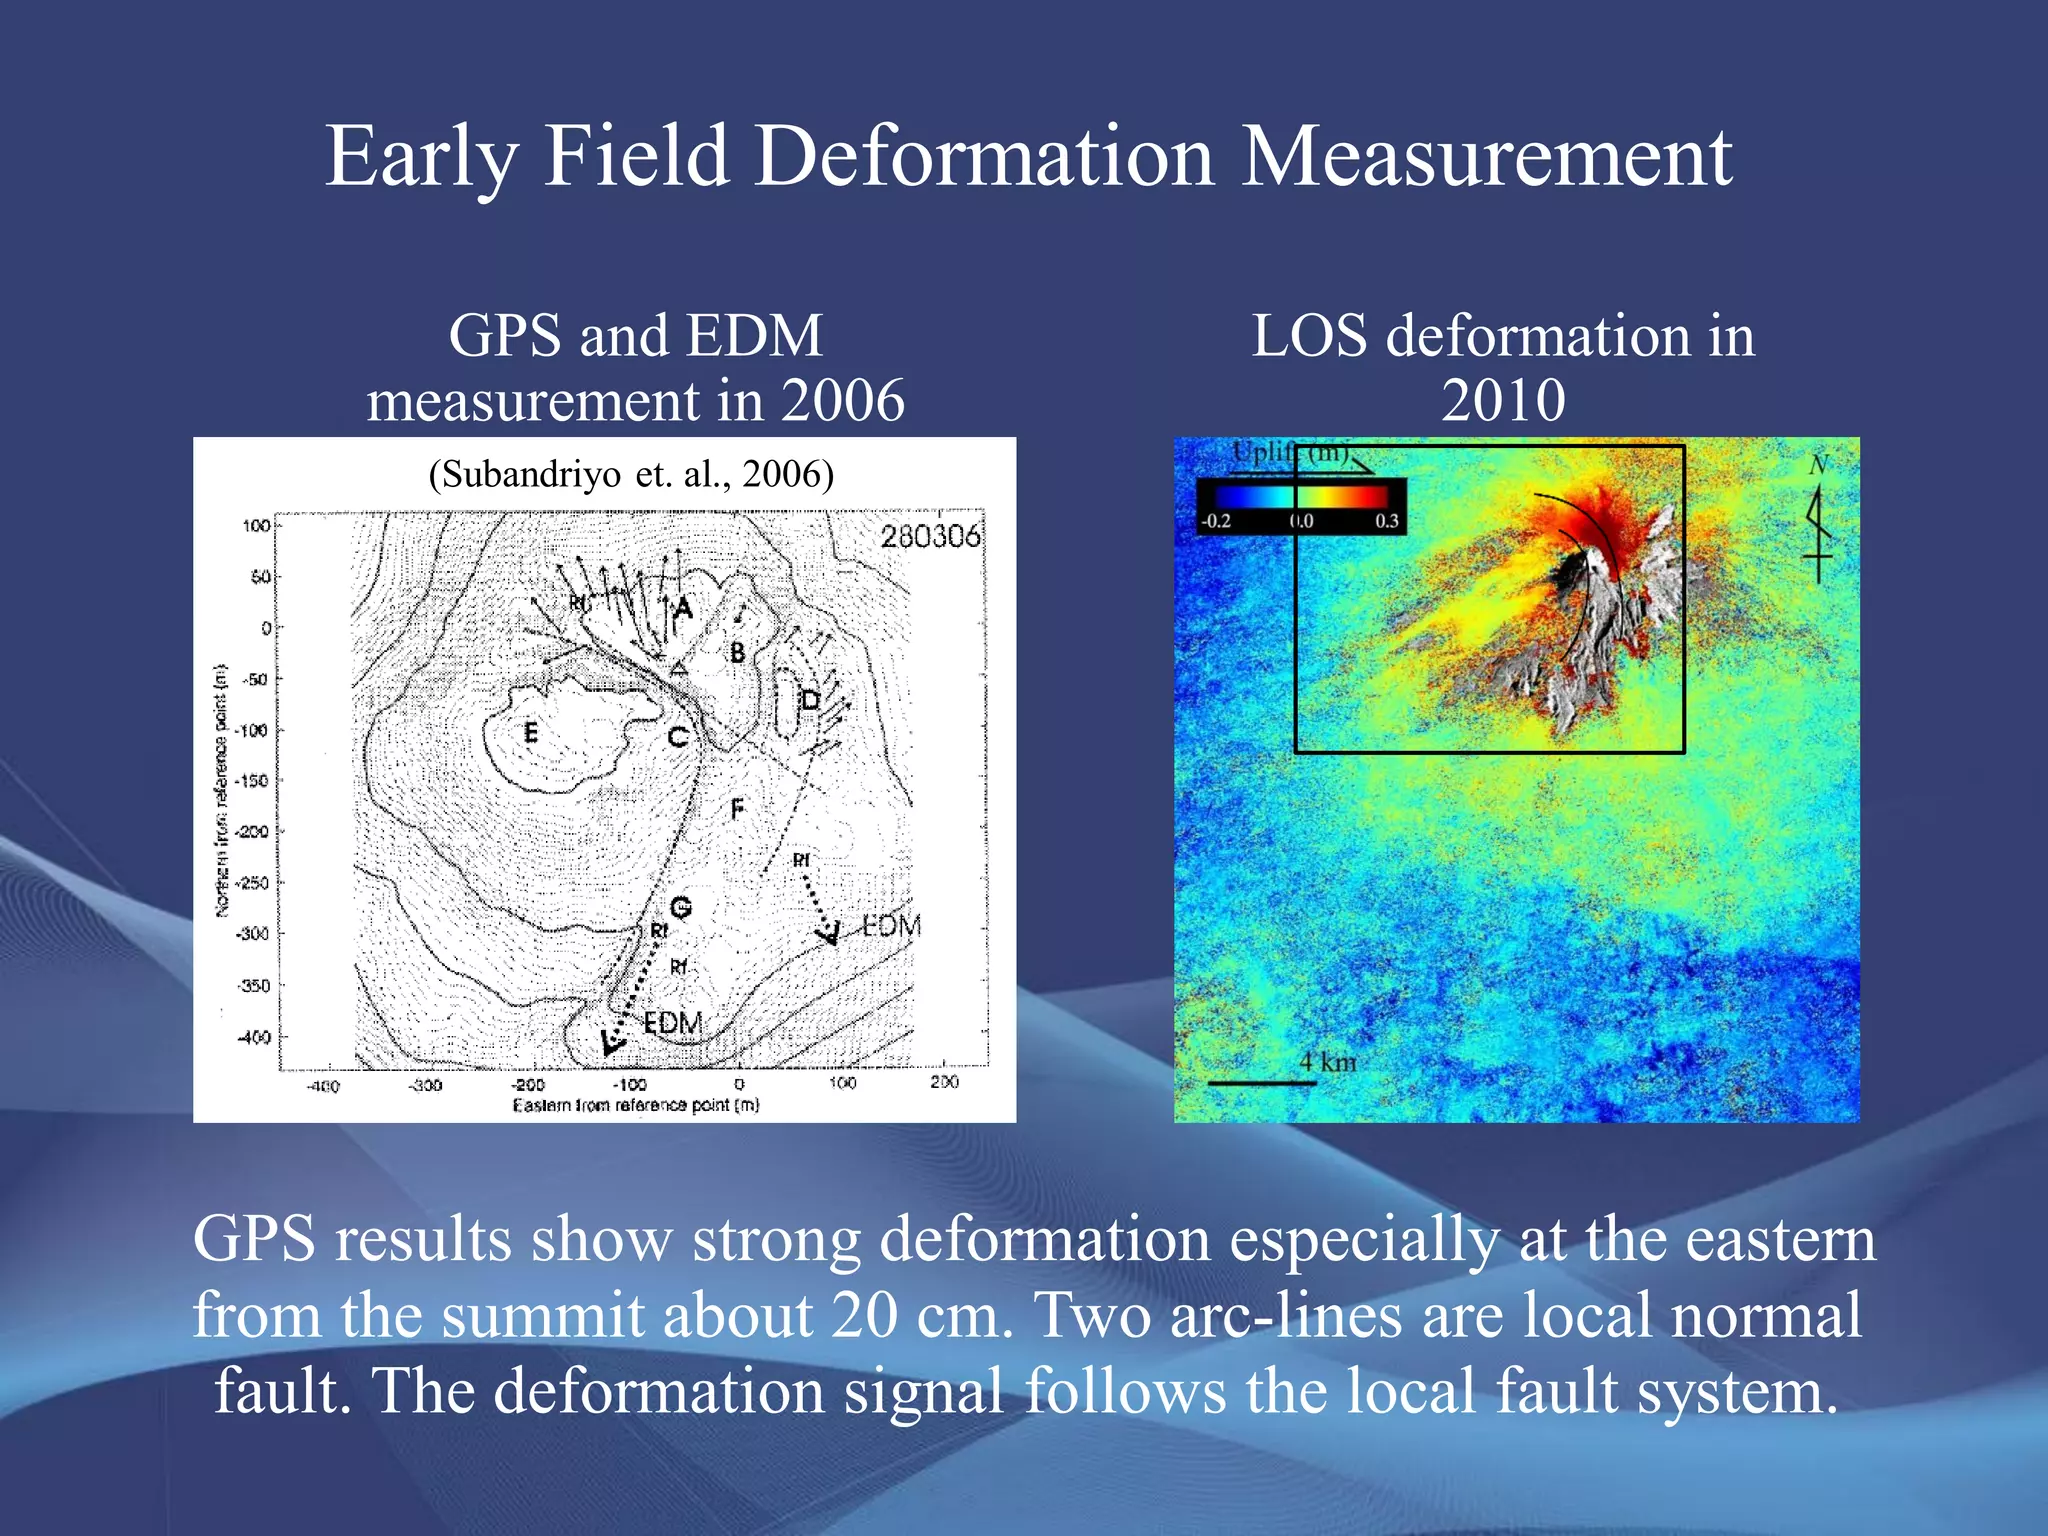
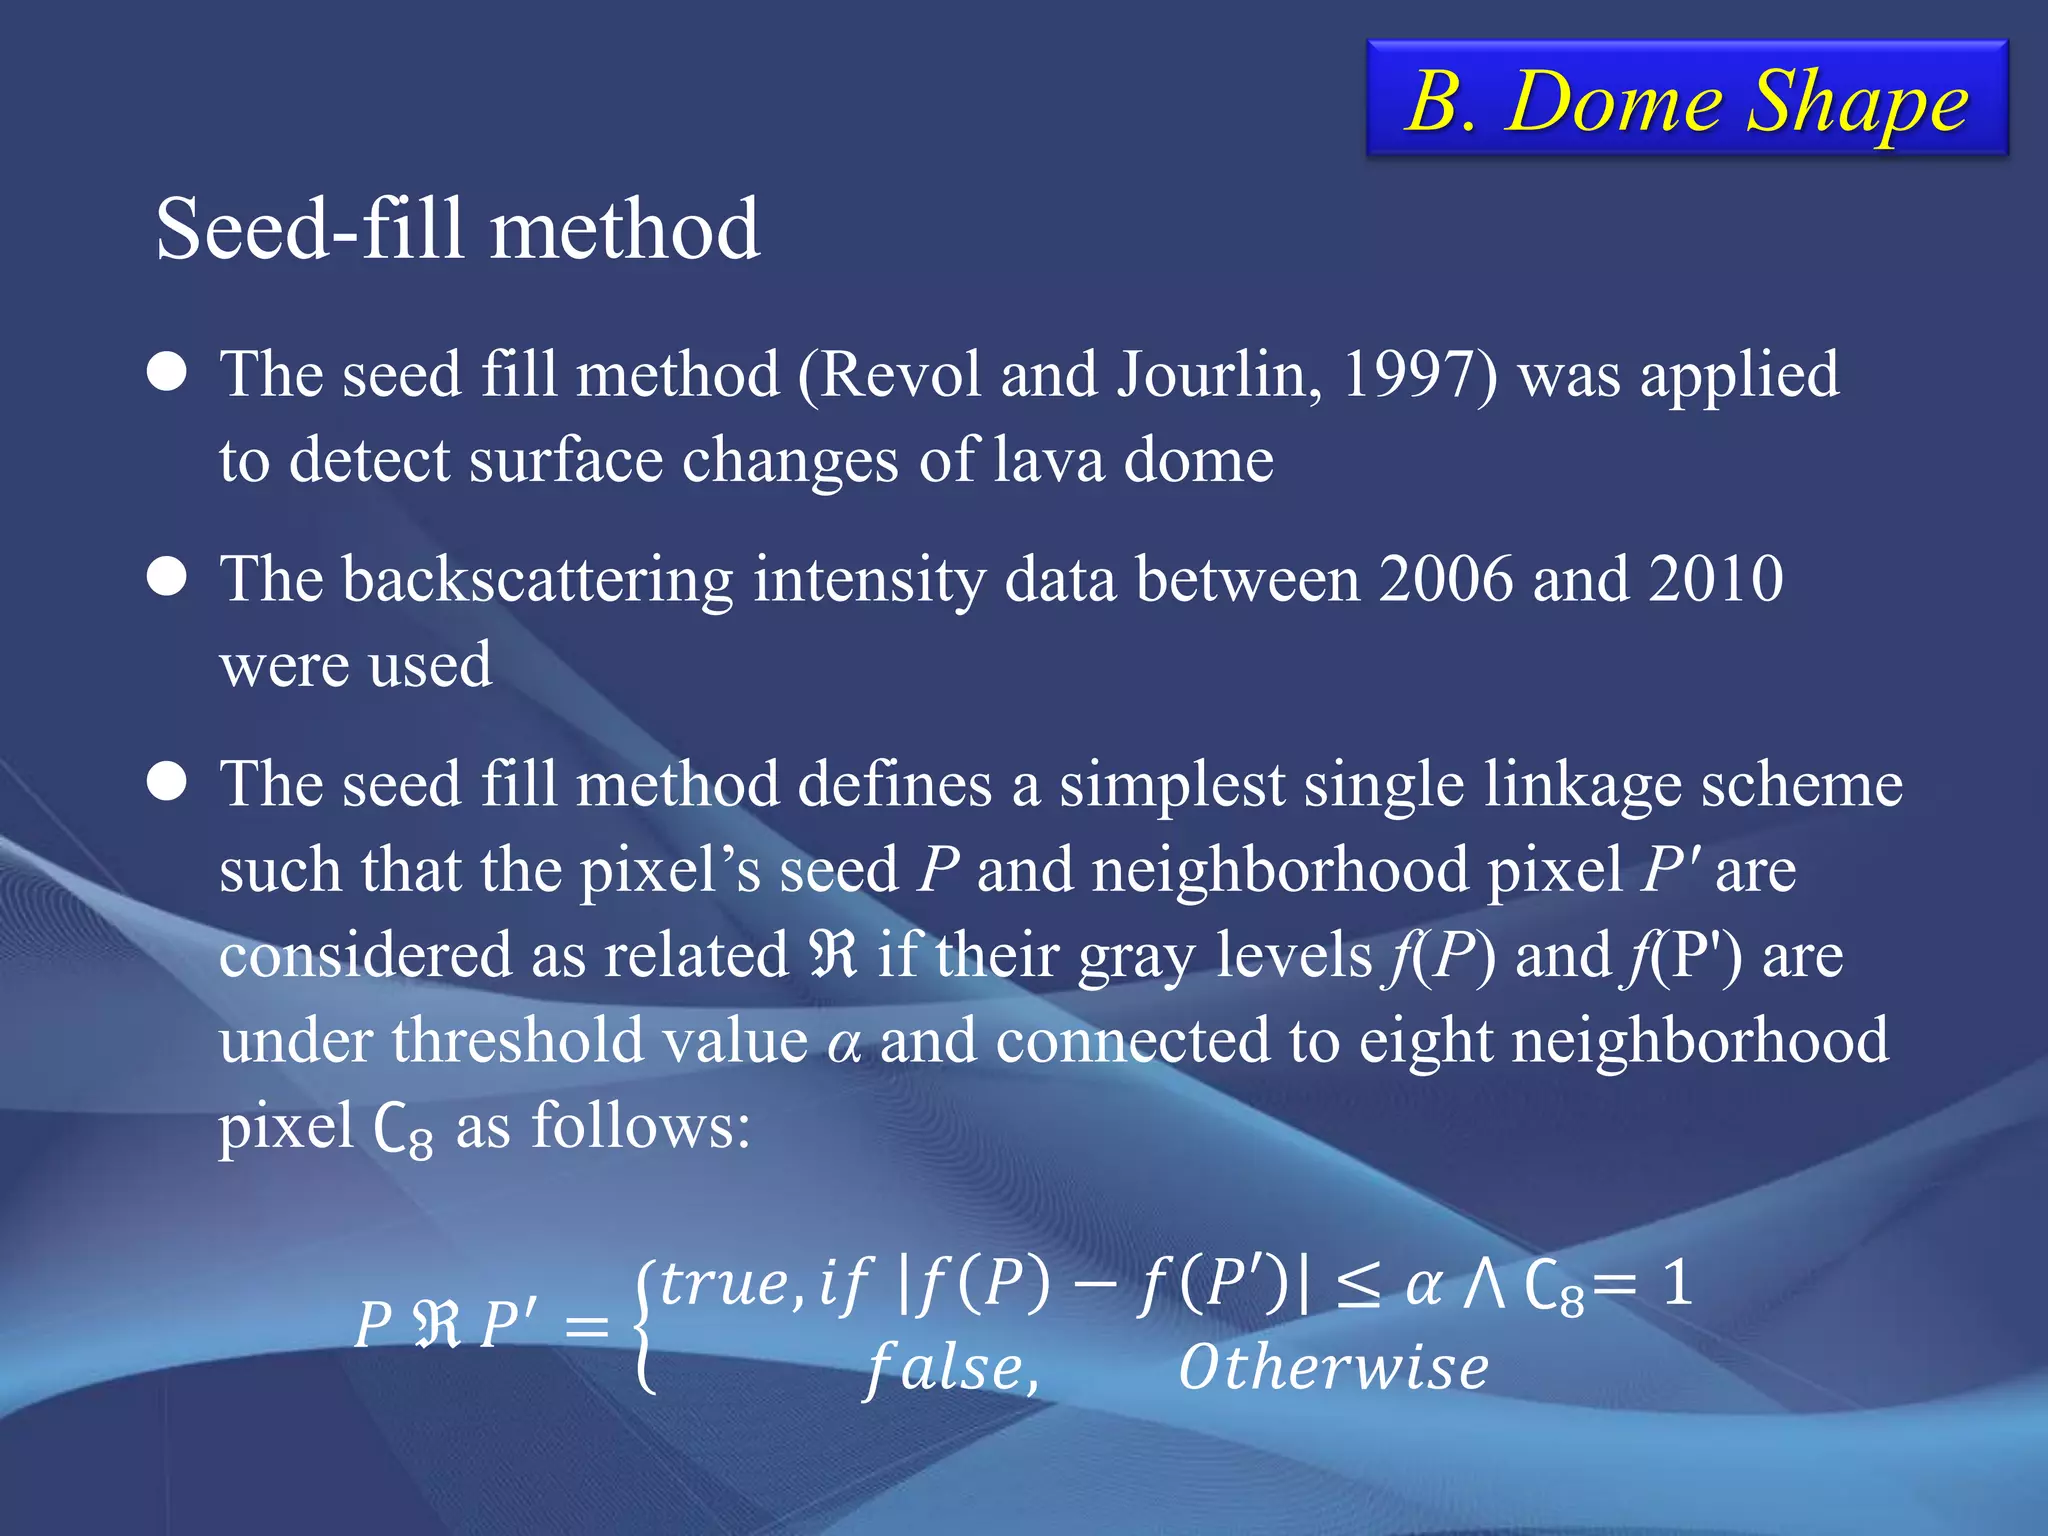
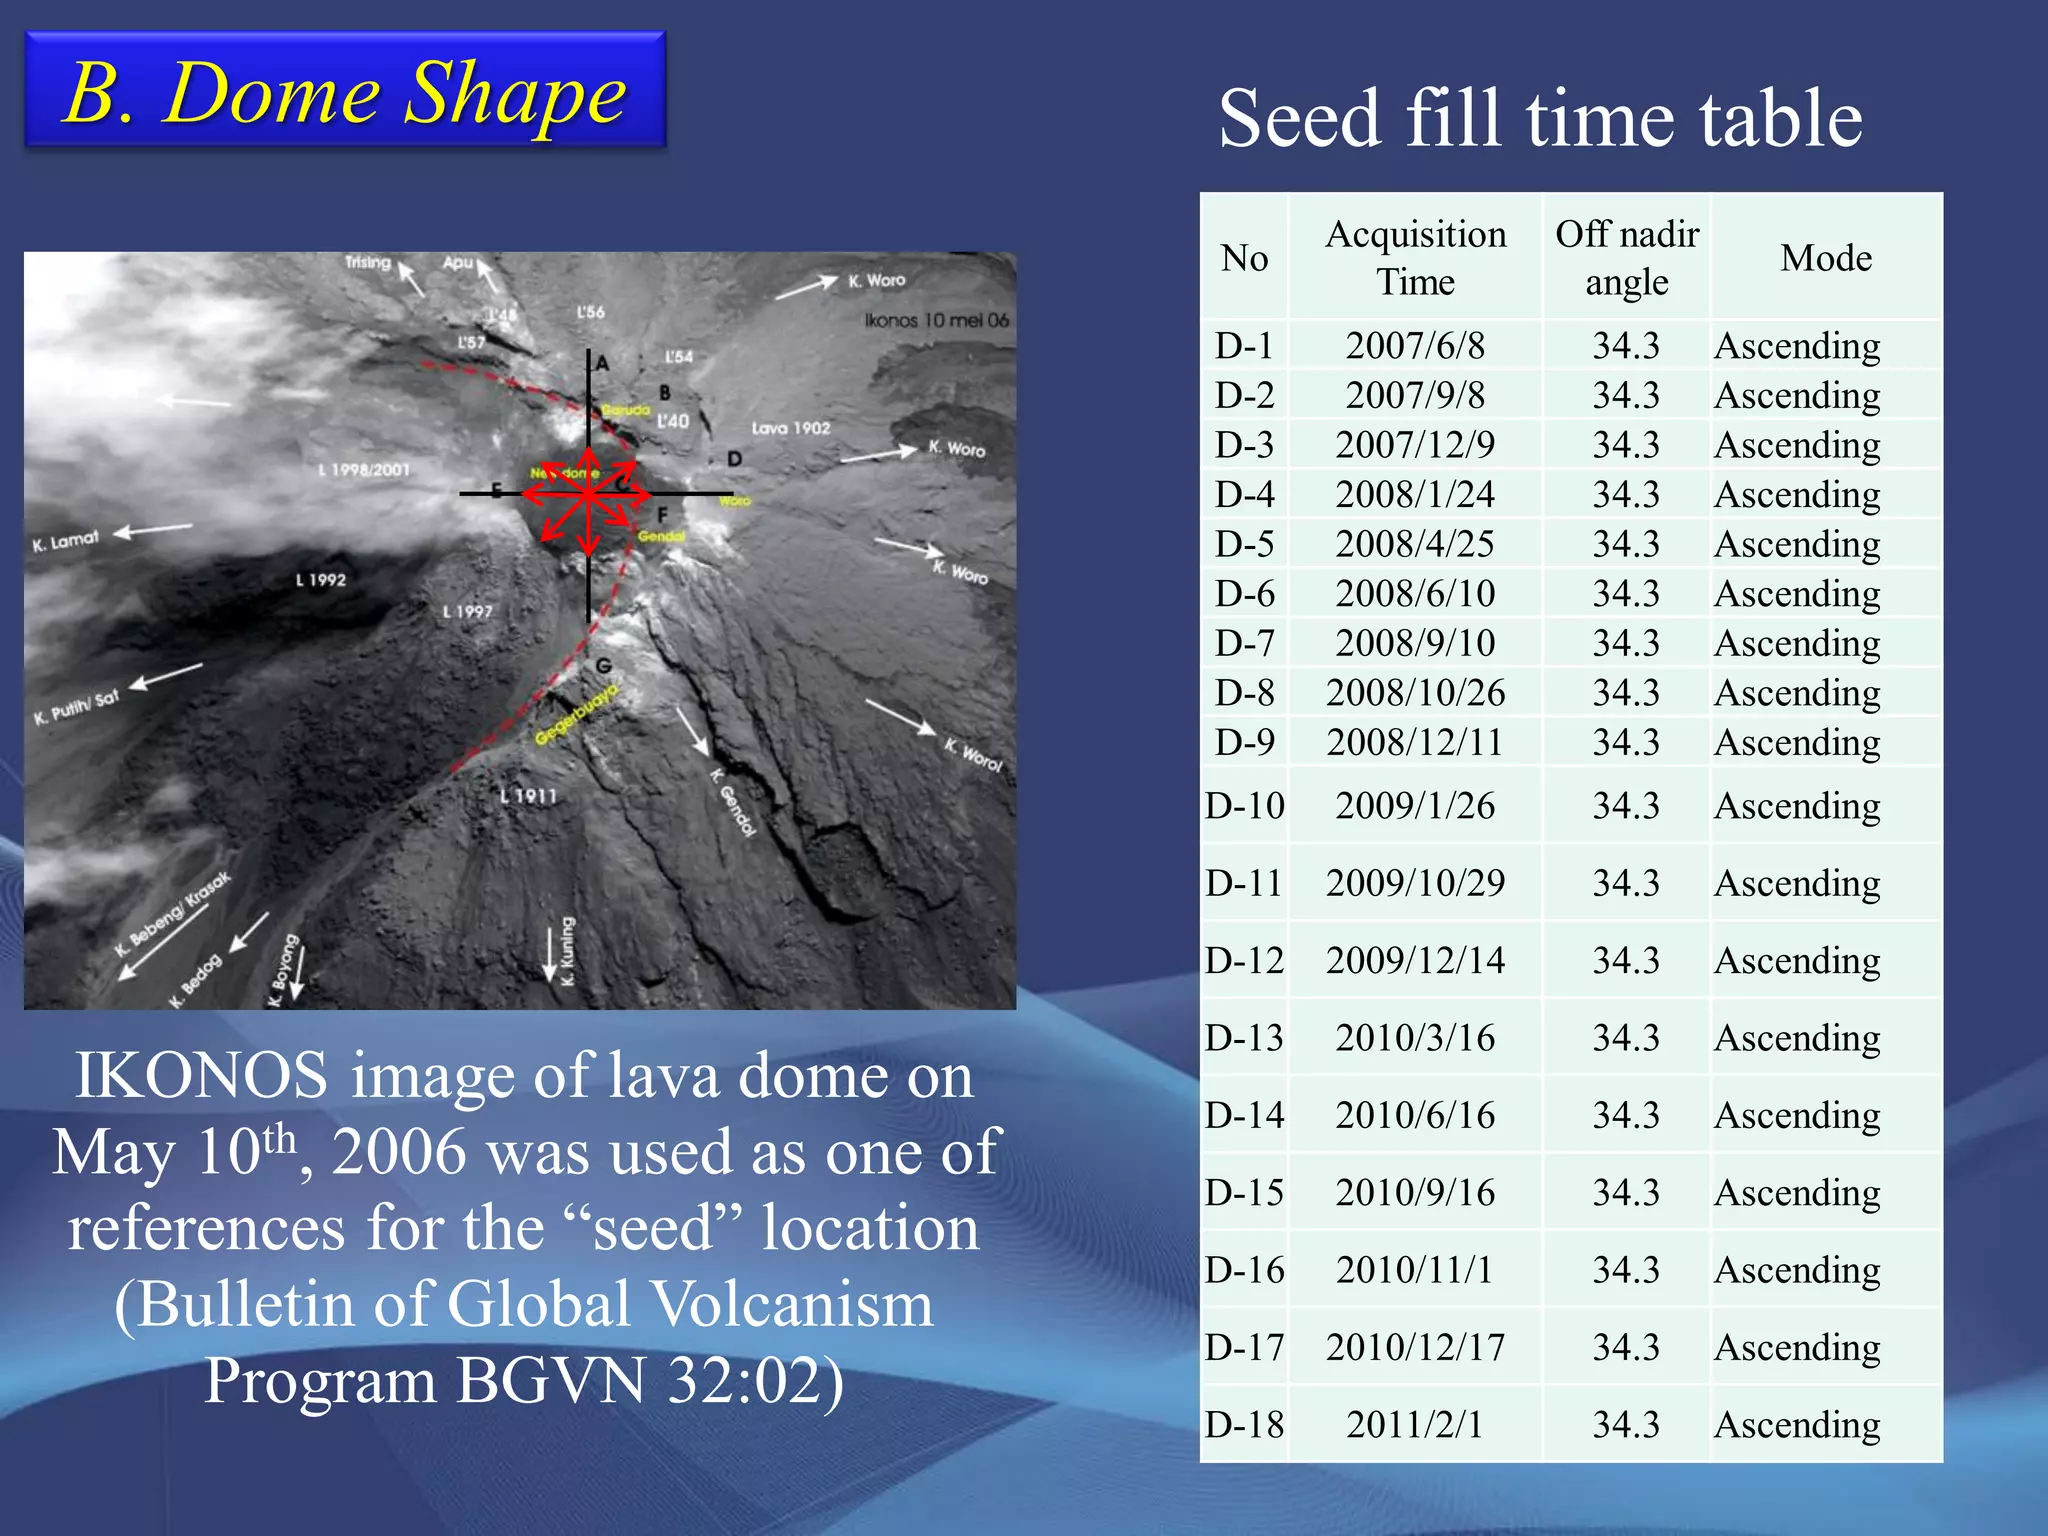
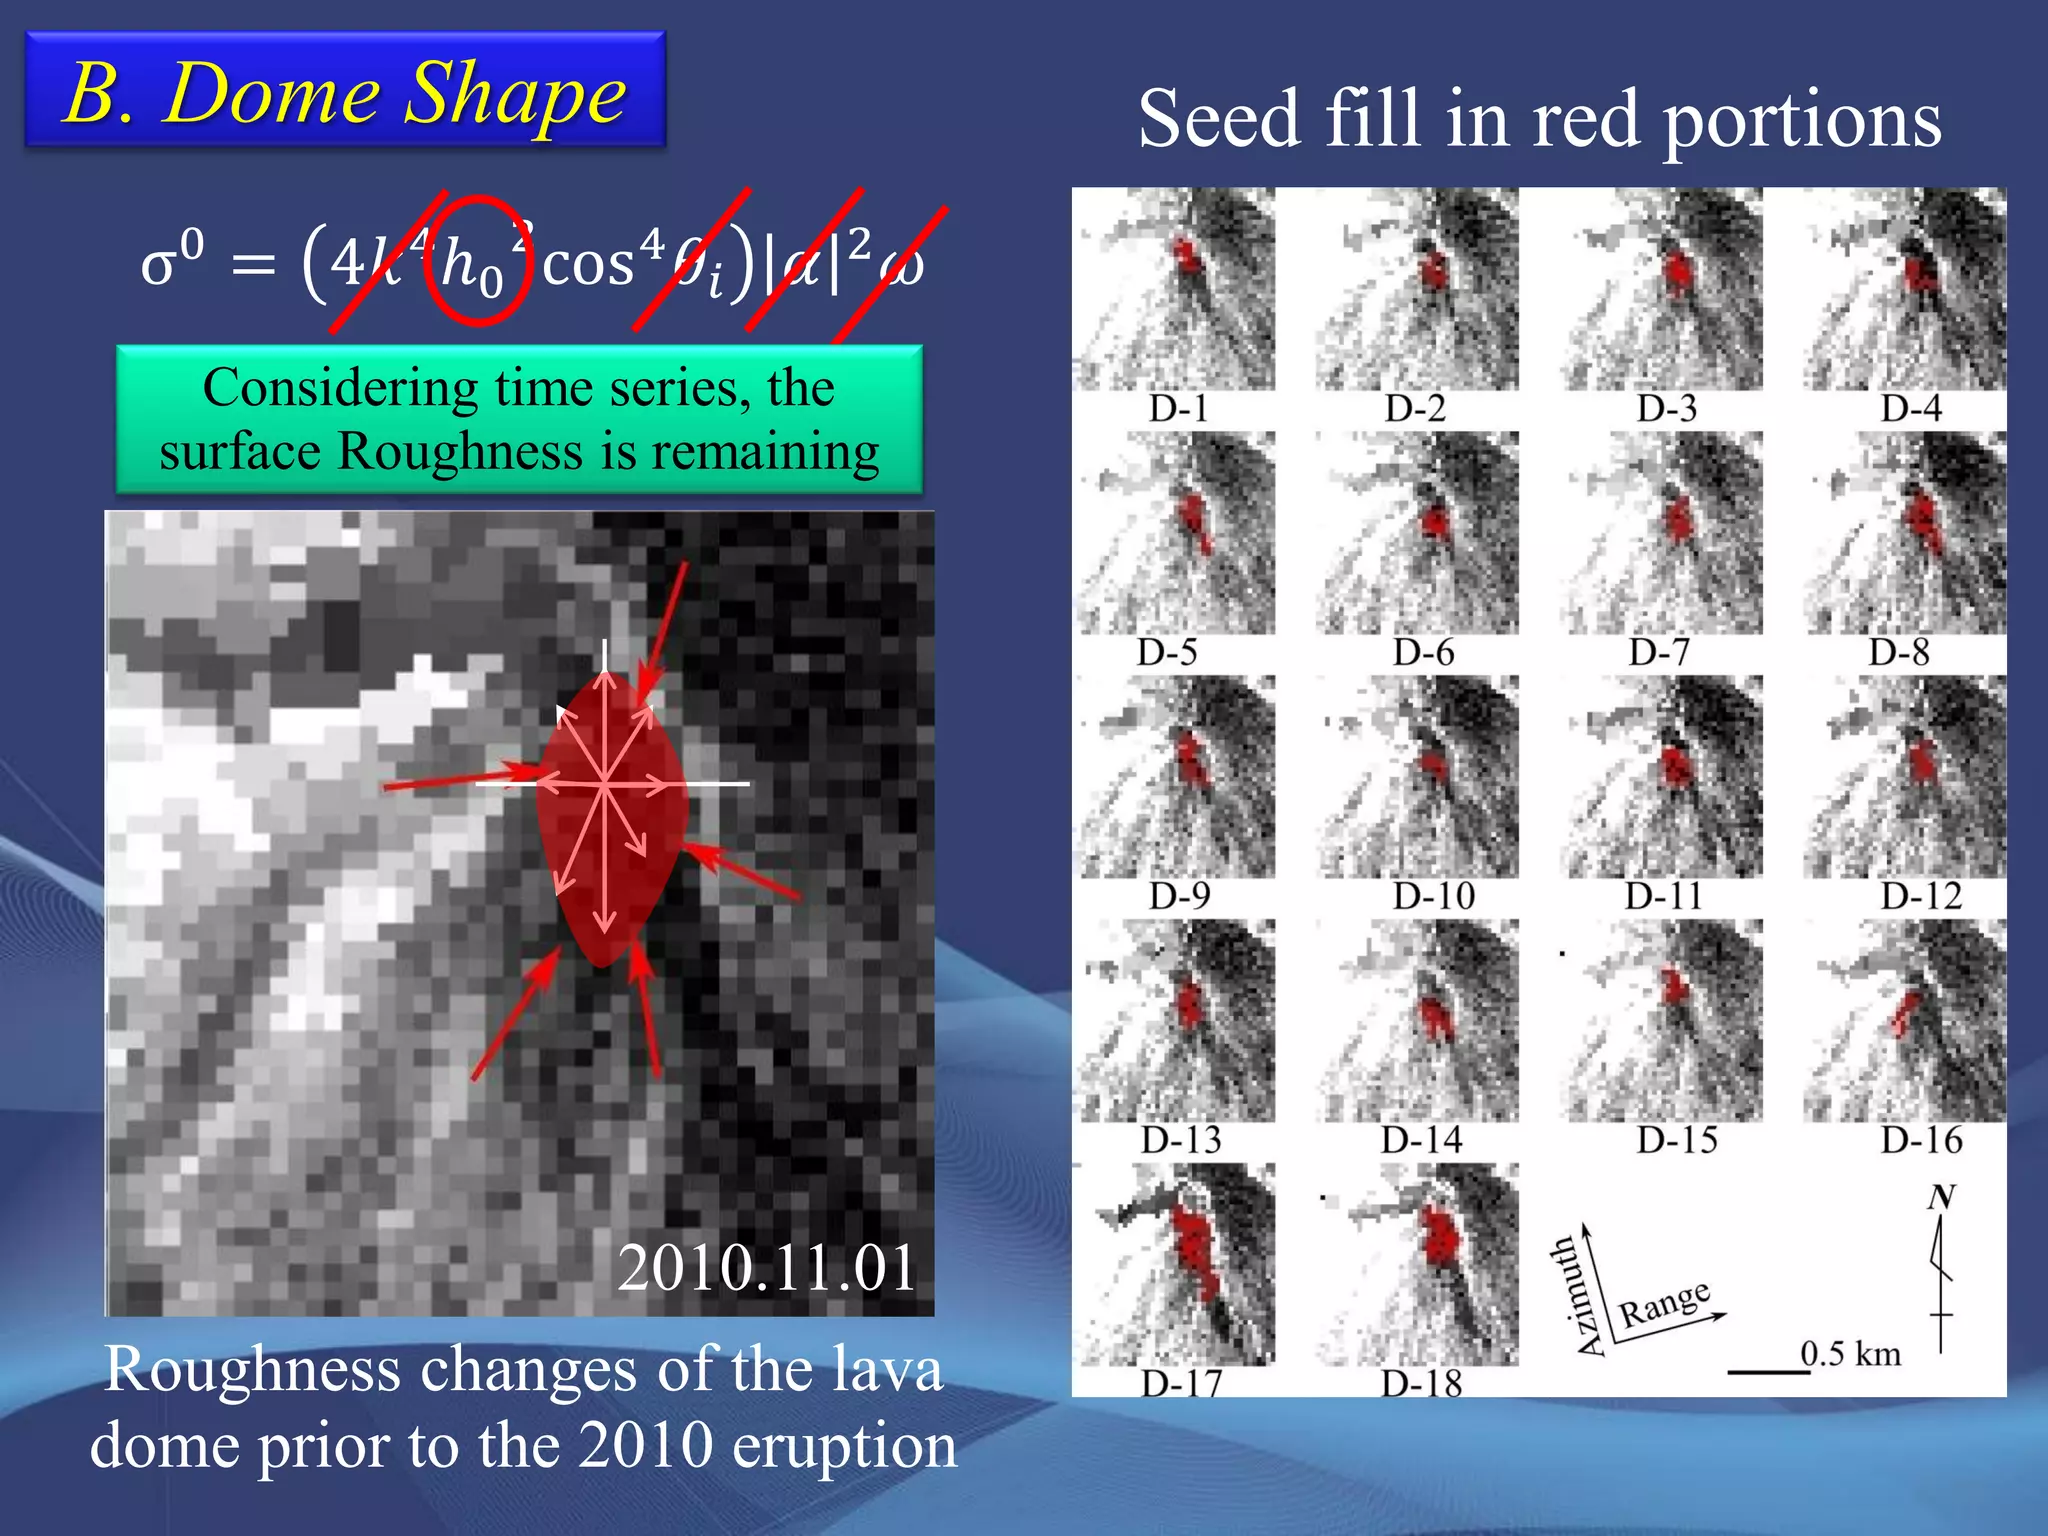
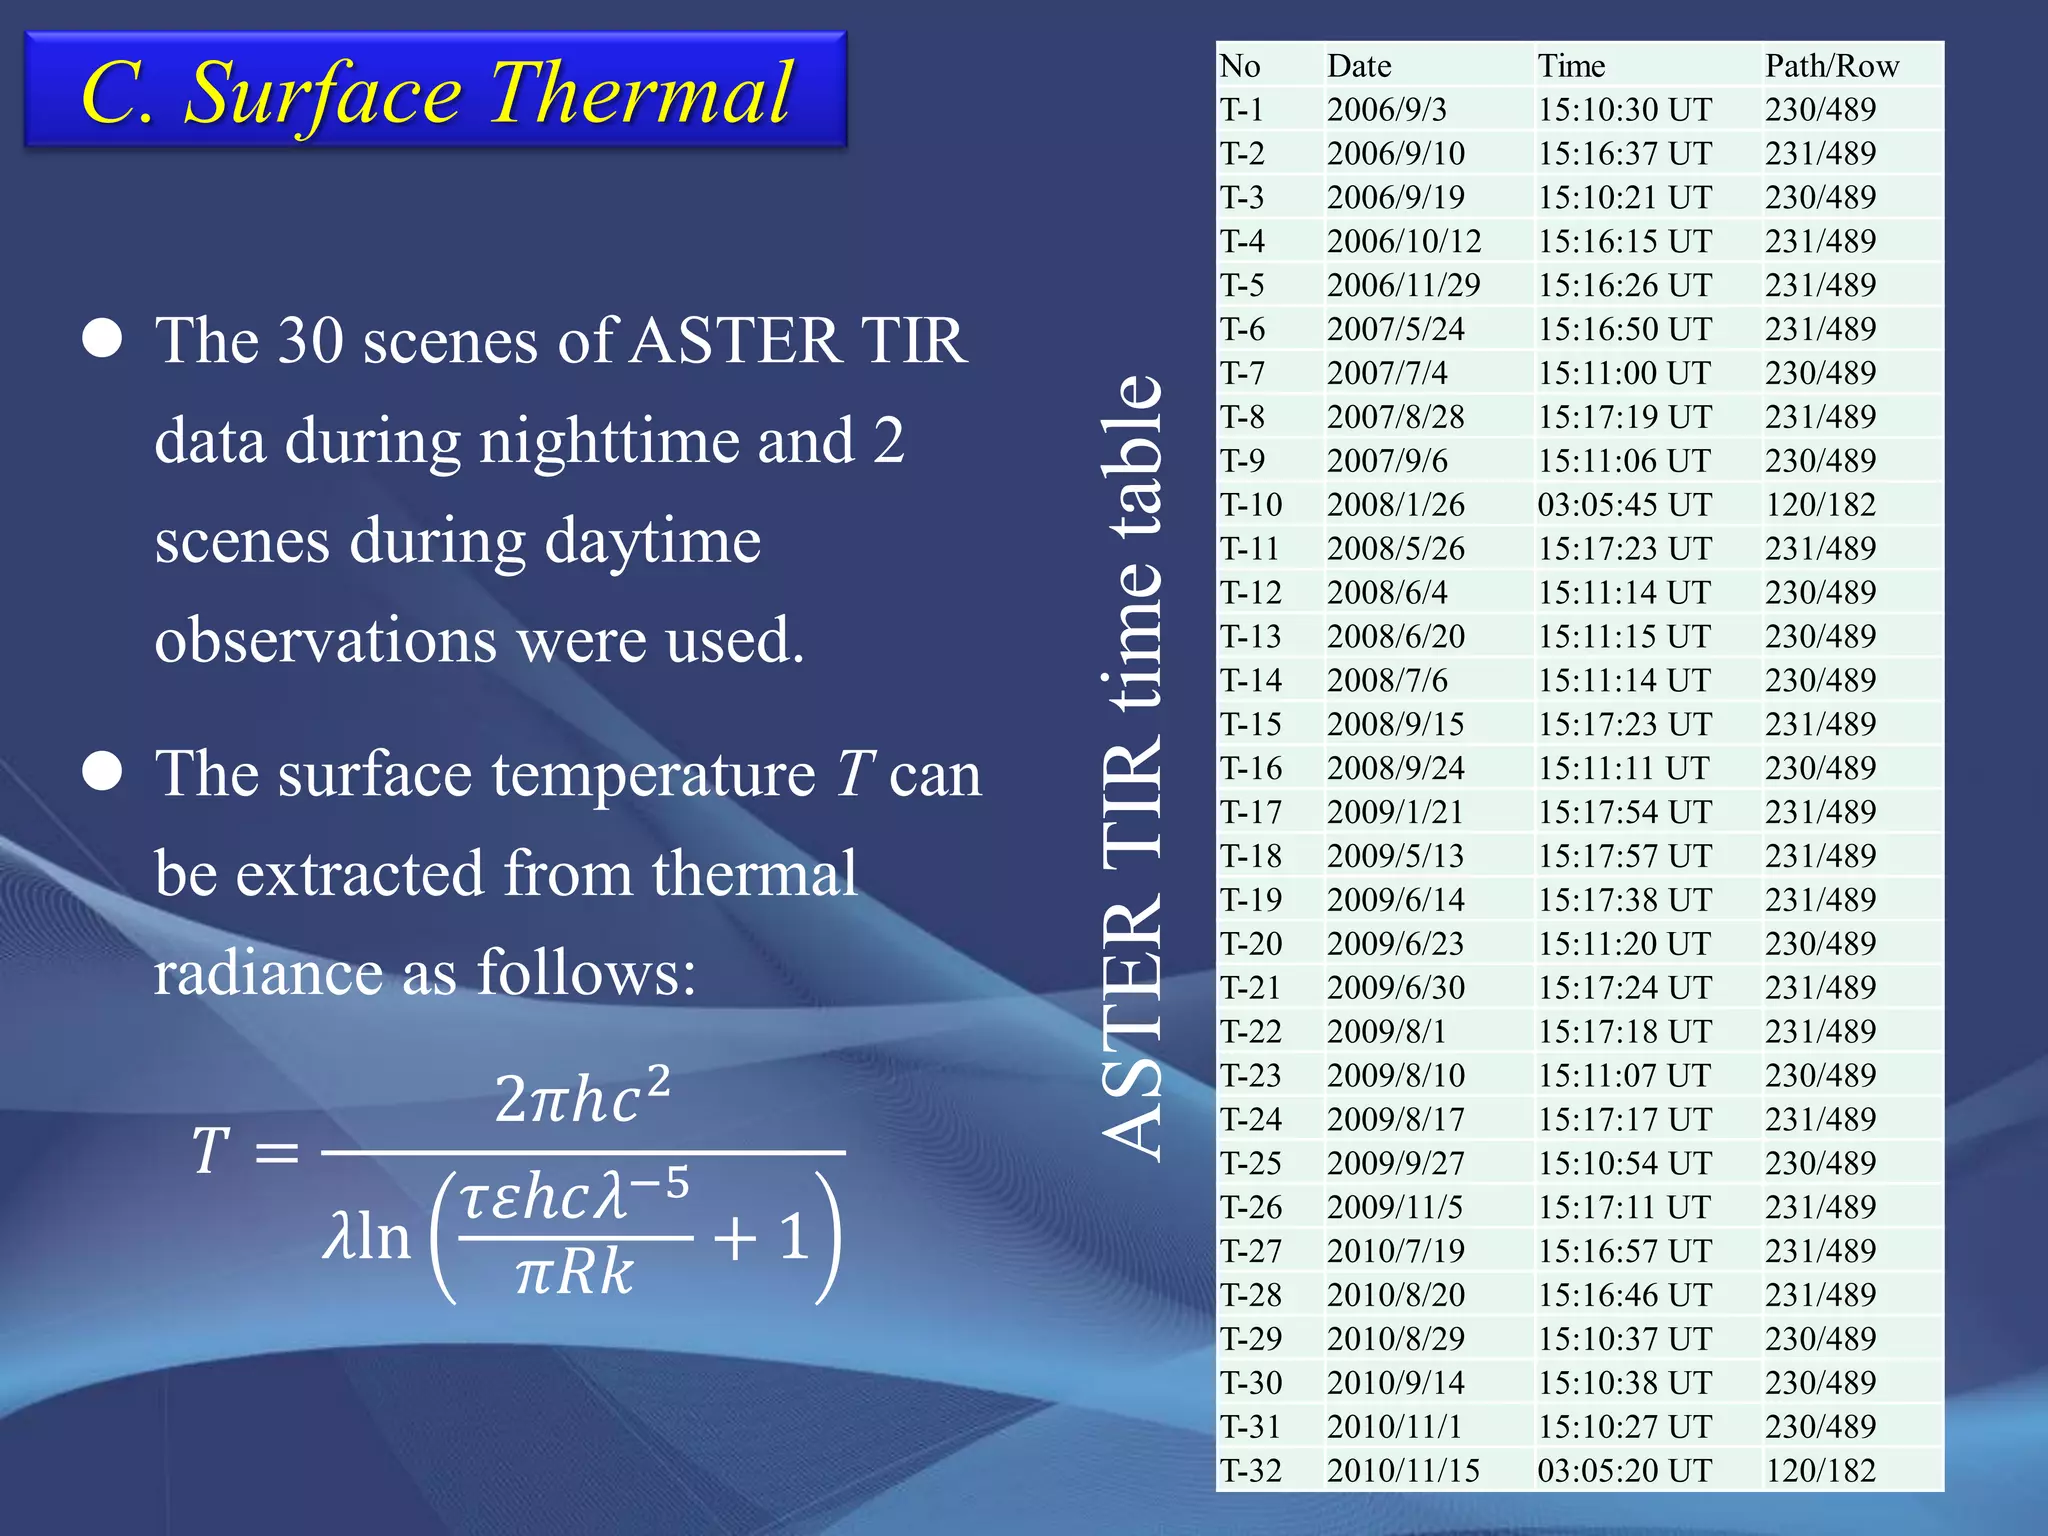
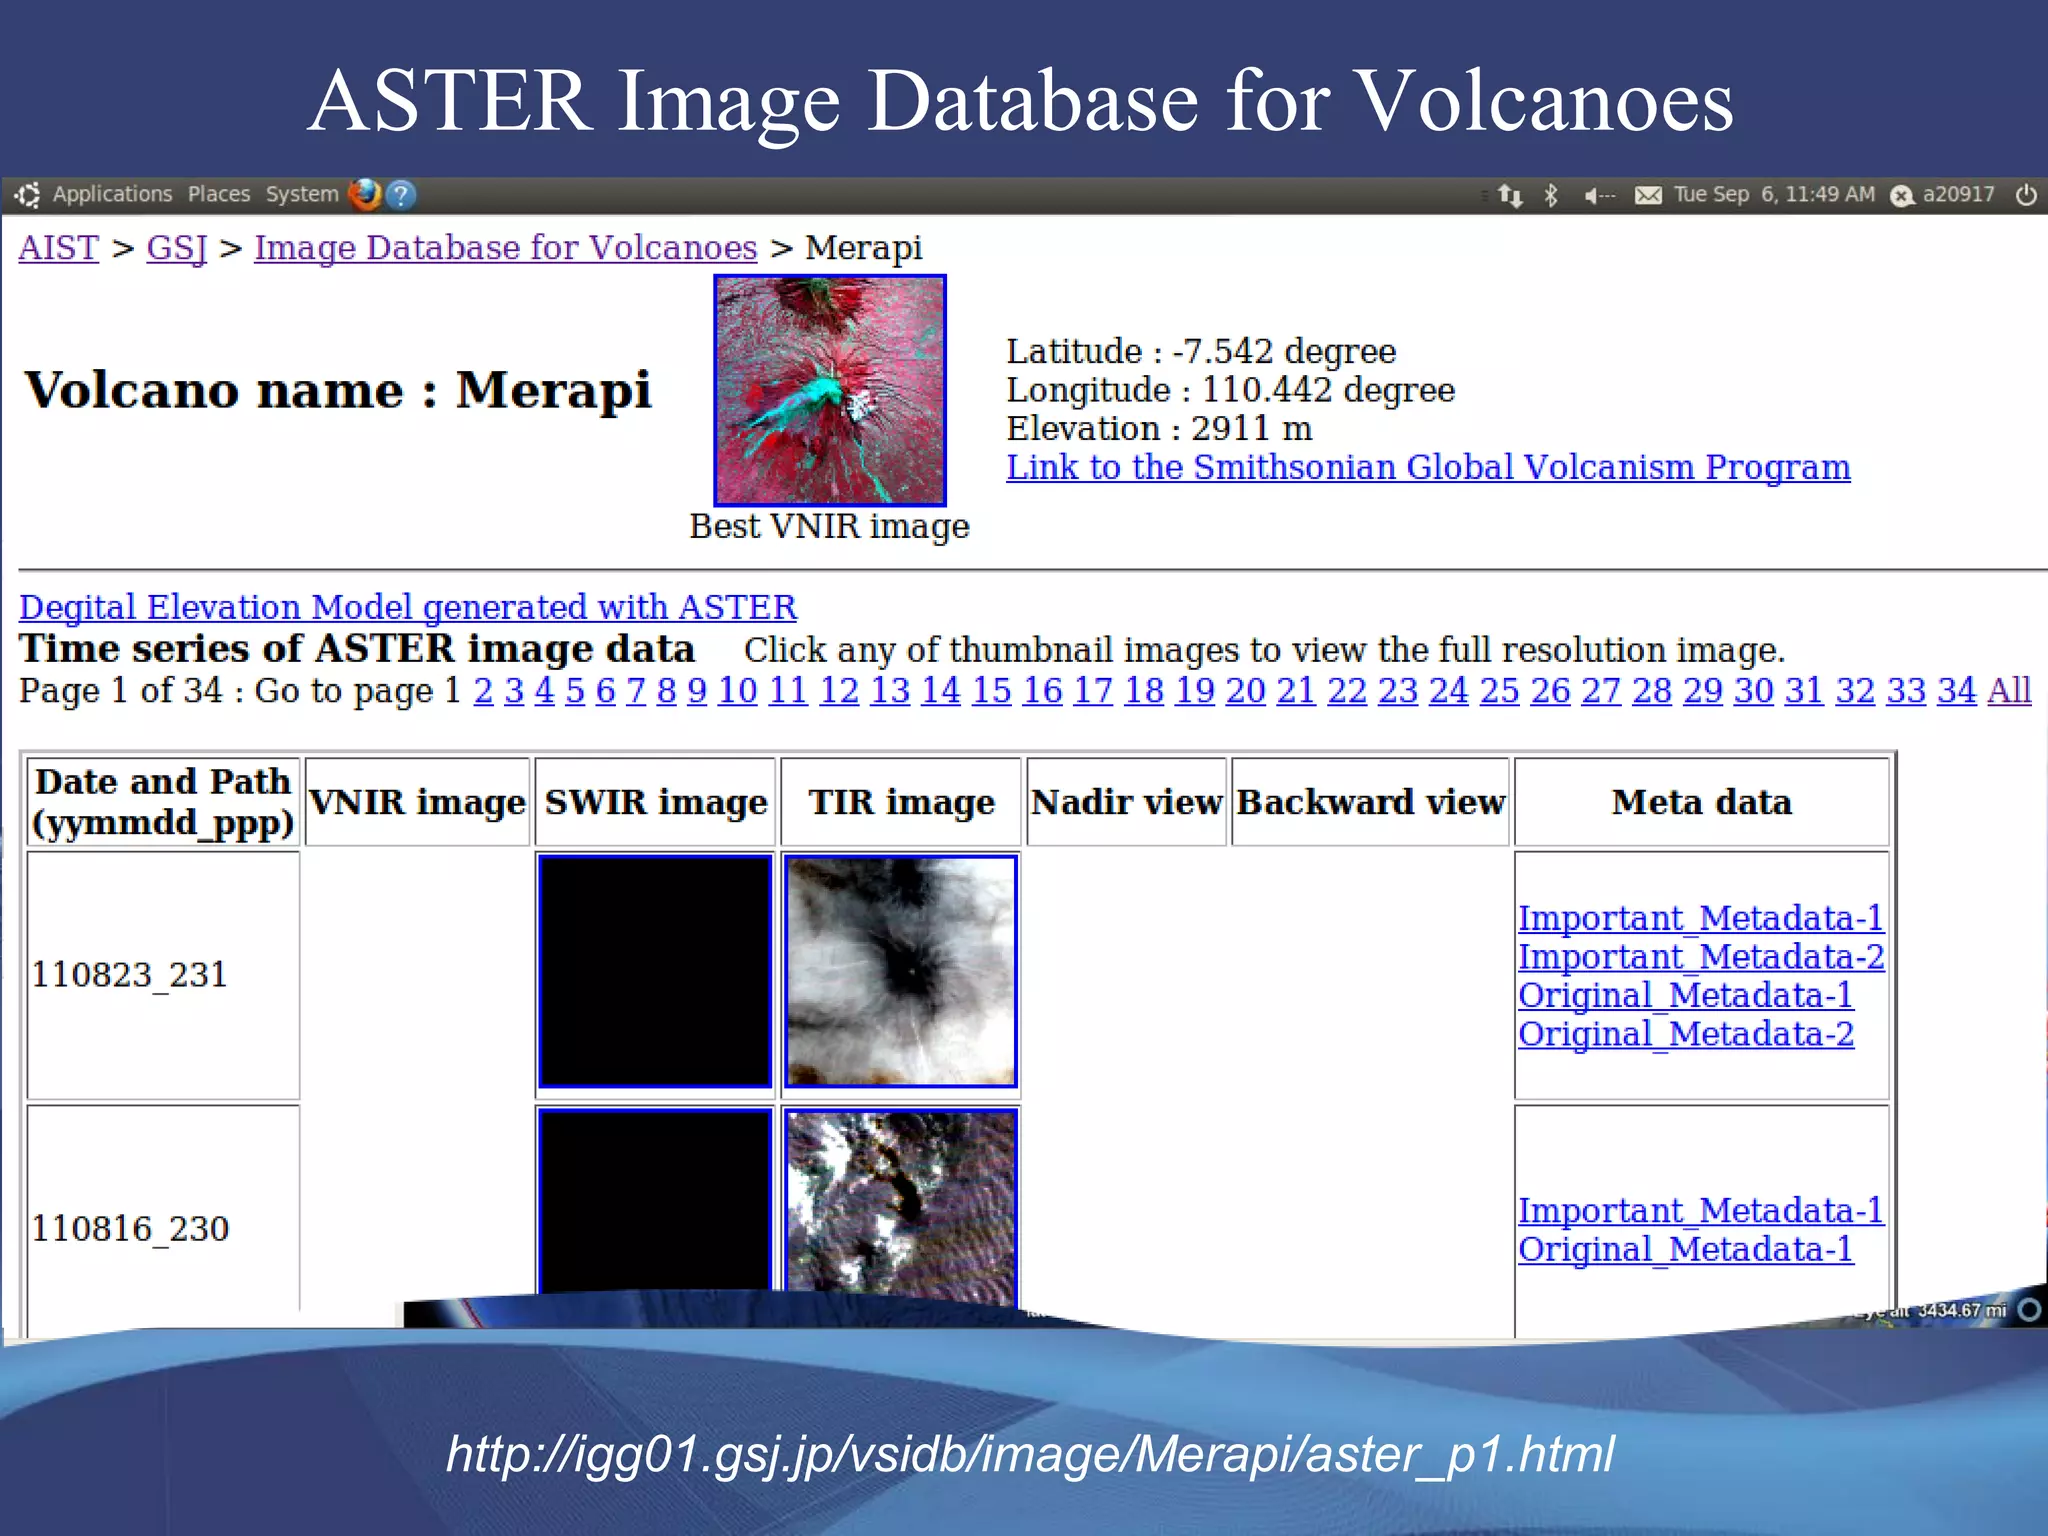
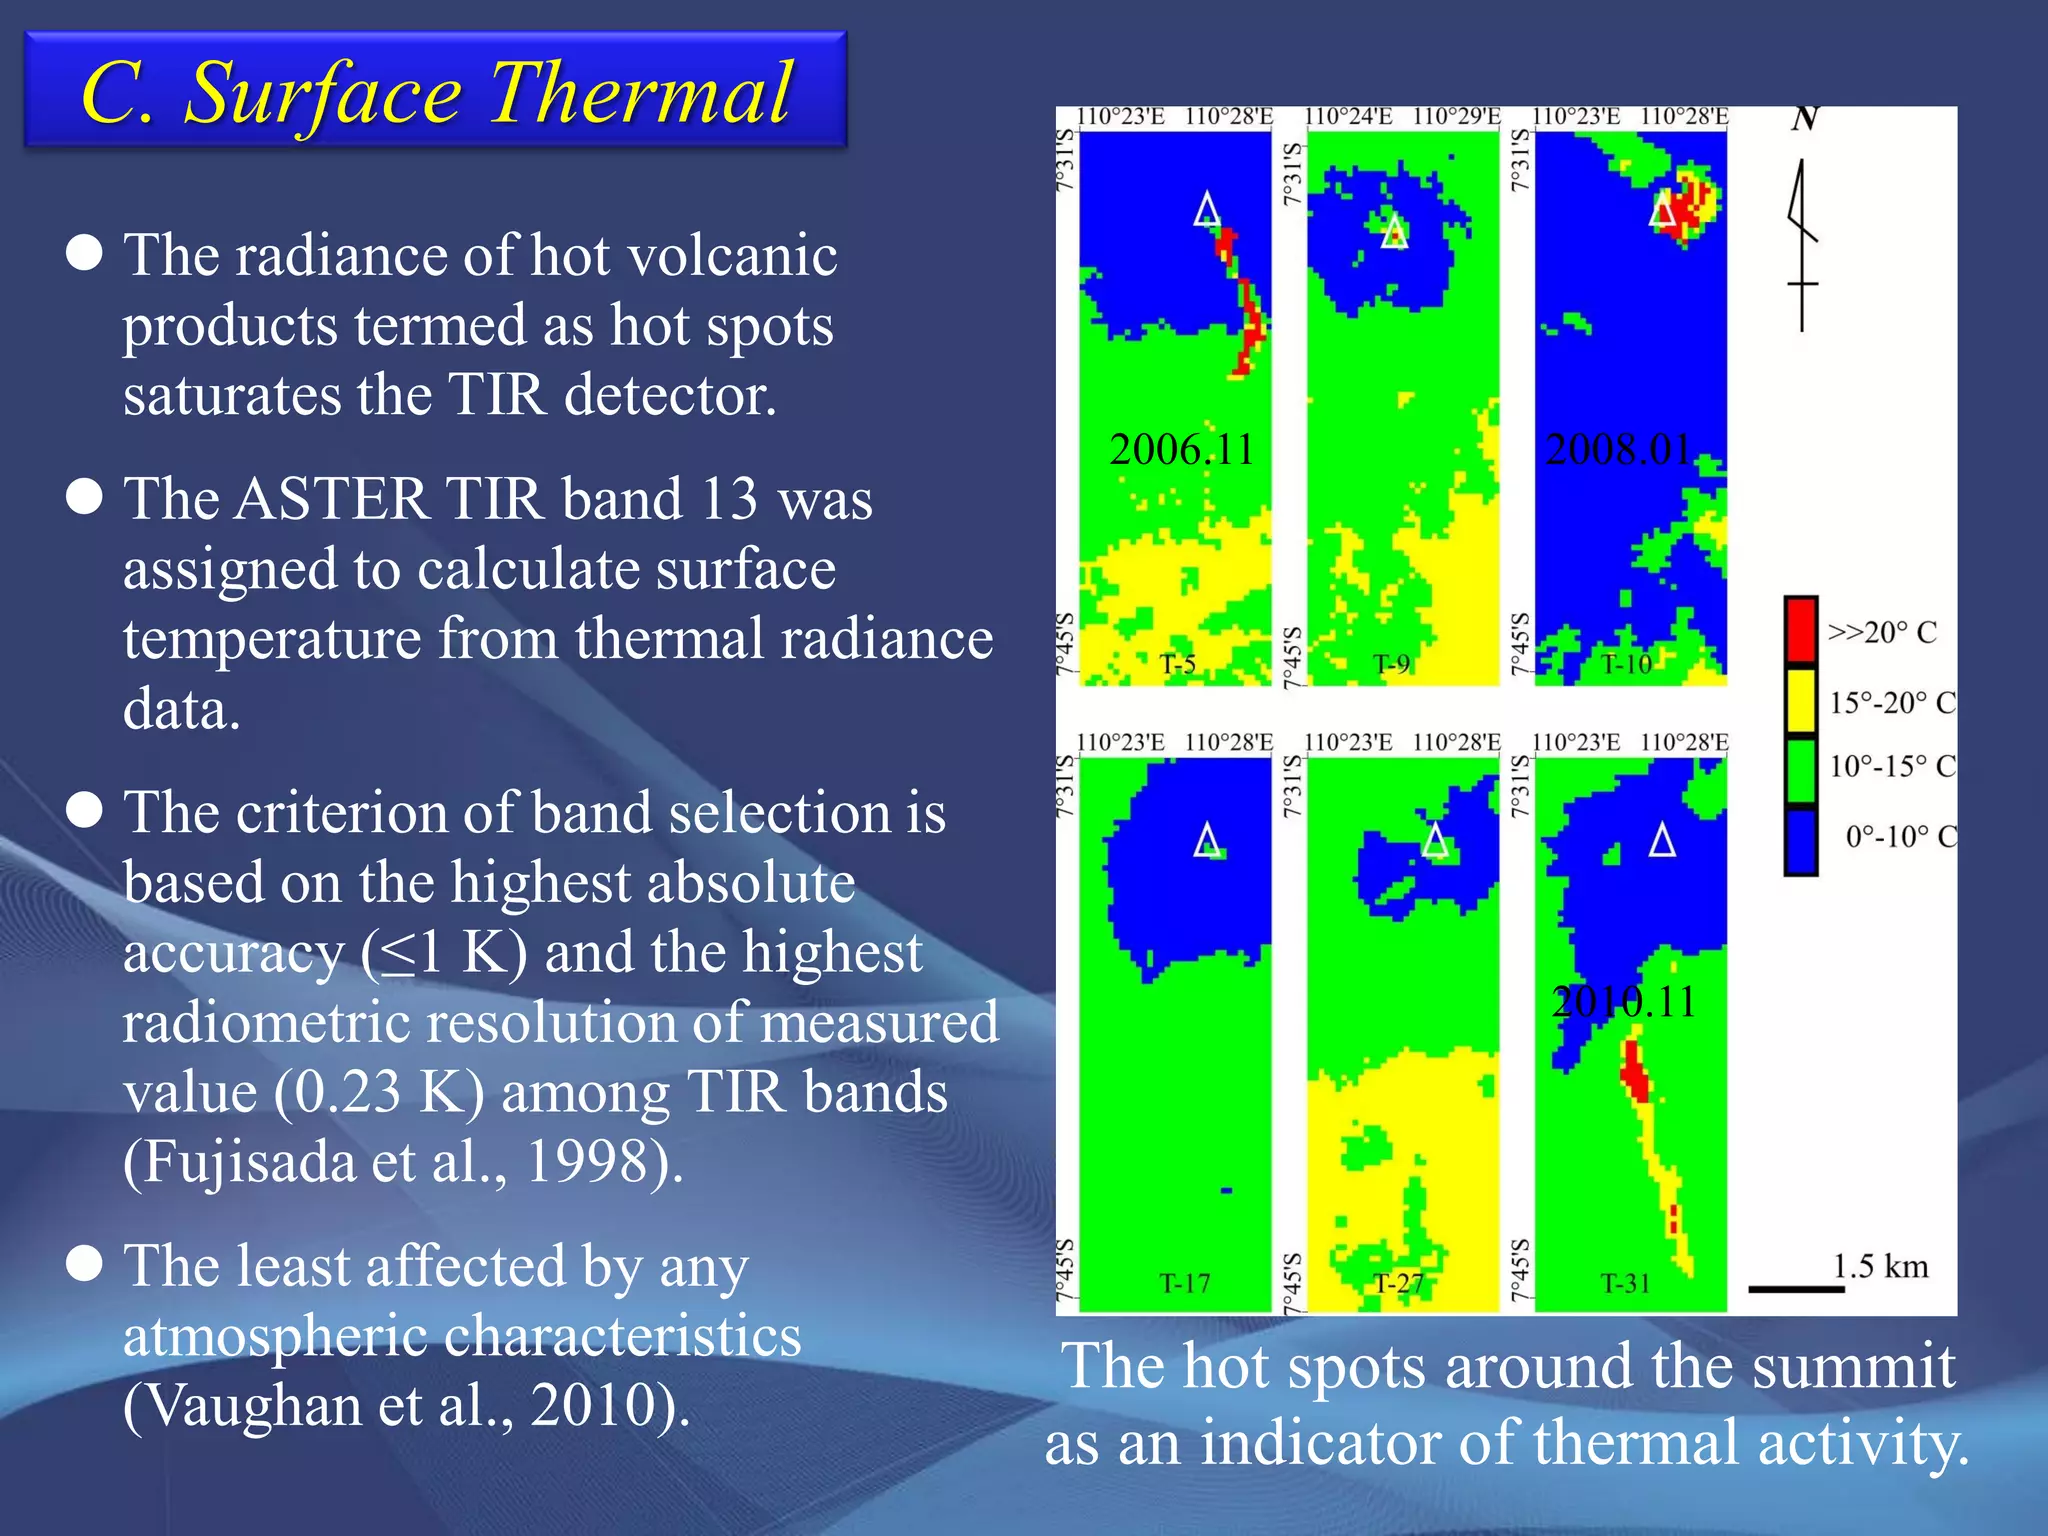
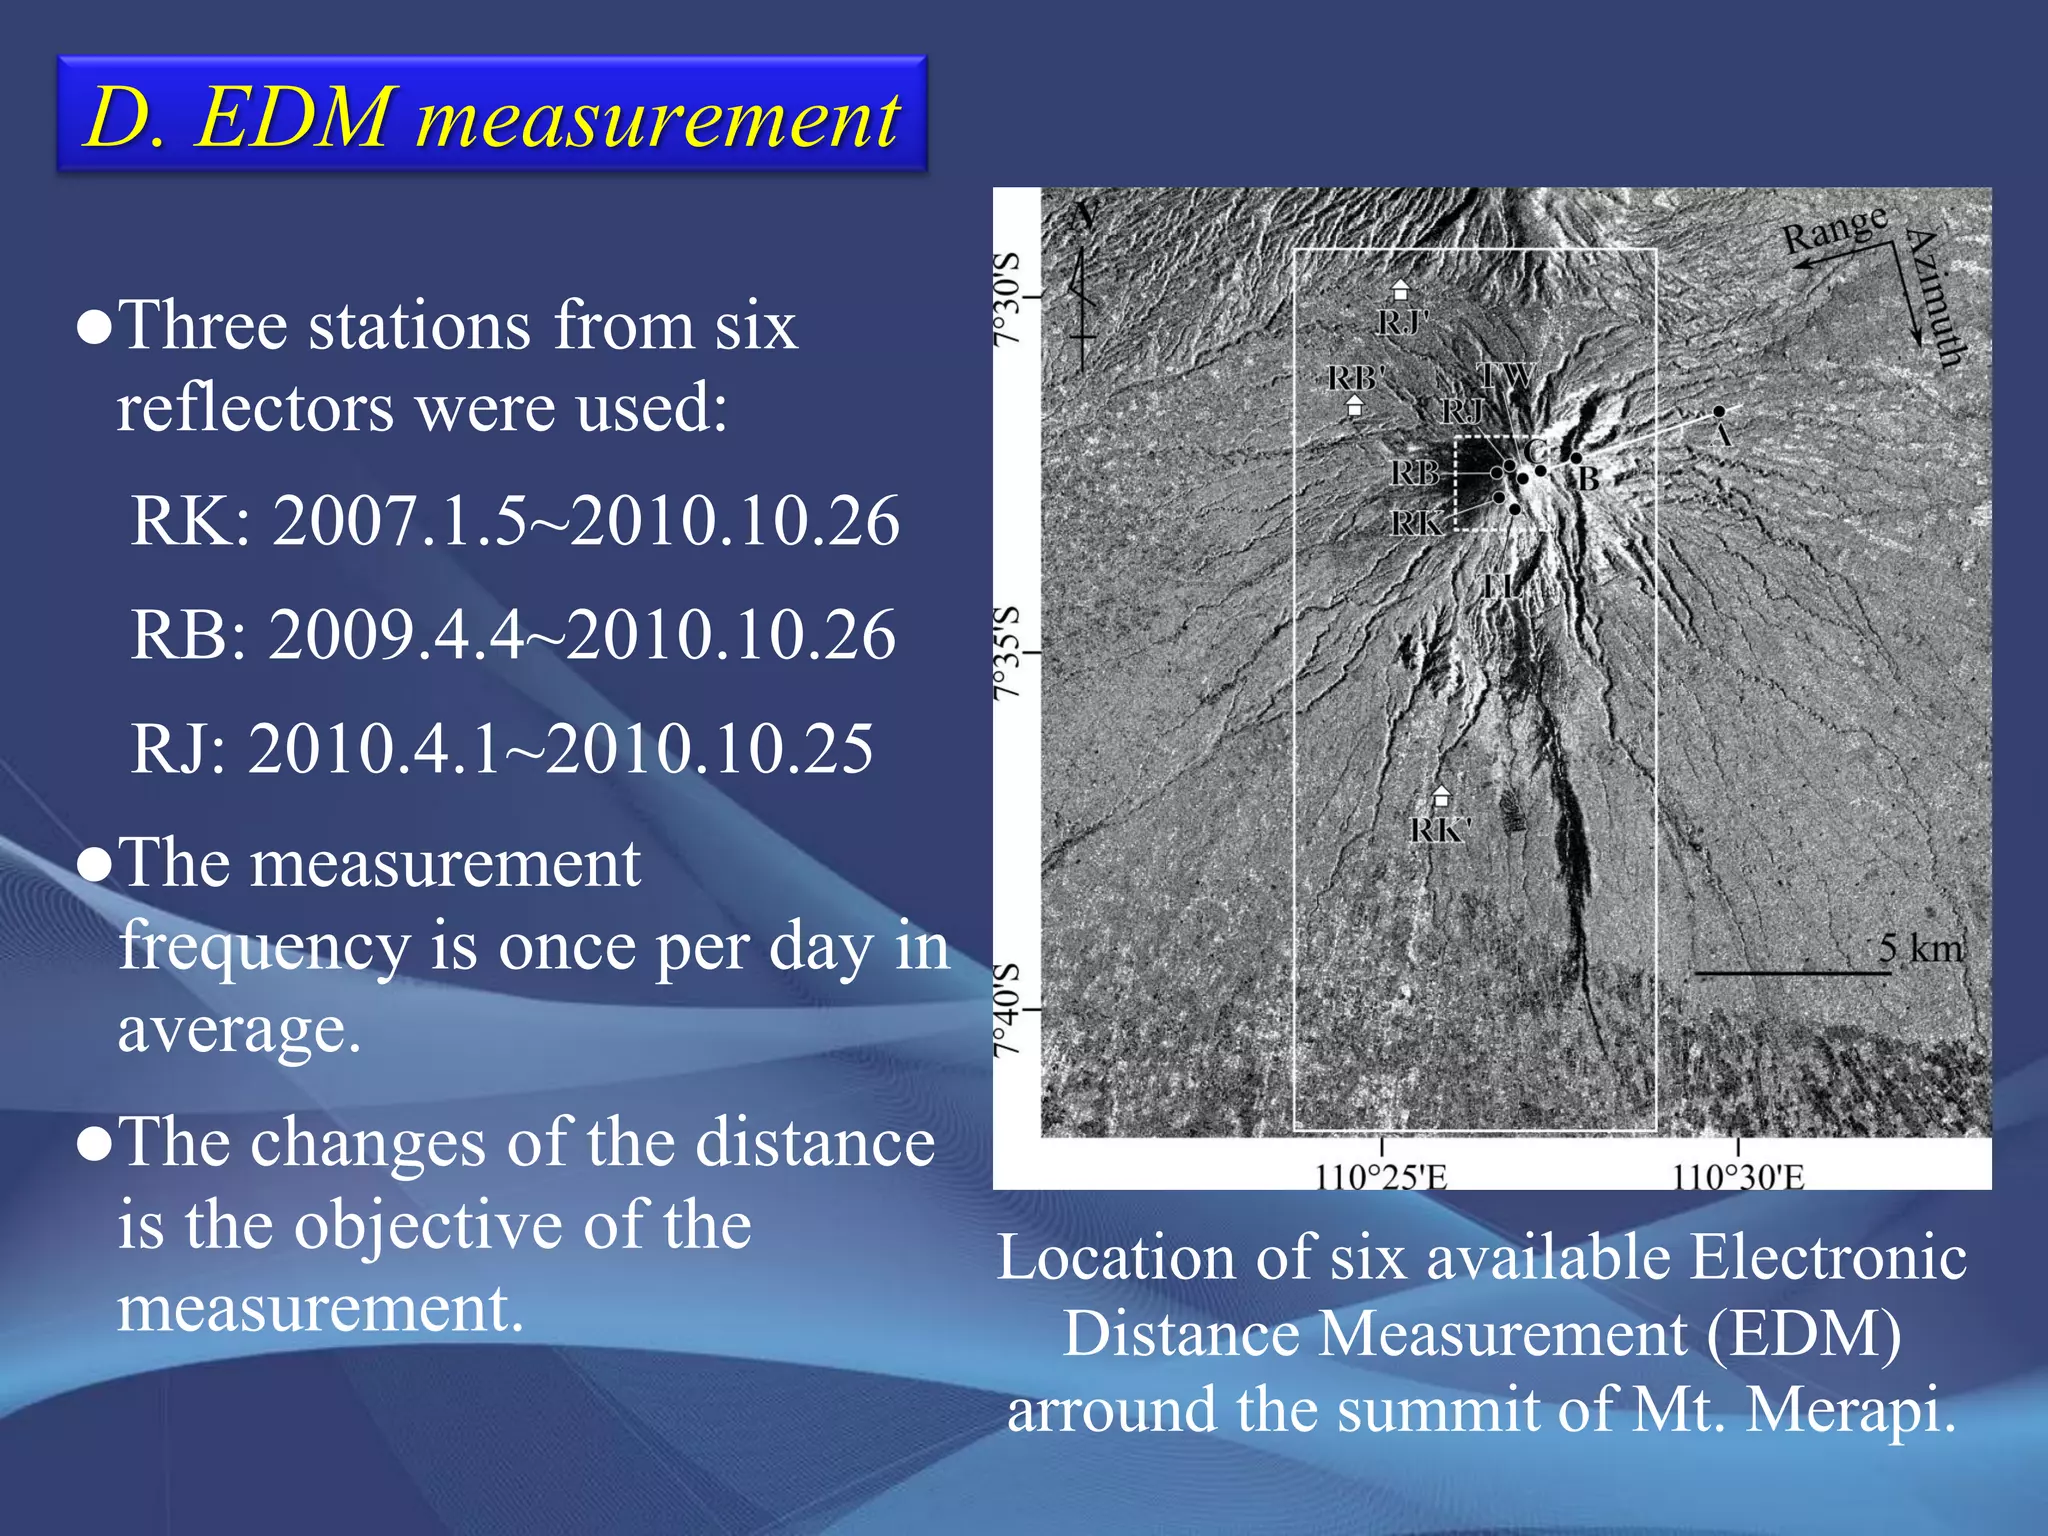
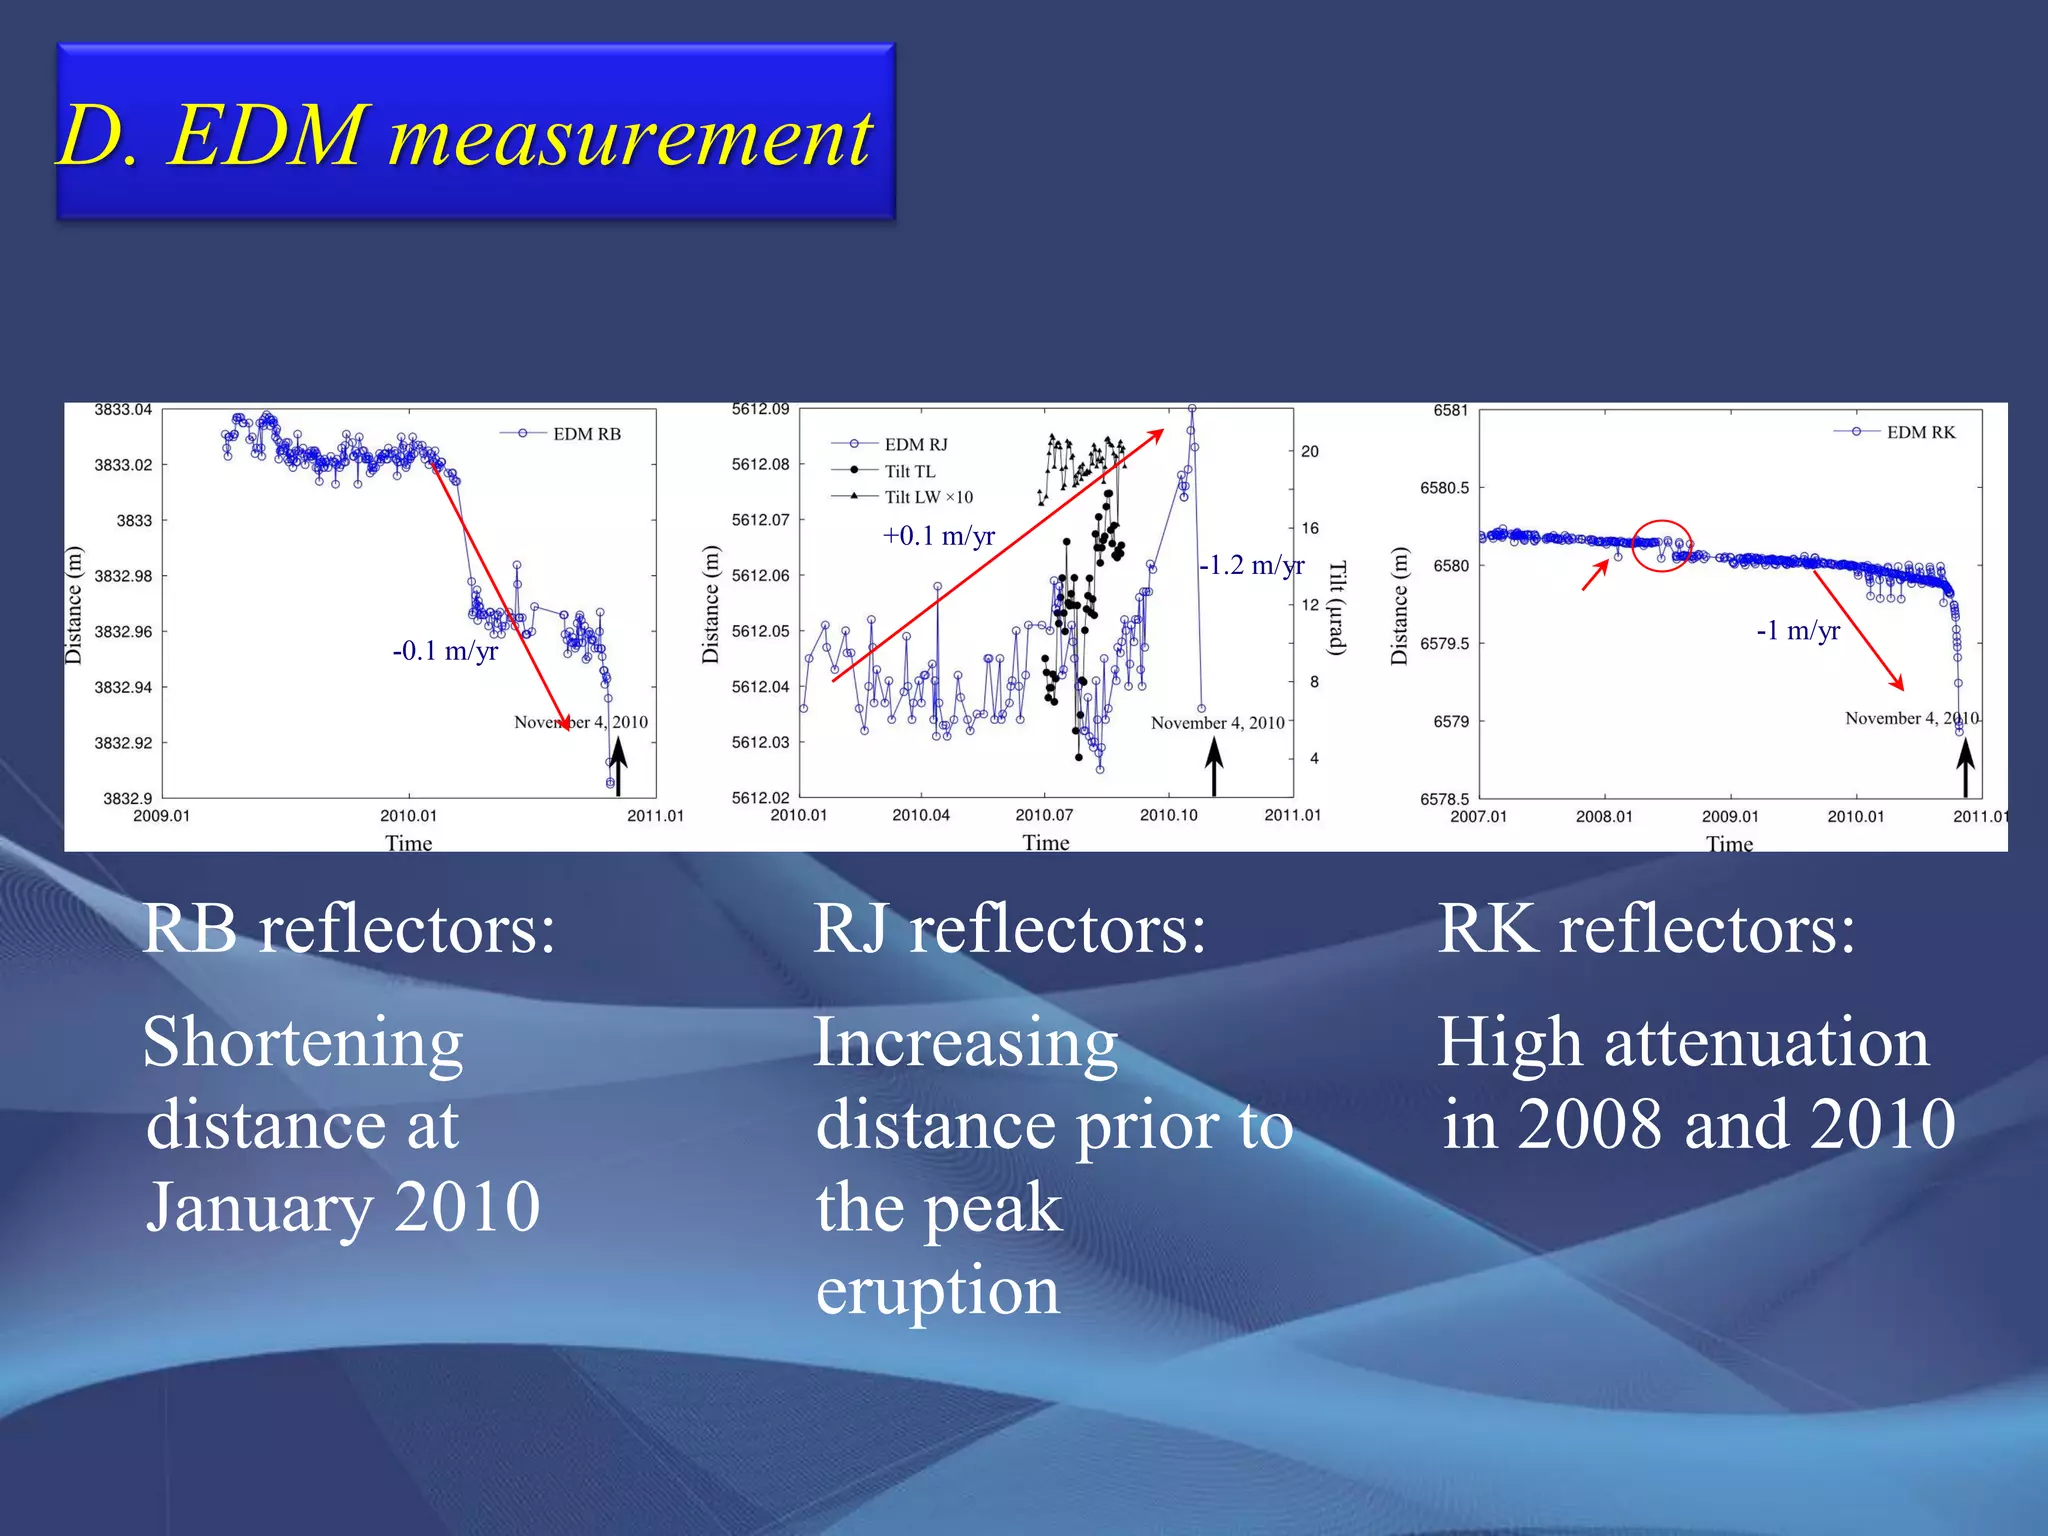
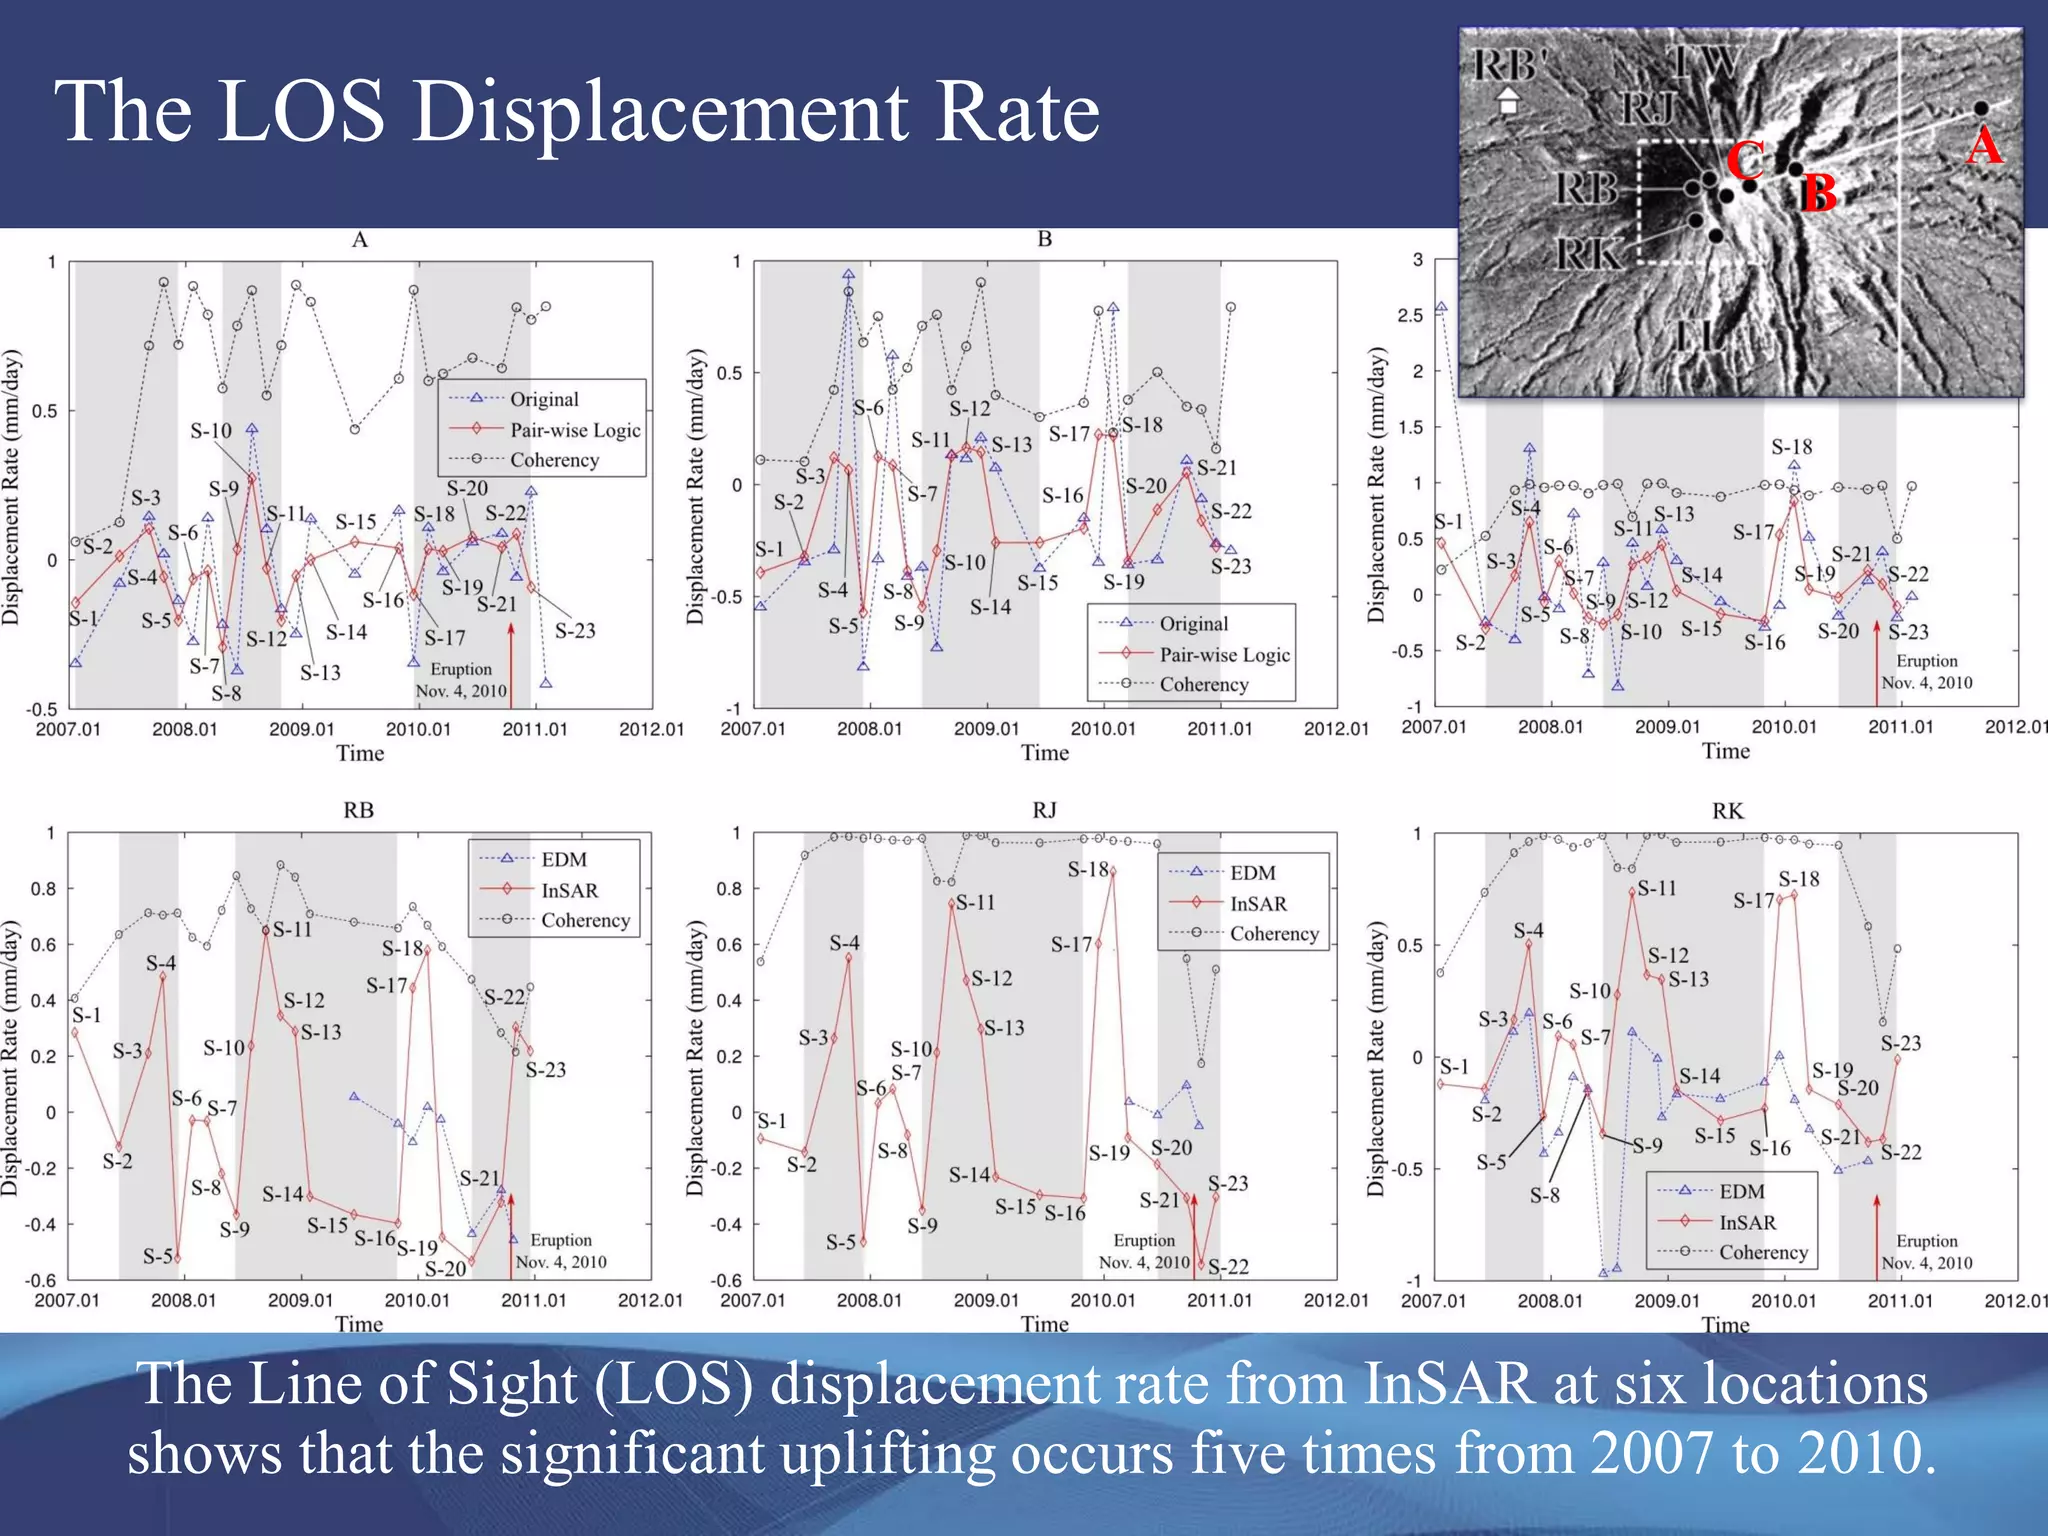
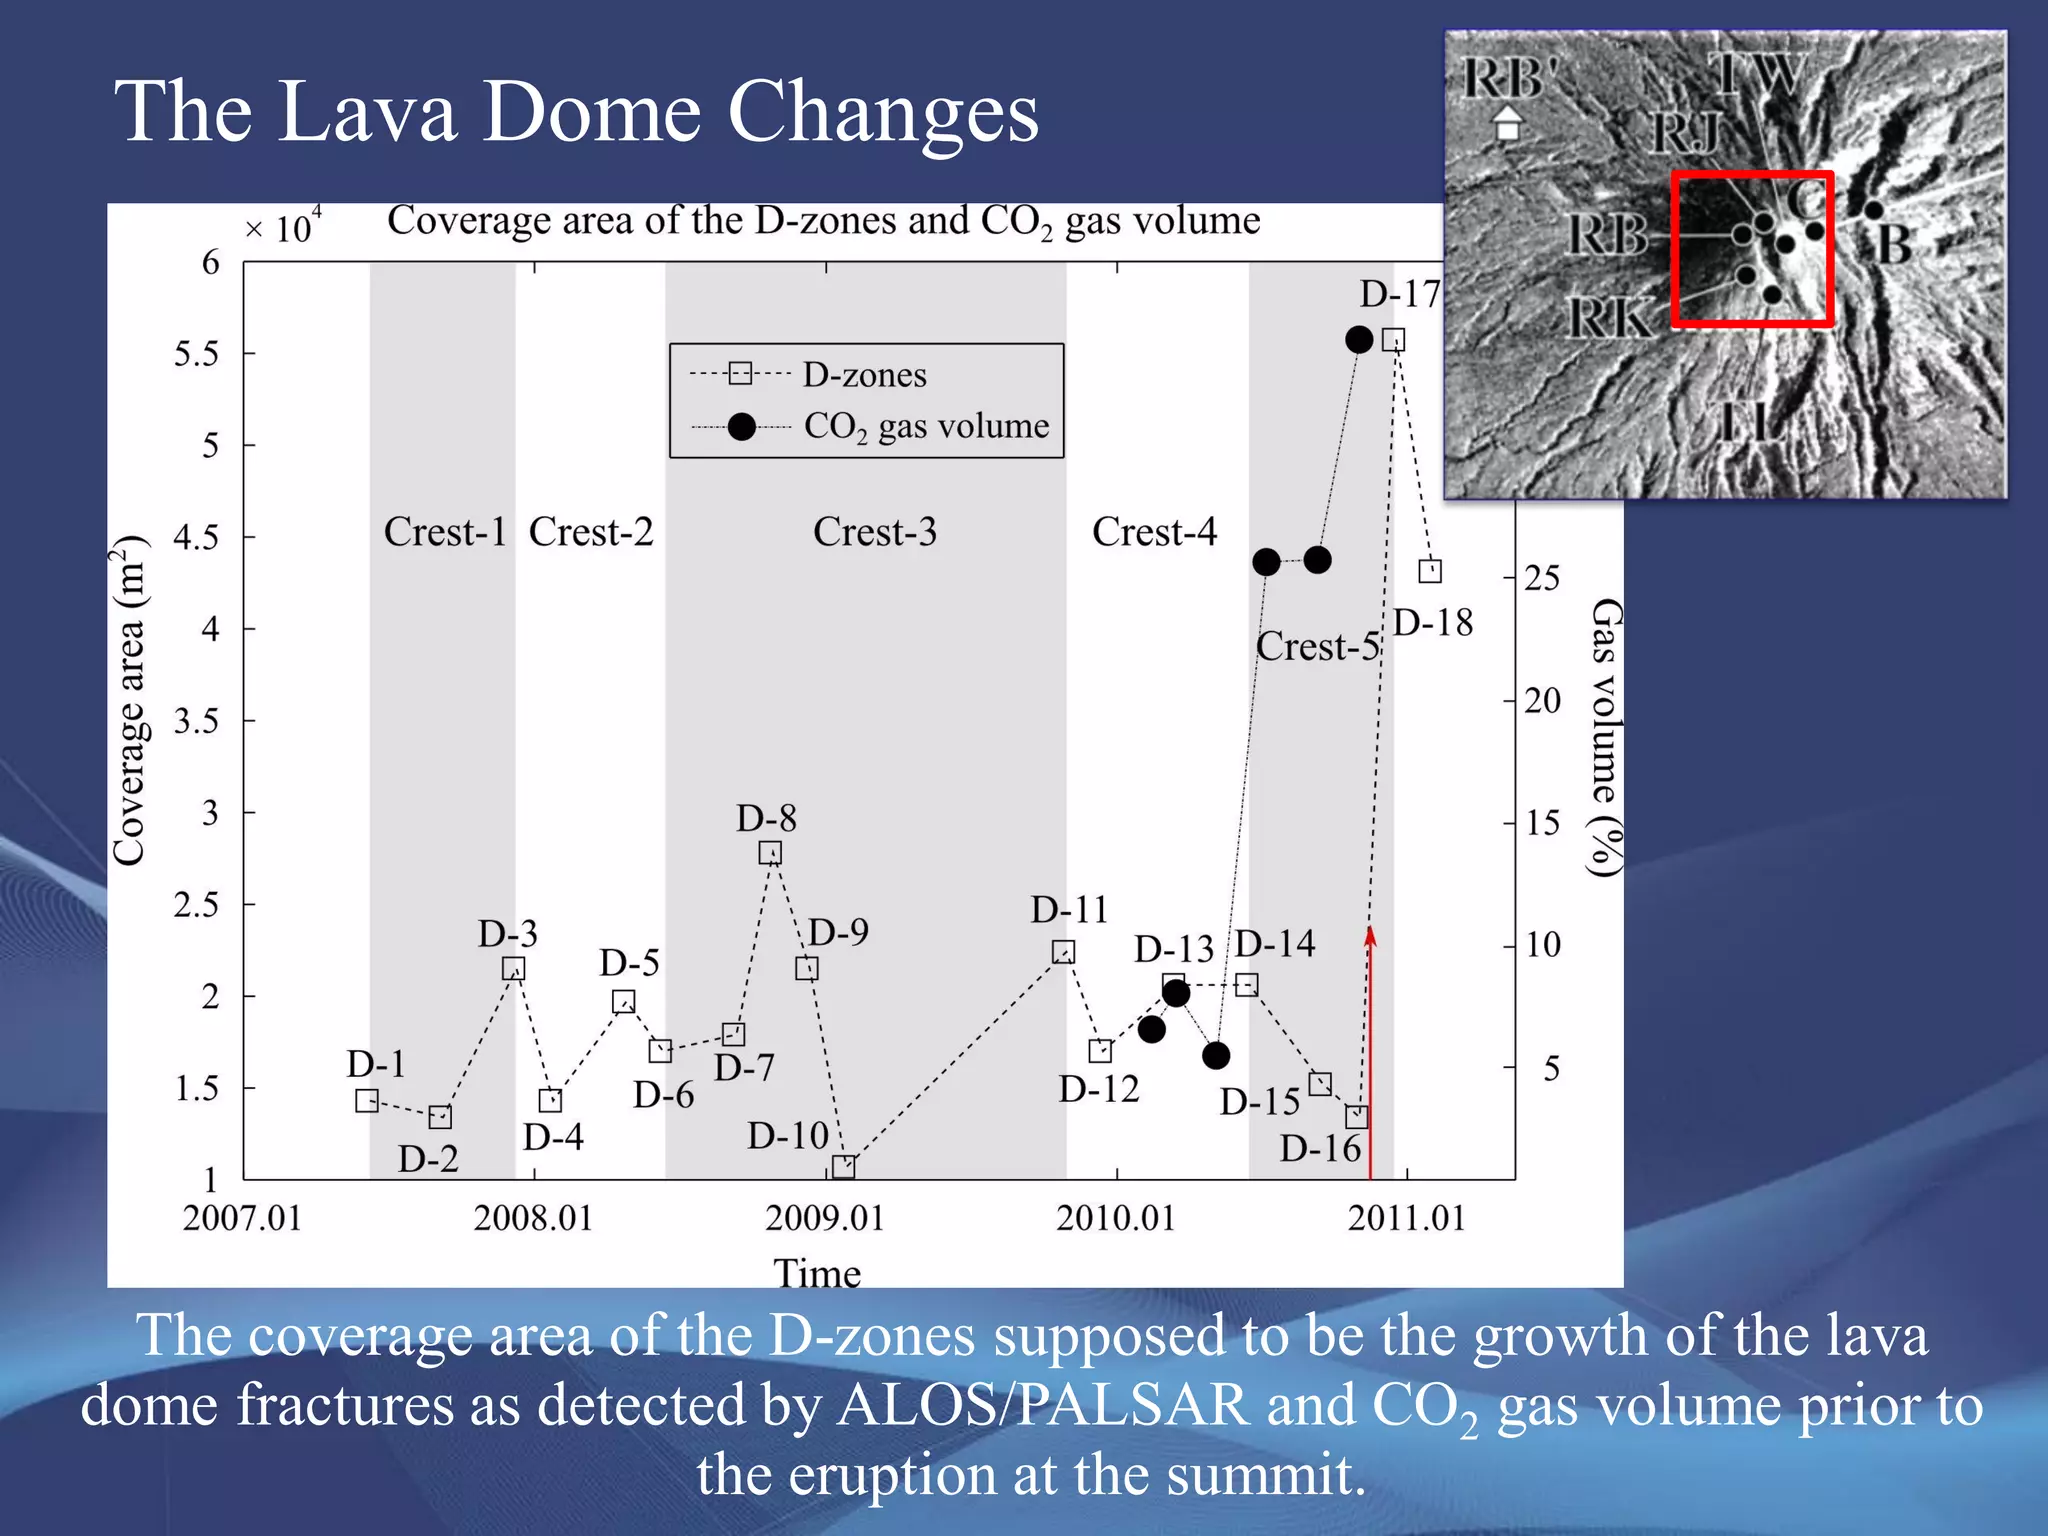
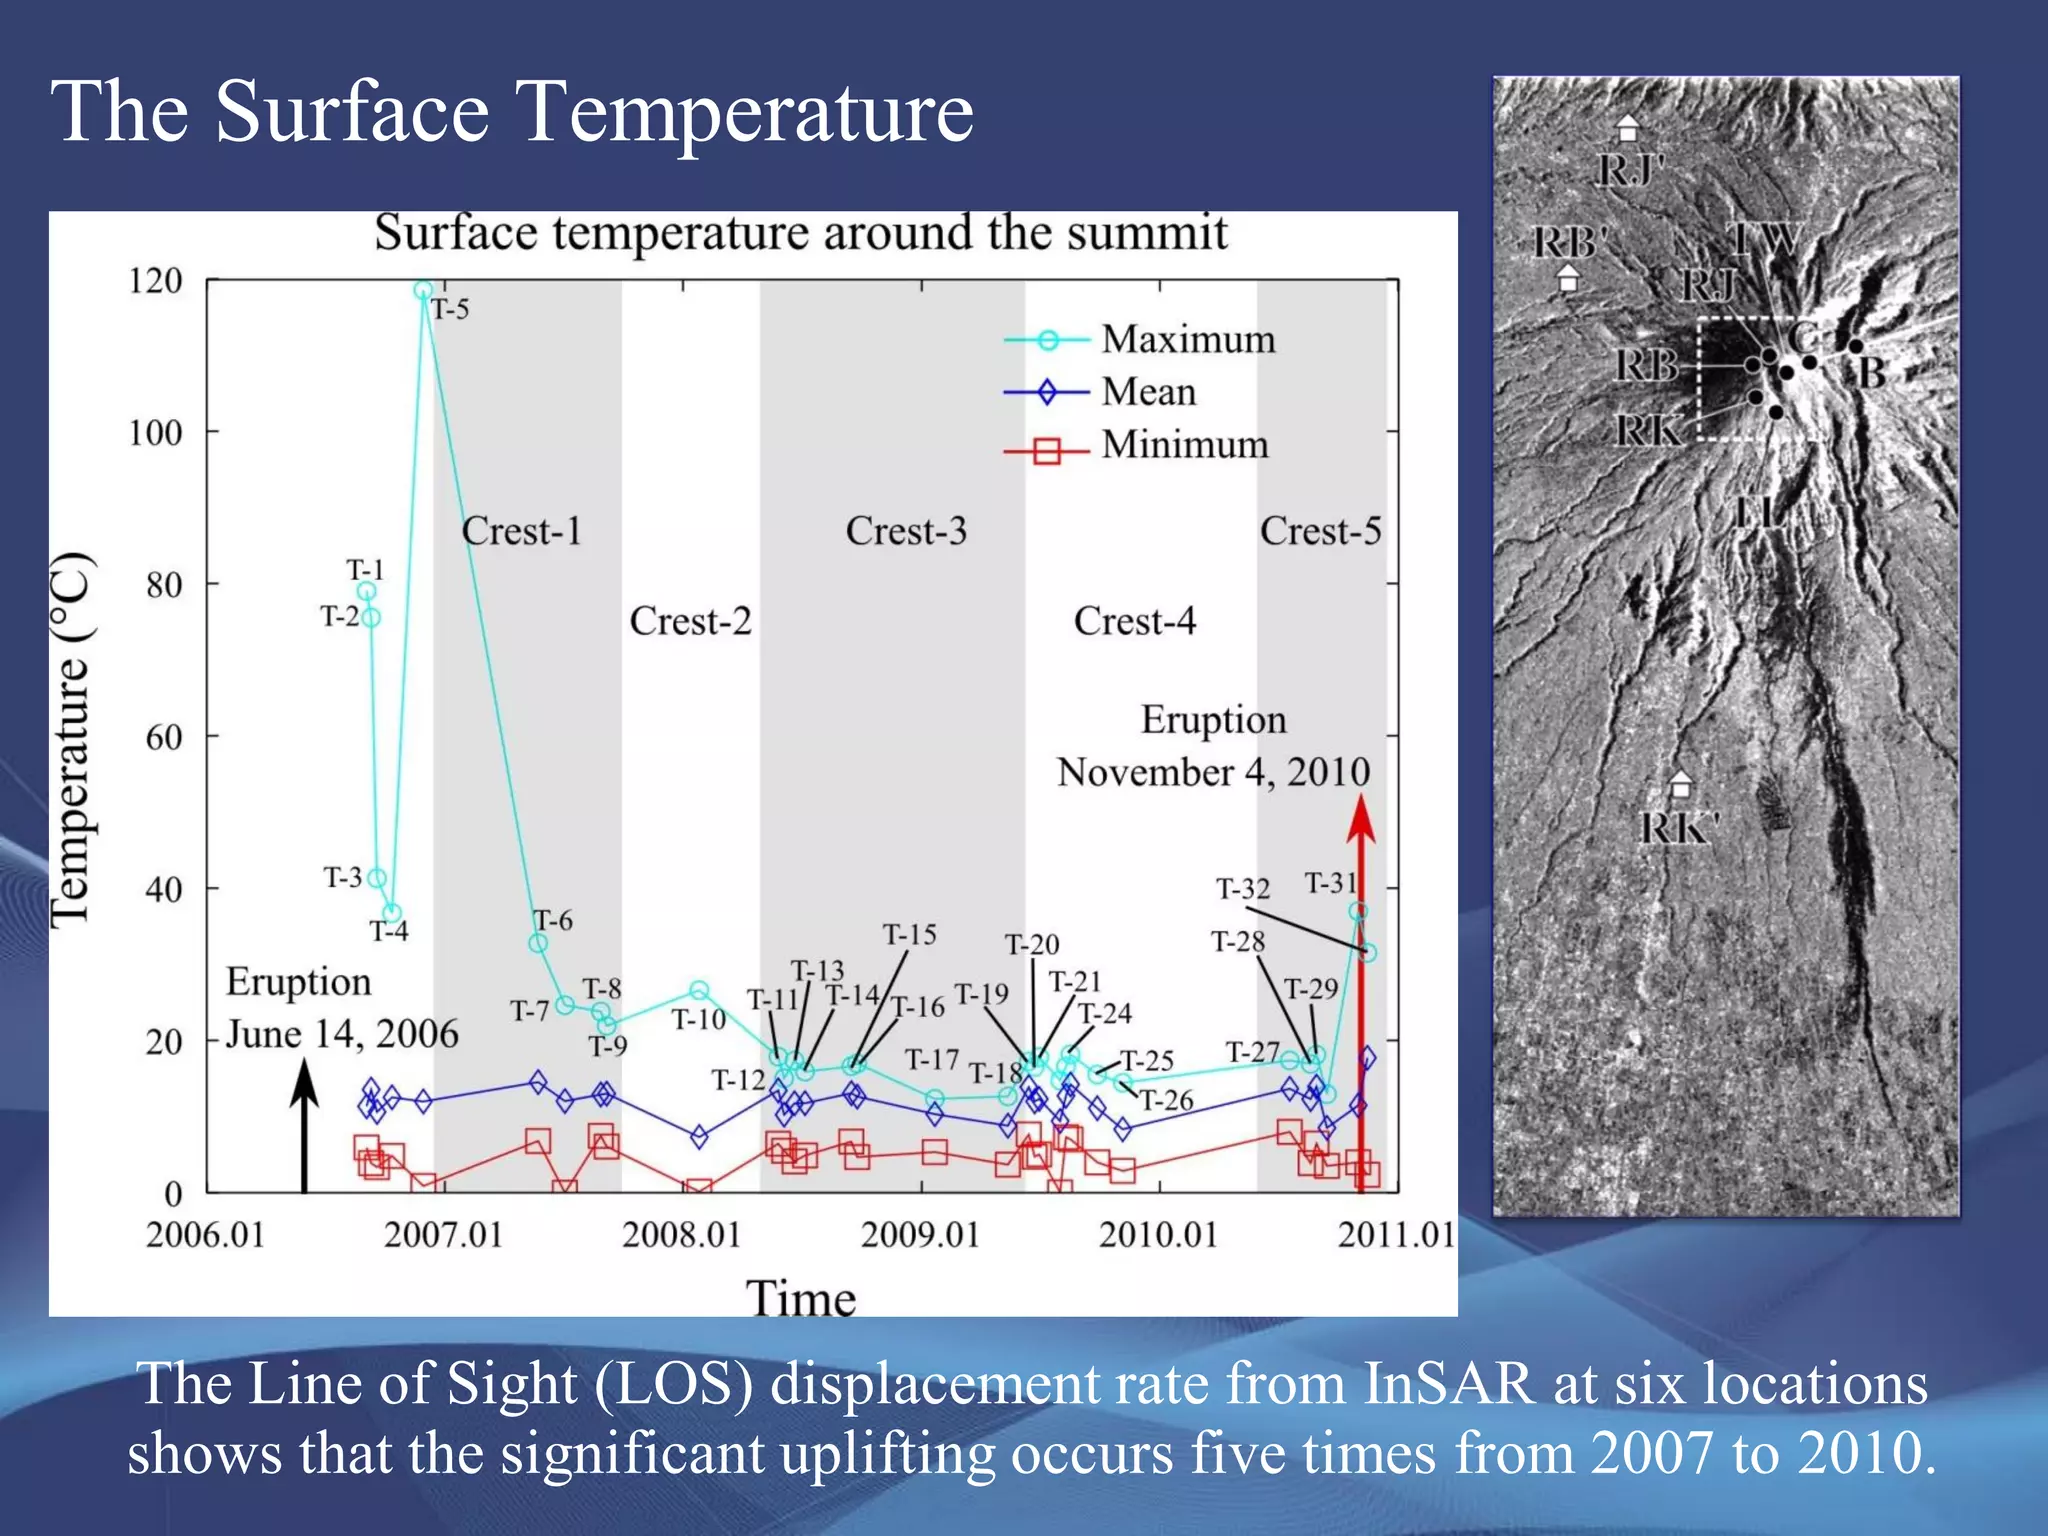
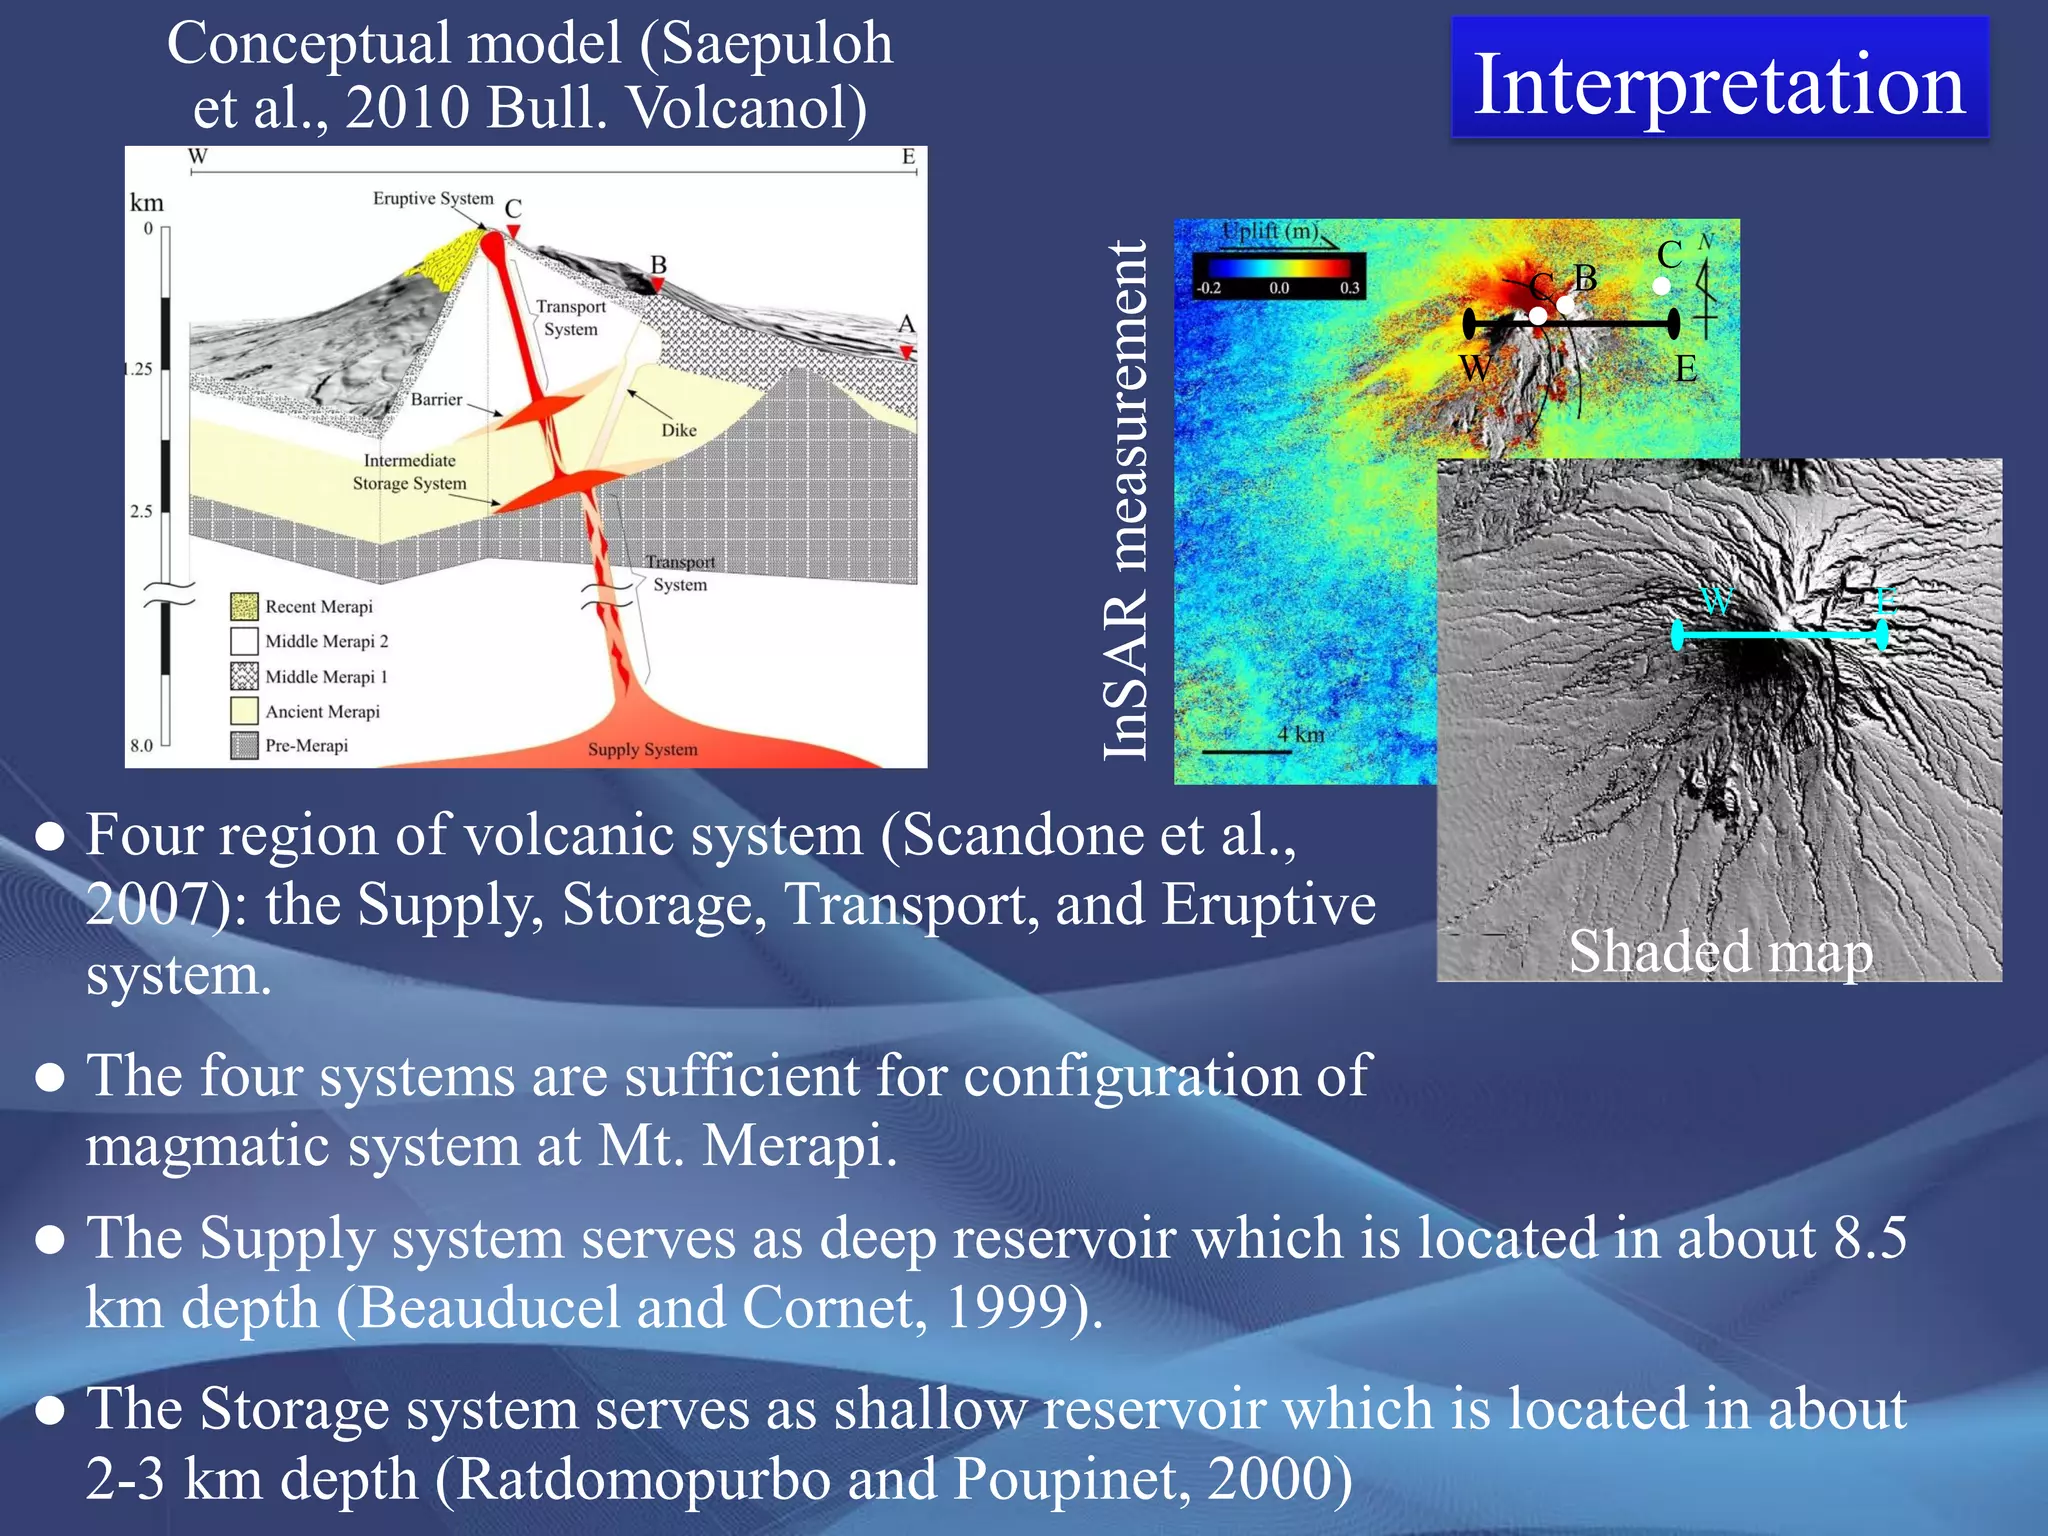
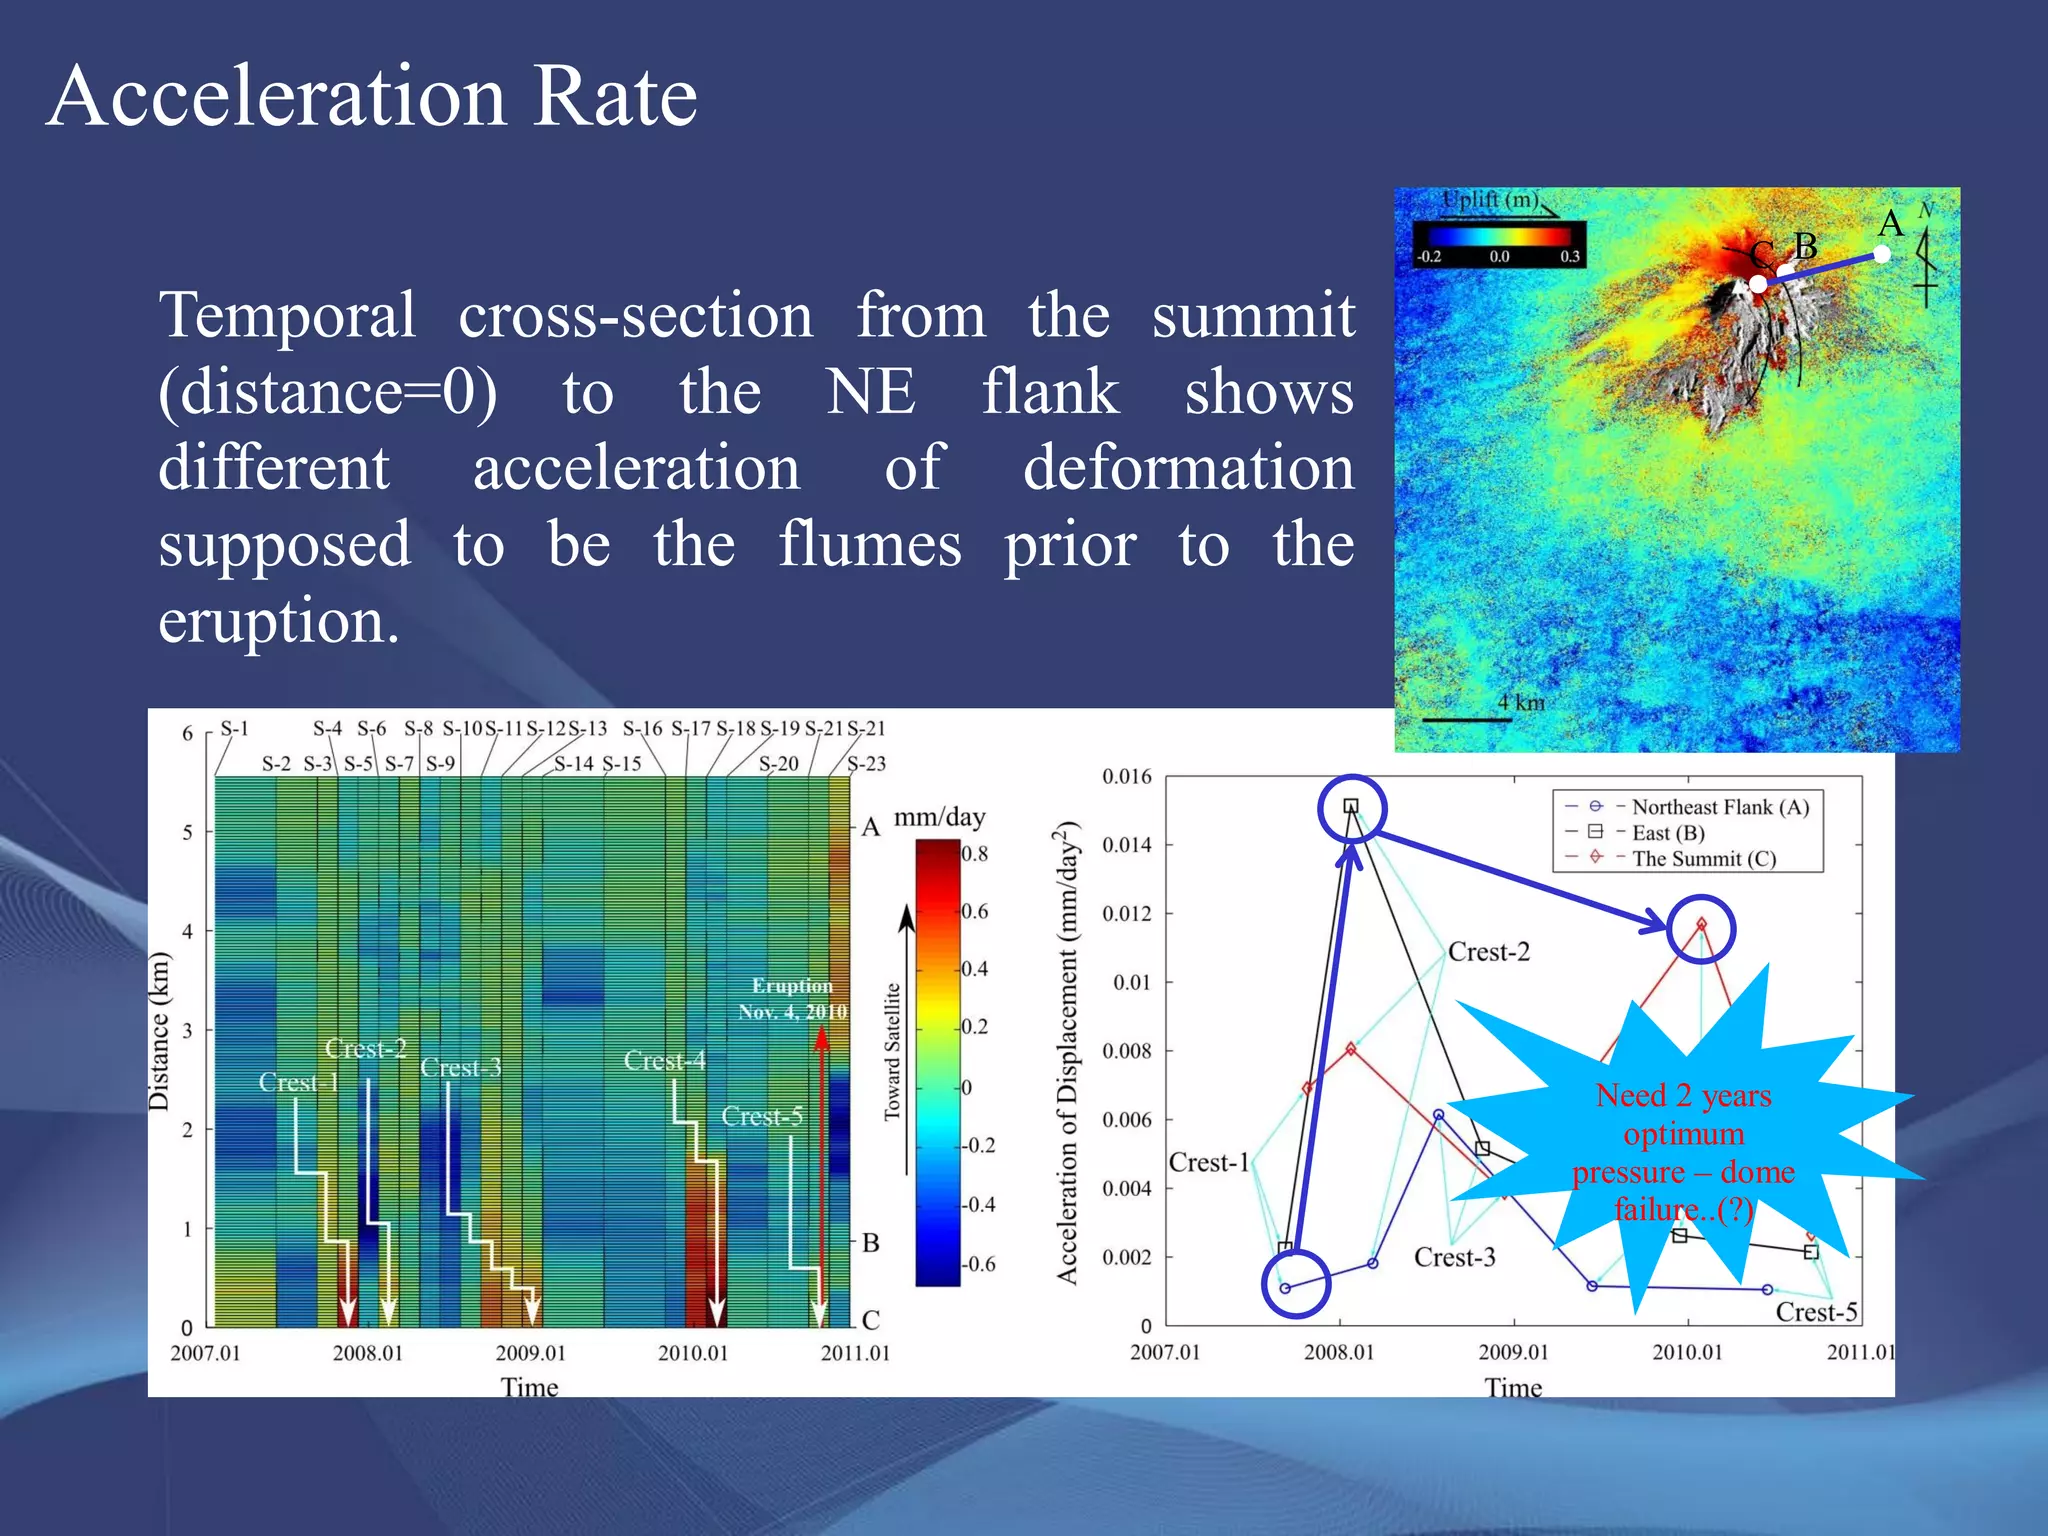
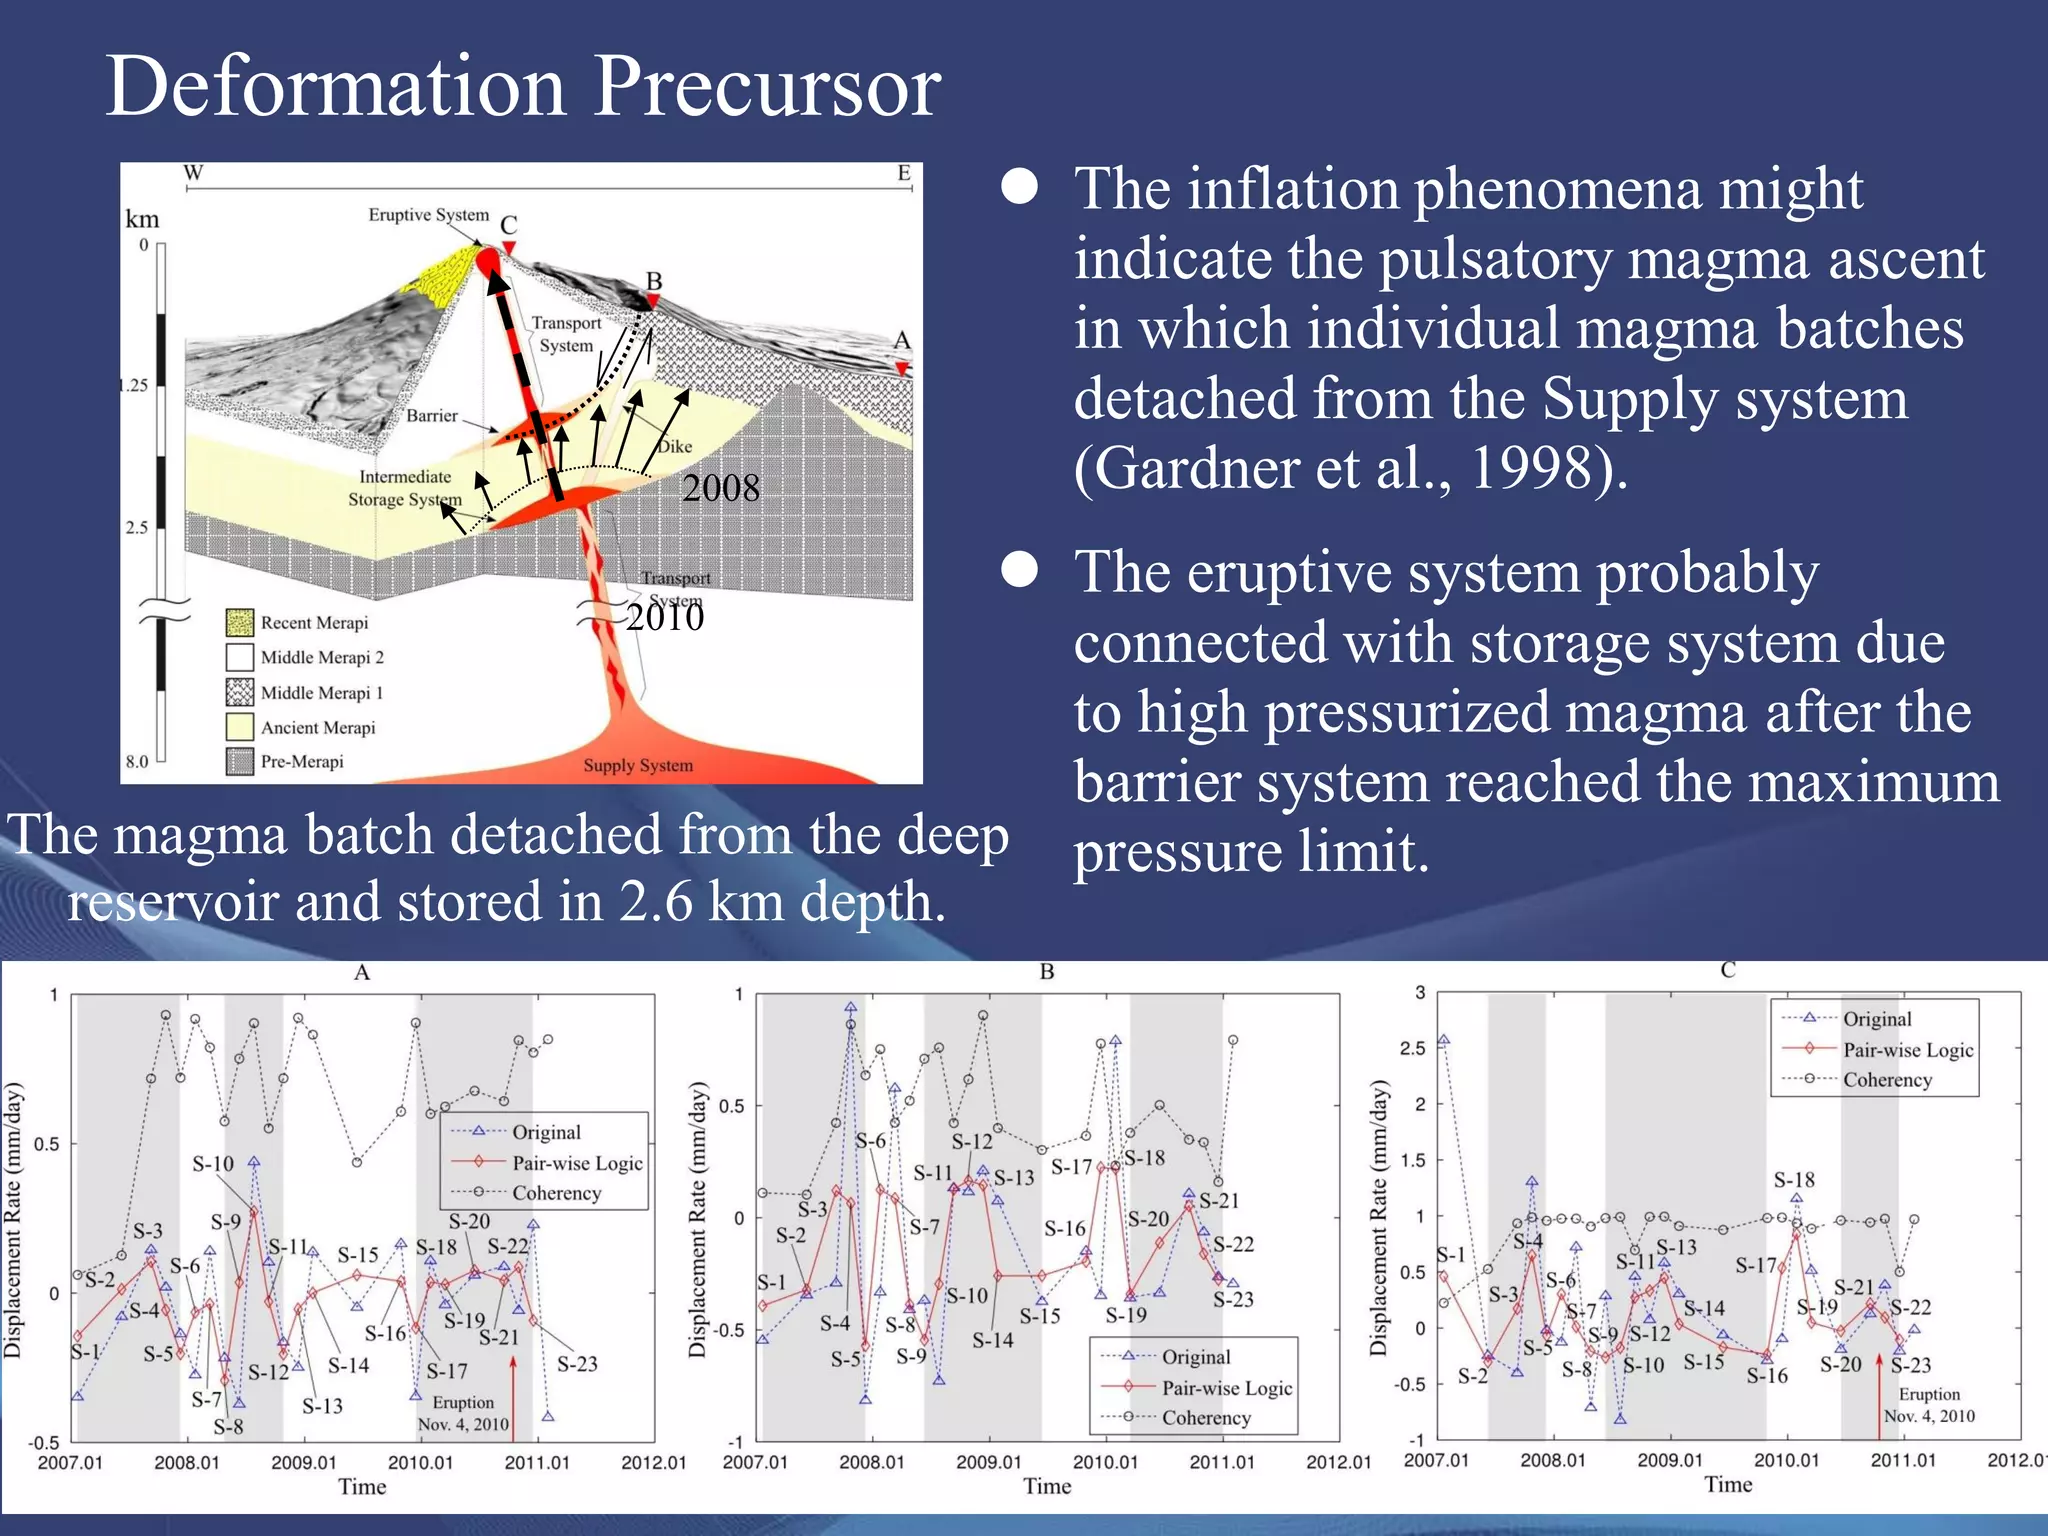
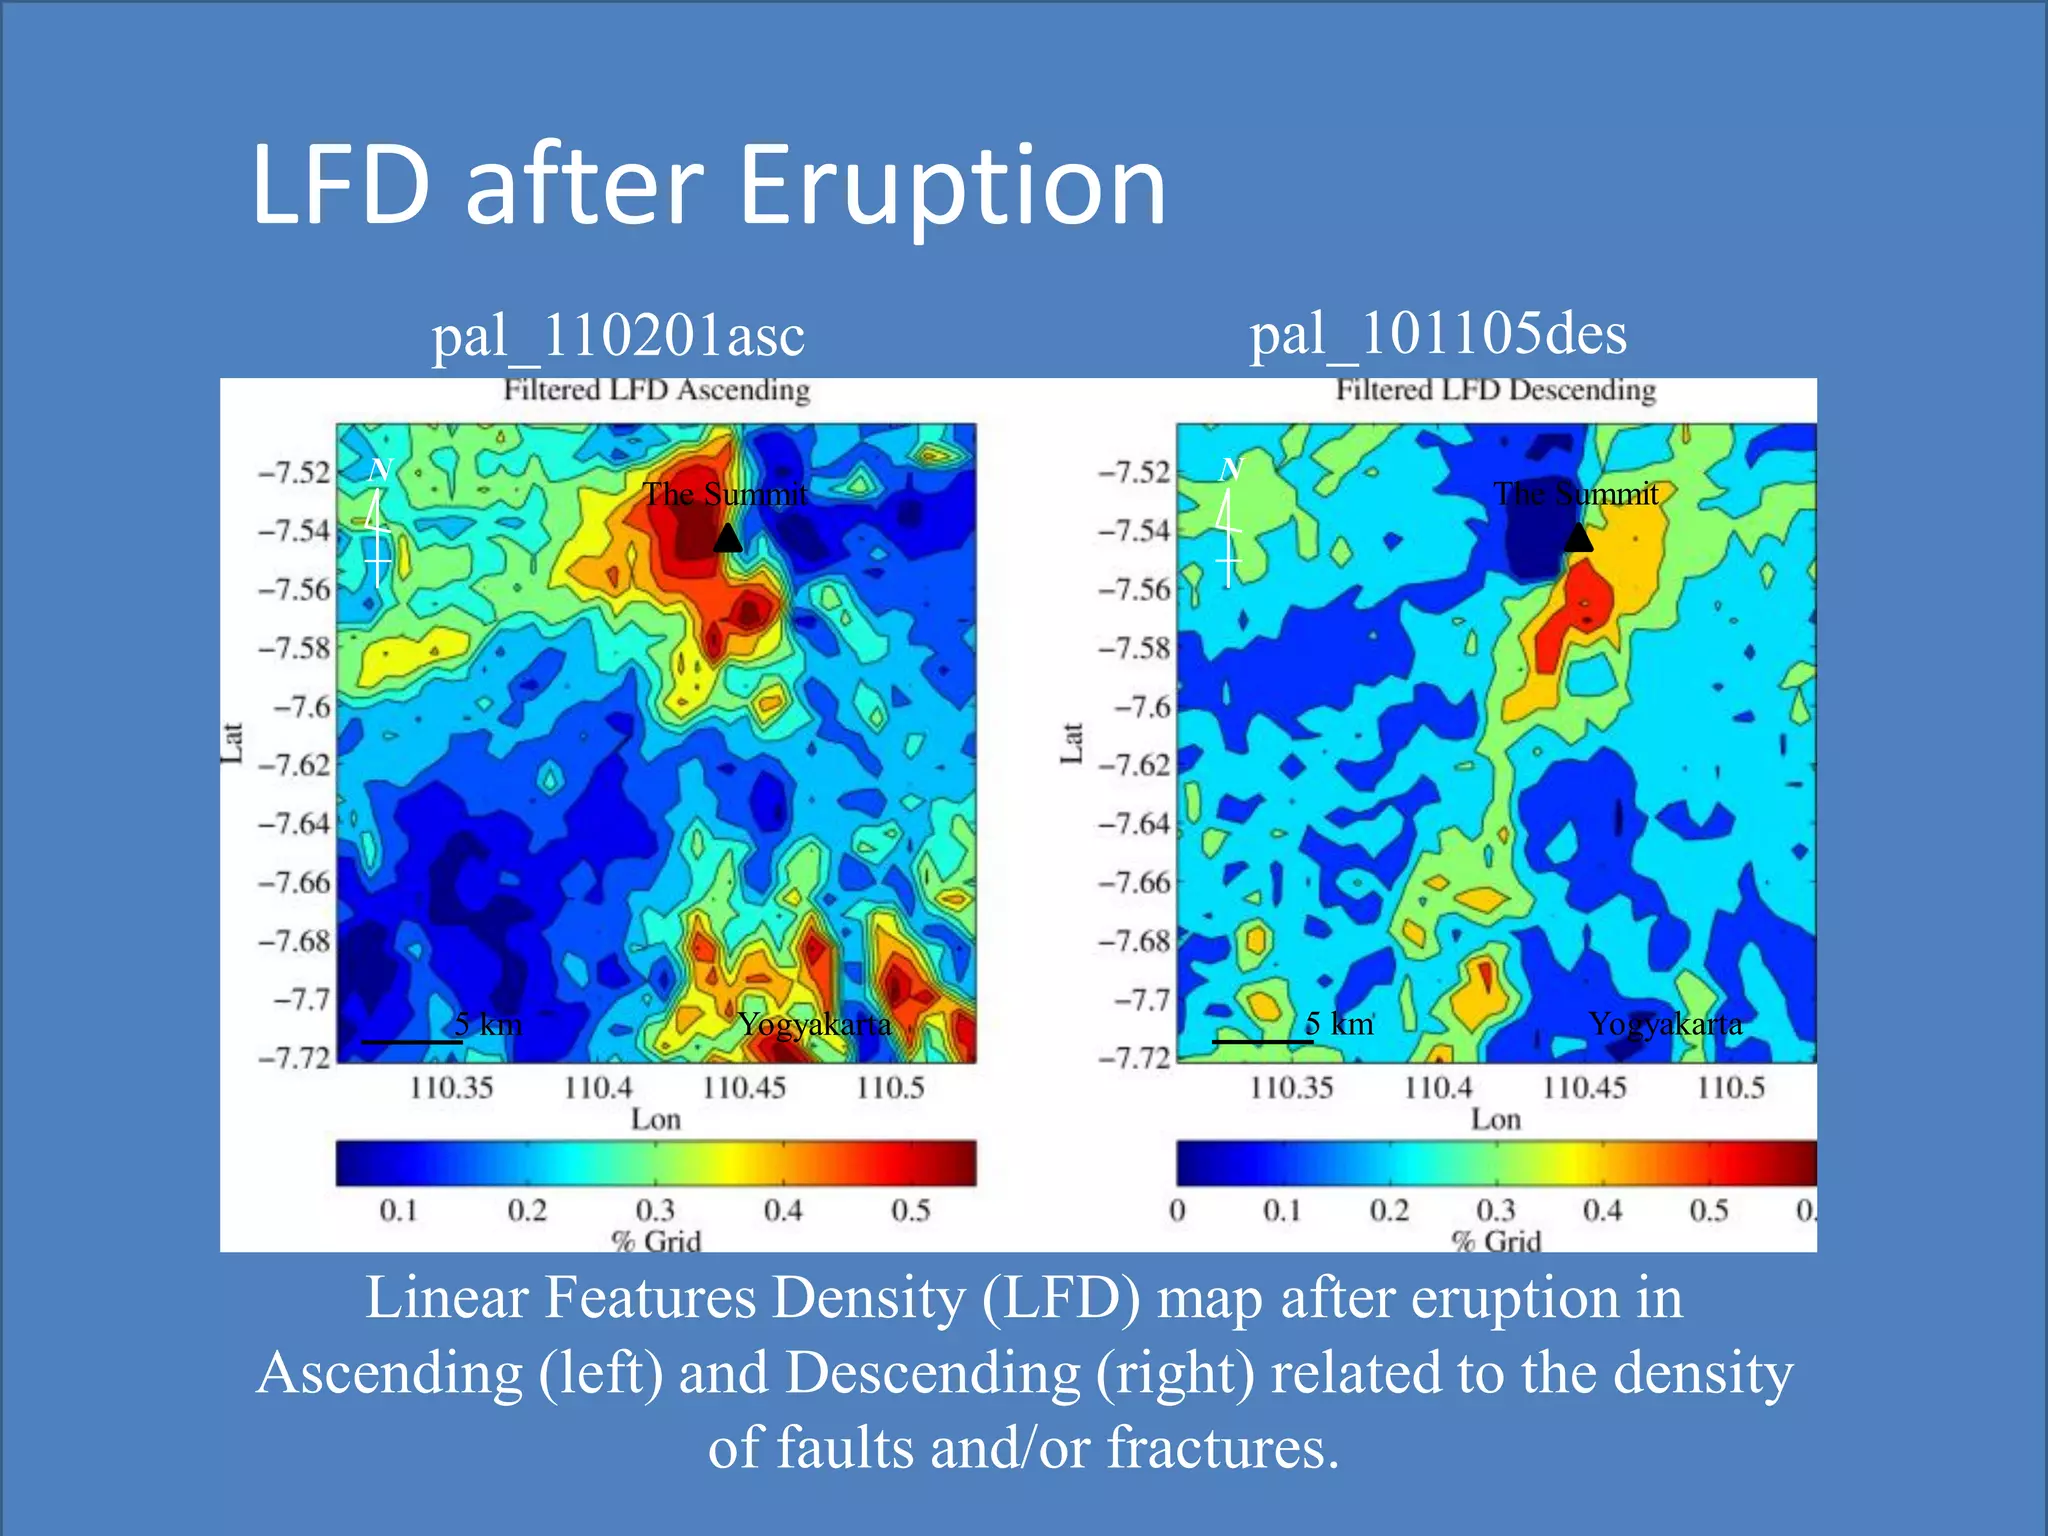
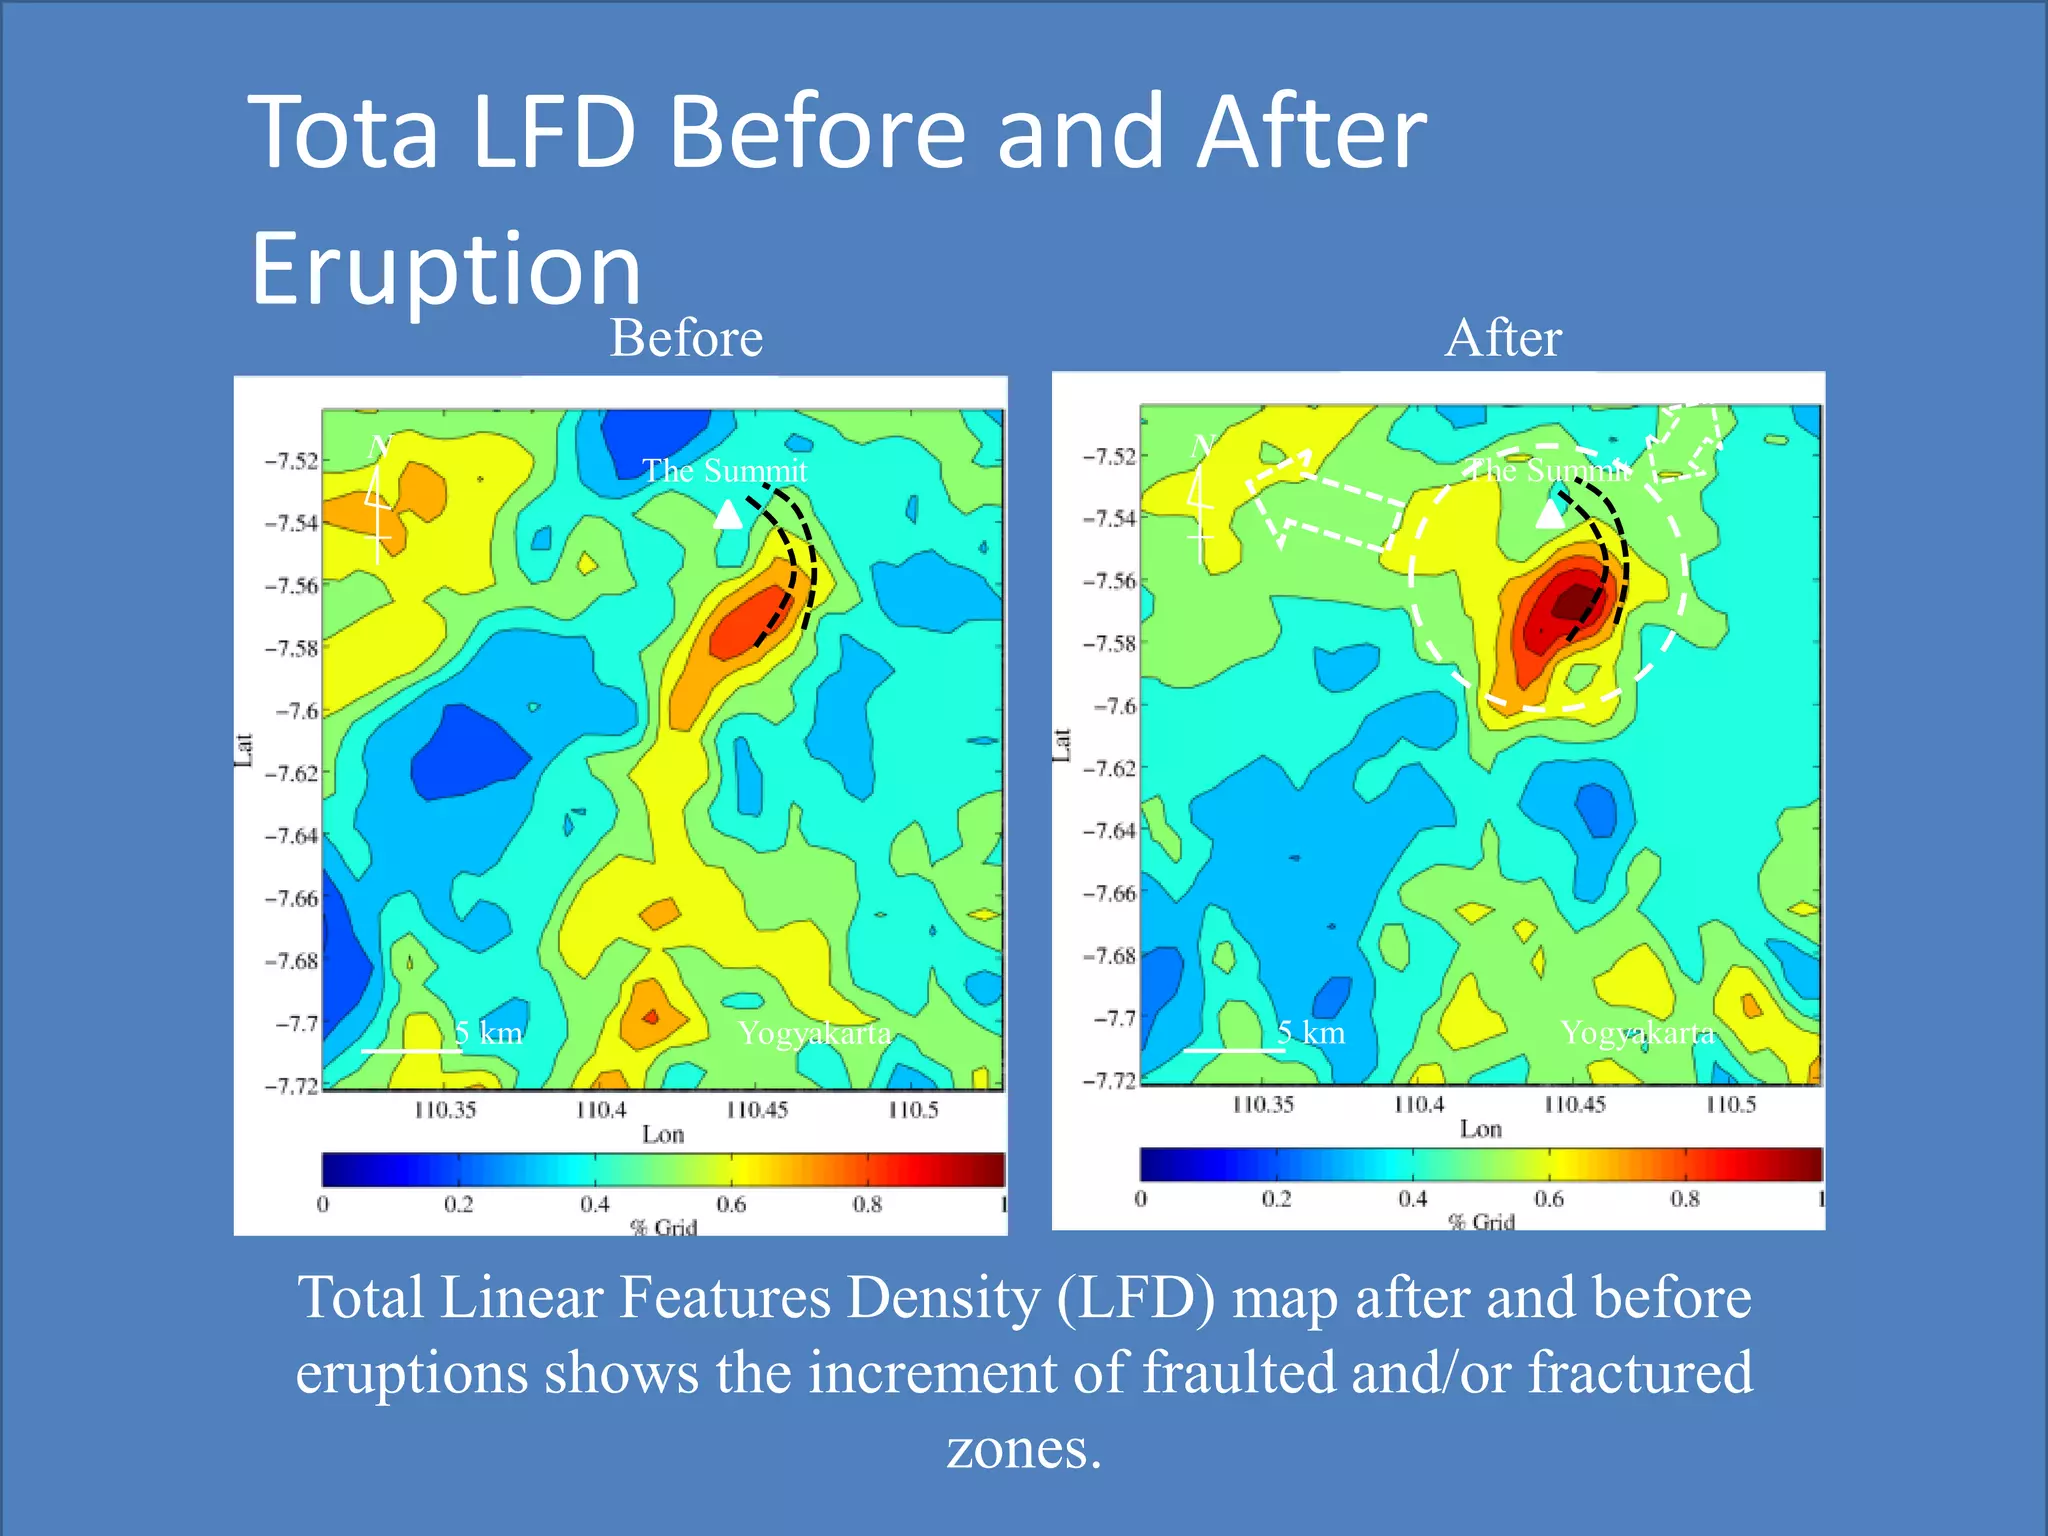

The document summarizes research using Synthetic Aperture Radar (SAR) data and other remote sensing data to characterize eruptions of Mount Merapi volcano in Indonesia over the last decade. SAR data from 1996-2006 was used to detect and analyze pyroclastic flow deposits from each eruption. ALOS/PALSAR SAR data observed the large 2010 eruption, detecting pyroclastic deposits 7 times larger than 2006. Interferometric SAR, thermal infrared data, and field measurements were used to analyze ground deformation, lava dome growth, and surface temperatures as precursors to the 2010 eruption. Inflation was detected in 2008 and 2010 via SAR interferometry.


