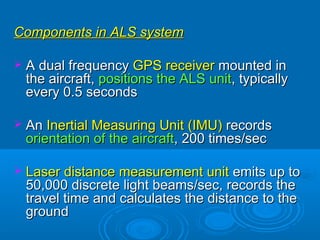
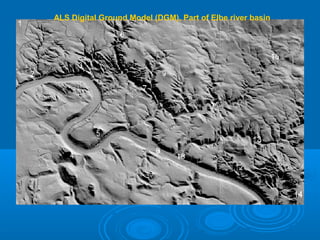
This document discusses airborne laser scanning (ALS) and its applications. It begins by defining ALS and its history. It then describes the key components of a typical ALS system, including a laser, scanner, GPS, IMU, and control units. It discusses how ALS measures distance and collects point cloud data. Application examples are given, such as generating digital terrain models and surface models over large areas. The document also includes a case study on using ALS and high-resolution satellite data to study geomorphic features in parts of the Elbe River valley in Germany.
Introduction to li dar technology advanced remote sensingBrightTimeStudio
This document provides an overview of LiDAR technology presented by Mr. Ashenafi B. It describes the components of a LiDAR system including lasers, scanners, GPS, and high-precision clocks. The principles of LiDAR are explained such as how it measures distance using time of flight and records location and orientation data. Different LiDAR types and platforms like airborne, terrestrial, and satellite are covered. Applications including DEM generation, forest inventory, and landslide analysis are listed. Advantages of LiDAR are high accuracy and weather independence while disadvantages include high costs and lack of foliage penetration.
The document summarizes various methods for detecting water hazards outdoors, including:
- Color imagery, which identifies water by its reflections but struggles with still water.
- Short wave infrared imagery, which detects water's dark appearance in infrared. However, performance degrades where water reflects vegetation or clouds.
- Thermal infrared imagery, where water appears cooler than terrain by day and warmer at night, but only detects the top water layer.
- Laser range finders can detect water through specular reflection but are limited by range and angle of incidence.
- Multi-feature methods combine cues like brightness, texture and range but require significant computation.
- Polarization imaging exploits water's polarized light reflection
WE3.L10.3: THE FUTURE OF SPACEBORNE SYNTHETIC APERTURE RADARgrssieee
The document discusses the history and future of spaceborne synthetic aperture radar (SAR). It summarizes key details of early SAR satellites like Seasat and missions since 1978. The text outlines future requirements like wider coverage, higher resolution, and new data products. It proposes concepts like bistatic SAR, polarimetric SAR interferometry, and 4D SAR tomography to measure changes in vegetation, ice, and other surfaces over time. Finally, it discusses ideas proposed by Kiyo Tomiyasu for compact antennas and GEO-LEO SAR configurations to enable more frequent global monitoring with high resolution.
Synthetic aperture radar uses an antenna mounted on a moving platform like an aircraft or satellite to synthesize a large antenna aperture and collect radar data to produce high-resolution 2D images of target objects. It works by sending out narrow radar pulses and receiving the echoes to determine distance and Doppler shift for speed, and processing multiple images to map terrain, monitor environments, and support military systems through polarimetry and interferometry techniques.
This study evaluated supervised land cover classification using PALSAR polarimetric interferometry (PolInSAR) data. Seven land cover classes were classified - water, paddy, crop, grass, forest, urban, and bare land. Classification accuracy was compared for four datasets: Quad-PolInSAR, Dual-PolInSAR, Quad-PolSAR, and Dual-PolSAR. Accuracy was highest for Quad-PolInSAR and lowest for Dual-PolSAR. Classification using a support vector machine (SVM) was more accurate than a Wishart classifier. PolInSAR classification performed best for forests, urban areas, bare land and water, while an optical land cover
SAR is a type of radar which works with antenna and receiver using radio waves which can create two dimension or three dimension of the objects . A synthetic-aperture radar is an imaging radar mounted on a moving platform. SAR gives high resolution data and works 24*7.
Synthetic Aperture Radar (SAR) uses signal processing techniques to synthesize a large antenna from data collected by a physically small antenna as it moves along a flight path. This allows SAR to achieve high-resolution images independent of altitude. SAR transmits microwave pulses and analyzes the returned echoes to build up images of the terrain. SAR has various applications including topographic mapping and measuring ocean waves, currents, and wind. Ocean backscatter measured by SAR is influenced by surface roughness driven by factors like wind as well as hydrodynamic effects of waves and currents.
This document provides an overview of synthetic aperture radar (SAR). SAR uses motion of a radar antenna mounted on a moving platform to synthesize a large antenna and create high-resolution radar images. It describes the basic principles of SAR, including how successive radar pulses are transmitted and echoes received to build up an image. Applications of SAR include remote sensing, mapping, and monitoring changes over time. Spectral estimation techniques are used to process SAR data and improve resolution. Polarimetry and interferometry are additional SAR techniques. Typical SAR systems are mounted on aircraft or satellites.
Eng remote sensing and image measurementWataru Ohira
Remote sensing uses sensors on platforms like satellites or aircraft to collect imagery and geospatial data of the Earth. Various sensors can extract different types of information like color, geometry, or 3D coordinates using principles like stereo imagery. Mathematical models like collinearity equations relate image coordinates to ground coordinates. Sensor position and attitude can be estimated using ground control points. 3D measurements are possible with stereo imagery. Different sensor types exist for applications like vegetation monitoring, land use mapping, and disaster monitoring.
This document provides an overview of synthetic aperture radar (SAR) basics and theory. It discusses key aspects of SAR including how it works, imaging geometry, spatial resolution, backscatter coefficients, common frequency bands, and advanced modes. SAR uses microwave radiation and can image the Earth's surface in all weather and light conditions, providing complementary data to optical remote sensing. It discusses concepts such as range and azimuth resolution, factors that influence backscatter, and challenges like speckle that SAR addresses through techniques like multi-look processing.
This document compares aerial photography and satellite remote sensing. [1] Aerial photography uses cameras mounted on aircraft to capture overlapping photos at fixed altitudes, while satellites capture continuous image strips from orbit. [2] Aerial photography provides higher resolution images but is limited by weather and environment, while satellites can image any location but provide lower resolution. [3] Both techniques image the electromagnetic spectrum, but satellites can capture non-visible data like infrared and radar not restricted by time of day.
This document discusses how Interferometric Synthetic Aperture Radar (InSAR) works to measure ground deformation. It explains that InSAR uses the phase difference between two SAR images of the same area taken at different times to detect millimeter-scale changes in the distance to ground targets. It provides examples of how InSAR has been used to measure subsidence from earthquakes and other natural hazards. The document also notes some limitations of InSAR related to decorrelation from changes on the ground surface and in the atmosphere between image acquisitions.
The document provides an overview of remote sensing techniques used in civil engineering projects. It discusses (1) the electromagnetic spectrum used for remote sensing, including microwave and radar bands; (2) active and passive microwave sensing methods such as SAR; and (3) applications like flood mapping, soil moisture monitoring, and landslide prediction. The document is a useful primer on how remote sensing and GIS technologies can support infrastructure and environmental monitoring.
This document discusses active and passive remote sensing sensors. It defines sensors as devices that record reflected or emitted energy without contacting the target. Sensors are classified as active or passive, with active sensors providing their own illumination and passive sensors detecting natural energy. Examples of active sensors include RADARSAT-1 and LISS-1, while examples of passive sensors are SPOT-1 and LANDSAT-1. The key difference is that active sensors can collect data day or night, while passive sensors rely on natural illumination. Applications and advantages and disadvantages of each type are also summarized.
This document discusses synthetic aperture radar (SAR) and its use in remote sensing applications. SAR uses signal processing to simulate a large physical antenna on an airborne or spaceborne platform. As the platform moves, SAR collects and combines radar return signals to generate high-resolution imagery of the terrain below. Key aspects of SAR discussed include cross-range resolution, sequential generation of the synthetic antenna aperture, and phase correction to focus the SAR image. Applications mentioned include military reconnaissance, oceanography, geology, surveillance, and environmental monitoring.
This document provides an overview of remote sensing including:
1. The history of remote sensing from early aerial photography to modern satellite systems.
2. The principles of electromagnetic radiation and how different sensors capture radiation in various parts of the spectrum to analyze objects.
3. The various types of remote sensing platforms, sensors, and resolutions including spatial, spectral, temporal, and radiometric and how they provide information.
4. Common applications of remote sensing like land use mapping, change detection, environmental monitoring, and more.
This presentation consist of remote sensing, types of remote sensing and also about the radiometers systems. I have also discussed about the types of radiometers system and how it work. I have also discussed about the principle on which it works. Also I have discussed about the applications .
Side-looking airborne radar (SLAR) forms microwave images of terrain by transmitting radar beams from the side of an aircraft. SLAR uses the Doppler effect to measure target velocity and provides resolution determined by pulse length and antenna beam width. Synthetic aperture radar (SAR) is an advanced version of SLAR that records frequency differences from multiple antenna positions to synthesize higher resolution images, as if from a larger antenna, by processing returned signals over time. SAR allows for high-resolution imaging of terrain from aircraft or spacecraft.
Scanners, image resolution, orbit in remote sensing, pk maniP.K. Mani
This document provides information about different types of satellite orbits and sensors. It discusses polar orbits, geostationary orbits, and examples of weather satellites like METEOSAT, NOAA, and GOES that use these orbit types. It also describes imaging sensors on these satellites and their specifications. Sensors on other platforms like Landsat, SPOT, ERS, and Radarsat are outlined along with their characteristics and applications. Scanning techniques for collecting multispectral data like across-track and along-track scanning are defined.
Multispectral remote sensors such as the Landsat Thematic Mapper and SPOT XS produce
images with a few relatively broad wavelength bands. Hyperspectral remote sensors, on the
other hand, collect image data simultaneously in dozens or hundreds of narrow, adjacent
spectral bands. These measurements make it possible to derive a continuous spectrum for each
image cell, as shown in the illustration below. After adjustments for sensor, atmospheric, and
terrain effects are applied, these image spectra can be compared with field or laboratory
reflectance spectra in order to recognize and map surface materials such as particular types of
vegetation or diagnostic minerals associated with ore deposits.
WE3.L10.4: KIYO TOMIYASU, CO-SEISMIC SLIP AND THE KRAFLA VOLCANO: REFLECTIONS...grssieee
This document discusses the use of Interferometric Synthetic Aperture Radar (InSAR) for measuring surface deformation over time. It summarizes Kiyo Tomiyasu's pioneering work on using InSAR from a geosynchronous orbit. It also presents a new method called MInTS that uses wavelet decomposition and physical parameterization to generate continuous deformation time series from large numbers of InSAR images. MInTS is demonstrated on data from Iceland's Northern Volcanic Zone, showing instantaneous velocities and asymmetries in deformation patterns. Finally, the document proposes a concept for a geosynchronous InSAR constellation that could provide near-continuous coverage of the Earth's surface.
This document discusses satellite remote sensing. It provides details on different types of remote sensing satellites including Landsat, MODIS, SPOT, IRS series, and IKONOS. It also describes various sensors used in remote sensing such as MSS, TM, HRV, LISS, PAN, and WiFS. The document discusses the basic principles, components, and applications of remote sensing from satellites for land resources survey, environmental monitoring, and other purposes.
The document discusses LiDAR technology and its applications in forestry. It begins by explaining what LiDAR is and the different platforms it can be used on, including satellites, aircraft, and ground-based systems. It then discusses several forestry applications of LiDAR such as measuring tree height, crown width, biomass, and basal area. Two case studies are presented, one on estimating carbon stock in an urban forest using LiDAR data, and another on estimating forest canopy fuels. The document concludes that LiDAR provides highly accurate, high-resolution data that allows forest characteristics to be acquired quickly and is useful for applications like biomass estimation and modeling fire behavior.
This document discusses Light Detection and Ranging (LiDAR) technology. It begins with an introduction to LiDAR, describing how it uses laser pulses to measure distance. It then provides details on the components and functioning of LiDAR systems, including lasers, scanners, detectors, and positioning systems. The document concludes by outlining various applications of LiDAR in fields such as geology, meteorology, archaeology, biology, and more.
MO4.L09 - DIGITAL BEAMFORMING SAR (DBSAR) FOR BIOMASS ESTIMATIONgrssieee
DBSAR is an airborne synthetic aperture radar developed by NASA to estimate biomass. It uses digital beamforming to implement advanced scanning modes not possible with conventional SARs. DBSAR's architecture includes an 8-channel phased array antenna, reconfigurable waveform generator, and real-time processor. Initial flights were conducted in 2008 over forests, and field measurements were collected to correlate radar backscatter to biomass. Ongoing work involves biomass retrieval algorithms using DBSAR and interferometry techniques.
MO3.L09 - THEORETICAL AND PRACTICAL DESIGN CONSIDERATIONS FOR A SMALL, MULTI-...grssieee
The document summarizes the design of the SlimSAR system, a small synthetic aperture radar designed for operation on small unmanned aircraft systems. Key points include:
1) SlimSAR is a multi-frequency SAR that operates at L-band, X-band, and UHF with a bandwidth up to 660 MHz and weighs less than 10 lbs.
2) It was designed based on existing SAR systems like MicroASAR and NuSAR to take advantage of proven technologies and allow for rapid testing and integration.
3) The system uses a block upconversion design that allows it to operate at different frequency bands and in direct sampling or deramp modes, providing flexibility.
This document describes 4 laboratories related to radar and remote sensing:
1. Evaluation of SNR and EIRP from the radar range equation for different frequencies and target cross-sections.
2. Calculation of refractive index and obstacle diffraction, including orographic profile download and computation of distance from line of sight.
3. Detection of echo returns through signal integration, including generation of transmitted signals and identification of convolutional signals.
4. Application of radar meteorology, including hourly cumulative rain maps, comparison to terrestrial gauge data, radar accuracy analysis, and spatial averaging of radar data.
Nova Electric supplies rugged power sources for harsh environment applications. It has over 45 years of experience providing uninterruptible power supplies, inverters, and power supplies to the defense, aerospace, and maritime industries. Nova Electric's products are used in applications ranging from submarines to aircraft to space shuttles. The document provides examples of specific programs and aircraft that utilize Nova Electric's power solutions, including Bombardier Dash 8 aircraft, Desert Owl radar systems, and various US military aircraft.
This document describes the development of an airborne lidar instrument called A-LISTS to demonstrate technologies for a proposed spaceborne lidar mission called LIST. LIST aims to map global topography at 5m resolution to study Earth's surface and changes over time. A-LISTS will test a multi-beam laser transmitter, high sensitivity detectors, and data processing to achieve LIST measurement capabilities from an aircraft. Its first flight in September 2011 will collect lidar data over various terrain to evaluate performance. Key challenges for LIST that A-LISTS helps address include detecting ground returns through vegetation canopies and developing efficient, lightweight instruments.
Ocean Optics: Fundamentals & Naval Applications Technical Training Short Cour...Jim Jenkins
The document provides background on Jeffrey Smart's experience in ocean optics from 1988 to present. It discusses his work on various naval projects involving the use of optical sensors to measure water clarity and the applications of ocean optics for mine warfare, port security, underwater communications, and submarine detection. Specific sensor systems are also described, such as the Airborne Laser Mine Detection System.
The document summarizes recent developments in airborne laser scanning technologies. It discusses improvements such as increased data acquisition rates enabled by higher pulse repetition rates and scan rates. It also covers developments like multiple return recording and full waveform digitization. Integration of digital cameras to provide higher quality imagery is also described. Overall, technologies have advanced to allow for higher point densities, altitudes, and accuracies in airborne laser scanning systems.
The document summarizes the different classes of airspace in the United States, including controlled airspace (Classes A, B, C, D, E), uncontrolled airspace (Class G), and special use airspace such as restricted areas, prohibited areas, warning areas, military operations areas, and controlled firing areas. It describes the operating rules, pilot certification and equipment requirements, dimensions and other characteristics of each class of airspace.
ADVANCED DTM GENERATION USING AIRBORNE LIDAR TECHNIQUECovasnianu Adrian
Simulations of the hydrological risks and thus the decisions of assessment strategies are crucial in the context of extreme meteorological events due to the consequences of the fast changes in the climate. The remote sensing methods, such as LIDAR backscatter technique are allowing the elaboration of a high precision (5cm vertical and 3 points/m2 horizontal resolutions) Digital Terrain Model (DTM) as basis of the hydrological modeling. In this paper is presented the airborne LIDAR technique, methodology of obtaining the DTM, the usefulness of the DTM outputs for hydrologic applications and the potential application for the Romanian Danube Flood Plain assessment strategy.
Natural sensing uses electromagnetic radiation to obtain information about objects without physical contact. It involves sensing, analysis, and extracting knowledge. Remote sensing uses various sensors on different platforms to collect data across the electromagnetic spectrum. The key components are the target area, sensor, interpretation/analysis, energy source, atmosphere, and receivers. Sensors can be passive (depending on external energy) or active (with their own energy source) and operate on different platforms like ground, airborne, or spaceborne. The data has applications in agriculture, forestry, geology, hydrology, urban planning, and more.
Remote sensing involves obtaining information about objects without physical contact. It works by sensing and recording electromagnetic radiation reflected or emitted from targets. The key components are an energy source, sensor, platforms, and data analysis to extract information. Sensors can be optical, thermal, or microwave. Platforms include satellites, aircraft, and ground bases. Applications of remote sensing include agriculture, forestry, geology, hydrology, urban planning, and national security.
Microwave sensing systems use sensors that operate in the microwave portion of the electromagnetic spectrum between 1 mm and 1 m wavelengths. These sensors include radars and radiometers that can image outside the visible and infrared regions. Microwaves can penetrate haze, clouds, smoke and pollution, allowing these sensors to image in all weather conditions unlike visible and infrared sensors. Common microwave remote sensing platforms include synthetic aperture radar, scatterometers and radar altimeters.
In tech recent-advances_in_synthetic_aperture_radar_enhancement_and_informati...Naivedya Mishra
This document discusses recent advances in synthetic aperture radar (SAR) enhancement and information extraction. It summarizes three methods presented in the paper: 1) A wavelet-based despeckling and information extraction method using a Generalized Gauss-Markov Random Field (GGMRF) and Bayesian inference; 2) A method using GMRF and an Auto-binomial model with Bayesian inference; 3) A third method that also uses GMRF and an Auto-binomial model with Bayesian inference. The despeckling performance of these three methods is compared and texture parameter estimation is presented.
Remote sensing involves collecting information about objects or areas from a distance without making direct contact. It works by sensing and recording reflected or emitted energy and processing, analyzing data. Key points are that it obtains data through passive sensors that sense sunlight reflected by Earth or active sensors like radar that emit and sense their own radiation. Platforms can be ground, airborne or spaceborne. Spaceborne platforms are in either geostationary or polar orbits. [/SUMMARY]
The document discusses different types of remote sensing scanners. It describes multispectral scanners, thematic mappers, thermal scanners, and hyperspectral scanners. Multispectral scanners collect data in multiple wavelength bands using either across-track or along-track scanning. Thematic mappers were developed to improve upon multispectral scanners. Thermal scanners sense the thermal infrared wavelength range. Hyperspectral scanners record over 100 contiguous spectral bands to generate a continuous reflectance spectrum for each pixel.
This document discusses laser ranging and LIDAR systems. It provides an overview of satellite laser ranging (SLR) which uses lasers to precisely measure distances to satellites. It then describes the key components and workings of LIDAR systems, including lasers, scanners, inertial measurement units, GPS, and how they are used to map terrain from aircraft. Sources of error in LIDAR measurements are also reviewed. The document concludes by outlining applications of LIDAR in fields such as surveying, mining, forestry, and transport.
The document provides an overview of remote sensing concepts through three lectures presented by Dr. Safaa Mohamed Hasan. The lectures cover definitions of remote sensing, sensor types, image characteristics, and resolutions including spatial, spectral, radiometric, and temporal resolutions. Geometric distortions and corrections through registration and resampling techniques are also discussed.
Remote sensing platforms can be ground-based, airplane-based, or satellite-based. Satellite platforms can be in sun-synchronous polar orbits for global coverage, non-sun-synchronous orbits for variable coverage, or geostationary orbits for continuous regional coverage. Remote sensing can be passive using sunlight or active using its own energy source like radar or lidar. Spatial, spectral, radiometric, and temporal resolutions provide information on a sensor's ability to distinguish locations, wavelengths, brightness values, and revisit times. Raster data formats represent imagery as a grid of pixels organized into rows, columns, and bands.
Resolution and scanning system
high resolution scanning
scanning resolution for photos
high resolution scanning service
best resolution for scanning photos
best scanning resolution for documents
scanning resolution dpi
high resolution scanning near me
Remote sensing is the science of obtaining information about objects through analysis of sensor data without physical contact. Electromagnetic radiation is used for remote sensing and propagates as waves through the electromagnetic spectrum. Platforms for remote sensing include ground, aerial, and space-based sensors. Spaceborne sensors on satellites provide large area coverage at regular intervals. Common satellite sensors discussed are Cartosat, RISAT, MODIS, and ASTER.
This document provides information on various remote sensing platforms and Earth observing satellites. It discusses balloons, helicopters, airplanes and satellites as remote sensing platforms. It then describes different types of satellite orbits and provides details on several major Earth observing satellites including their sensors and specifications. These satellites include Landsat, SPOT, Ikonos, AVHRR, Radarsat, GOES, Meteosat, and some Indian, Japanese, European and Russian satellites.
JPSS will continue critical environmental monitoring from polar orbiting satellites by maintaining observations from sensors like CrIS, ATMS, VIIRS, OMPS, and CERES. The NPP satellite will fly the first set of these instruments in order to ensure continuity of data until JPSS-1 is launched. JPSS will provide global observations for weather forecasting and climate monitoring through environmental data records from multiple instruments measuring atmospheric, oceanic, and land surface variables. Continuity of long term data sets is essential for detecting climate change and improving weather prediction.
This document summarizes key concepts in radar imaging and measurement using radar. It discusses real-aperture ground imaging radar and how resolution varies with distance. It also covers radar altimetry and how altitude is measured. Finally, it describes techniques for signal integration like coherent integration, which improves signal-to-noise ratio by combining signals while maintaining their phase information.
This document discusses various remote sensing platforms and sensors. It provides information on:
1. Airborne platforms like balloons and aircraft that are used to acquire aerial imagery and photographs. Aircraft provide regional coverage and flexibility but are affected by weather.
2. Spaceborne platforms like geo-stationary and sun-synchronous satellites. Geo-stationary satellites like GOES and INSAT are used for weather and communication due to low spatial resolution. Sun-synchronous satellites like LANDSAT, SPOT, and IRS provide global coverage with high resolution for resource surveys.
3. Different types of sensors including passive sensors like photographic and multispectral systems, and active sensors like radar. Advanced sensors include push
This document discusses remote sensing sensors and their characteristics. It describes how sensors are designed to record electromagnetic radiation and generate signals corresponding to energy variations of earth surface features. Imaging sensors convert EM radiation into numerical or image data. The document discusses different types of scanning sensors, including whisk broom and push broom, and covers various airborne sensors used by CIMSS including passive imagers and sounders, as well as active sensors like LIDAR.
Remote sensing - Sensors, Platforms and Satellite orbitsAjay Singh Lodhi
Remote sensing uses sensors on various platforms to detect electromagnetic radiation from the Earth. Sensors can be passive, detecting natural radiation, or active, emitting their own radiation. Platforms include ground-based, airborne, and space-based options at increasing heights. Space-based platforms include low Earth orbit satellites in polar or sun synchronous orbits for frequent coverage, and geostationary satellites for continuous coverage of fixed regions. Different sensors have varying spatial, spectral, radiometric, and temporal resolutions to detect features on Earth.
Jayam College of Engineering and Technology (JCET) provides world-class engineering education and fosters research and entrepreneurship. Located on 80 acres near Hogenakkal Falls, it has 2500 students and 4000+ alumni. JCET offers UG and PG programs in engineering and business and has strong industry partnerships that help students gain work experience and high placement rates. It aims to develop leaders through quality education and a focus on research.
This document provides information about a subject code and unit taught by two lecturers, Mrs. A. Sangari and Mrs. P. T. Subasini, in the Electrical and Electronics Engineering department. The subject and unit are about induction motors and specifically discusses the concept of slip in induction motors.
The document traces the history of aircraft development from early concepts of human flight using flapping wings, to the first hot air balloons and gliders, to advancements such as the wind tunnel, ailerons and the internal combustion engine which enabled the first powered flights. Key contributors included Leonardo Da Vinci, the Montgolfier Brothers, Sir George Cayley, the Wright Brothers and engineers who developed jet engines. The document also outlines instruments used to measure aircraft parameters and types of aircraft developed through World War 1 and beyond.
The document discusses engineering graphics and freehand sketching. It covers curves used in engineering like conics, cycloids, and involutes. It also discusses representing 3D objects through multiple views and developing visualization skills through freehand sketching. The document then provides step-by-step instructions on orthographic projections using first angle projection. It demonstrates drawing front, side, and top views from pictorial presentations. Finally, it outlines the general procedure for freehand sketching orthographic views from an isometric pictorial view.
The document provides information about a class on DC motors taught by Mrs. A. Sangari and Mrs. P.T. Subasini. It lists the subject code as 131307 for the second year Electrical and Electronics Engineering students. The class covers the principles of operation, back emf and torque equations, characteristics of series, shunt, and compound DC motors. It also discusses starting methods and speed control of series and shunt DC motors.
This document provides details about the subject Electrical Machines taught by Mrs. A. Sangari and Mrs. P.T. Subasini. The subject code is 131307 and it covers DC generators in the first unit, including their construction details, the emf equation, methods of excitation for self and separately excited generators, and the characteristics and parallel operation of series, shunt, and compound generators.
As a helicopter develops lift during takeoff and flight, the blade tips rise above straight-out position and assume a coned shape. This coning occurs due to the combined effects of centrifugal force from blade rotation, which adds rigidity, and developing lift from the collective. Some coning is normal, but excessive coning can cause problems like decreased lifting area and blade stress due to factors like low RPM, high gross weight, turbulence, or high-G maneuvers reducing centrifugal force or requiring more lift.
Bernoulli's principle states that within a confined system, total energy remains constant, so if the velocity of a fluid increases, the pressure decreases. When air flows over an airfoil, its velocity increases and pressure decreases above the airfoil compared to below it, resulting in higher pressure below pushing the airfoil up. Most but not all of the lift is produced by this differential pressure - the rest is produced by Newton's third law of motion, as the air deflecting downward exerts an equal and opposite force lifting the airfoil upward.
This document discusses three basic laws of aerodynamics: Newton's Laws of Motion. It explains the Law of Inertia which states that an object at rest will remain at rest and an object in motion will remain in motion unless acted on by an outside force. It describes the Law of Acceleration which says that force is directly proportional to mass and change in velocity. It also outlines Newton's Third Law of equal and opposite reaction, giving the example of torque effect and recoil from a gun.
Autorotation is the process by which a helicopter can descend and land without engine power by using the airflow coming up from the ground or air during descent to turn the rotor blades and maintain control. During autorotation, the helicopter trades altitude for the energy required to spin the rotor blades at a speed that provides enough lift to control the aircraft. The pilot lowers the collective to reduce blade drag and tilt the total aerodynamic force vector forward to maintain rotor RPM as the helicopter descends.
This document discusses airfoil and rotor blade terminology. It defines symmetrical and nonsymmetrical airfoils and their characteristics. It also defines the angles of incidence, attack, and describes how collective and cyclic feathering changes these angles to control the helicopter. Flapping, lead, and lag are also summarized as important motions of the rotor blades that help control the aircraft.
This NASA document provides information about an educator's guide on aeronautics with activities in science, math, and technology. The guide and other NASA education products can be accessed online at the NASA Spacelink website. The guide contains activities to engage students in grades 2-4 and sparks their interest in aeronautics through toy gliders and following the careers of pilots, astronauts, and aeronautical engineers.
1. Airborne Laser Scanning and its
Applications
Prof.Dr.S.Anbazhagan
Centre for Geoinformatics & Planetary Studies
Department of Geology
Periyar University
Salem
2. About Airborne Laser Scanning
Case study in parts of Elbe river basin
Selected applications
3. What is Airborne Laser scanning?
Airborne laser scanning (ALS) represents a new and
independent technology for the generation of highly
automated digital terrain and surface models.
ALS development goes back to the 1970’s and 1980’s,
with an early NASA system and other attempts in USA and Canada
The acronym ‘LASER’ stands for ‘Light Amplification by
Simulated Emission of Radiation’
LADAR – LAser Detection And Ranging
LIDAR – Light Detection And Ranging
ALS is member of the LIDAR family
LIDAR includes terrestrial laser scanners, airborne laser
Scanners and even police speed detection equipment
4. ALS data and Accuracy
Laser scanning systems furnish geometric results in terms of
distance, position, altitude and coordinates
Measuring rates 2KHz to 25KHz, go up to 80KHz
Sampling density on the ground range from about 1 point / 20
Sqm area up to 20 points per sq m area.
Vertical accuracy -0.15m & point spacing 1.5m with an
accuracy of 0.15 m
5. Airborne Laser Scanning (ALS) – Active Sensing
Efficient tool for generating accurate DTMs day
or night, especially over large areas of
featureless or densely covered terrain.
All laser systems measure by some means the
distance between the sensor and the
illuminated spot on ground
6. A Typical ALS System
Ranging Unit Scanner
Laser
Control monitoring Flight Footprint
and recording units direction
Swath Width
DGPS IMU
7. Components in ALS system
A dual frequency GPS receiver mounted in
the aircraft, positions the ALS unit, typically
every 0.5 seconds
An Inertial Measuring Unit (IMU) records
orientation of the aircraft, 200 times/sec
Laser distance measurement unit emits up to
50,000 discrete light beams/sec, records the
travel time and calculates the distance to the
ground
8. Laser ranging
Two ranging principles;
The pulsed ranging principle involves by measuring
the phase difference between the transmitted and
the received signal back scattered from the object
surface.
The phase difference method applied with lasers
that continuously emit light are called ‘ continuous
wave’ (CW) lasers.
10. Range (distance between sensor and object)
R = C t/2
C = velocity of light 300000 km/s
t = traveling time of a light pulse
Range resolution ∆R, in cm
∆R = C ∆t/2
∆t = ns, resolution of time measurement
t = ns, time between sending and receiving a pulse (or echo)
1 ns = 30 cm travel, then range = 15 cm
(Baltsavias 1999)
11. Lasers and wavelength
At present semiconductor diode laser and Nd: YAG lasers
(neodymium-doped yttrium aluminum garnet; Nd:Y3Al5O12 )
pumped by semiconductor lasers are used in the ALS system.
It covers optical band range 800 nm – 1600 nm
Most sensitive detectors are available between 800 nm and 1000 nm
First scanners were worked 900 nm. At this wavelength, powerful
pulsed semiconductor laser diodes were available on the market and
on optimum system performance could be expected. However, at this
wavelength, eye safety is still concern.
The TopoSys laser scanner operates at 1535 nm. At this wavelength,
higher energy levels can be used without running the risk to hurt the
eye.
12. Intensity of return laser
ALS system intensity (or strength) of the return laser
important
White sand, most of the emitted beam will be reflected
back to the aircraft
Black bitumen road, much less of the beam will be
reflected back
13. Backscattering properties of target
Reflectivity of various materials for 900 nm wavelengths
______________________________________________________________
Material Reflectivity (%)
______________________________________________________________
Snow 80-90
White masonry 85
Limestone, clay up to 75
Deciduous trees Typ.60
Coniferous trees Typ.30
Carbonate sand (dry) 57
Carbonate sand (wet) 41
Beach sand Typ.50
Concrete, smooth 24
Asphalt with pebbles 17
Lava 8
______________________________________________________________
(Wehr and Lohr, 1999)
15. ALS and Atmospheric condition
ALS best performance is achieved when the atmosphere
is cool, dry and clear
IR propagation is severely attenuated by water vapour,
(rain, fog and/or humidity), CO2
Dust particles and smoke also reduce detection range
Best result during night, worst during day with bright
sunlight
16. Physical properties in Laser Scanning
High power
Short pulses
High collimation
Narrow optical spectrum (10 nm bandwidth)
Narrow optical spectrum has an advantageous,
because narrow optical interference filters can be
mounted in the receiving path to suppress disturbing
background radiation, caused by backscattered
sunlight.
17. Position and Orientation System (POS)
The 3D position of a point on the earth surface can be
computed, if the position and orientation (POS) of the laser
system is known with respect to a coordinate system.
Integrated POS consisting of DGPS and an Inertial
Measurement Unit (IMU)
Geocoding of laser scanner measurements requires an
exact synchronization of all systems : IMU, DGPS and
laser scanner data
Time synchronization of better than 10 µs in achieved
operationally by this scheme
Wehr and Lohr (1999)
18. Determination of laser points
After a surveying flight, basically two data sets are available:
the POS data and the laser ranges with the instantaneous
scanning angles.
Data visualization and manual editing is necessary in different
stages of the processing chain.
Major advancements have been achieved by improvement mainly of
the post-processing software and less of the laser scanner
hardware.
Interpolated data can be further processed and analyzed by
commercial software e.g. Scop, Microstation, EASI-PACE, and
ARC/INFO.
Currently, the processing time for a DTM computed from laser
scanner data is typically three times the data acquisition time.
19. Processing steps in ALS data
Typical processing steps for laser scanner data
POS Data Ranges and Scan Calibration Data
(DGPS, IMU) Angels and Mounting Parameters
Laser Points
X, Y, Z in WGS84
or
Lat., Long., H in WGS84
Map Projection
Sorting
Filtering
Rasterizing
and
Thinning Out
20. Case study
Airborne laser scanning and high
resolution satellite data for
Geomorphic
study in Elbe river valley, Germany
(Anbazhagan et al 2005)
21. Objective
Integration of high resolution satellite data with
Airborne Laser Scanner (ALS) data to study the
various geomorphic features in parts of Elbe
river valley, Saxony, Germany.
22. Study area
Elbebasin in parts of Sächische Schweiz
National park zone is mostly covered by
forest
Airborne laser scanning data give more
informations on terrain condition covered
under dense forest and enable to interpret
the different types of landforms
23. Data used
Airborne Laser Scanning (ALS) data was obtained from TopScan
GmbH, Germany
The density of ALS cloud point is 1 point per 9 sq m area. The
accuracy of height is in between ± 10.8 cm and ± 12.6cm
IKONOS satellite data acquired on 1st August 2000 is used in the
present study. The satellite data in digital format is obtained from
Hansa Luftbild GmbH, Germany.
The imagery covered 97 sq km area in parts of Sächsischen
Schweiz region
IKONOS satellite data comprises of panchromatic band (PAN) with
1m spatial resolution and four multi-spectral bands with 4m spatial
resolution.
Multi-spectral bands were merged with geometrically rectified PAN
data (1m resolution). The output image has 1m spatial resolution
with 8 bit format
24. Software used
The laser point cloud data were processed with
help of SCOP++ software developed by Institute
of Photogrammetry and Remote sensing,
Technical University, Vienna
IKONOS satellite data & DEM,DSM, DGM done
through Erdas imagine 8.7 image processing
software
42. Digital Elevation Models
DTM (Digital Terrain Model)
DEM (Digital Elevation Model)
DSM (Digital Surface Model)
DCM (Digital Canopy Model)
DGM (Digital Ground Model)
DTM and DSM generation in urban areas, automated building
extraction, generation of 3-D city models for urban planning,
wireless telecommunication, microclimate models,
propagation of noise and pollutants
High accuracy and very dense measurement applications e.g.
flood mapping, DTM generation and volume calculation in
open pit mines, road design and modeling
43. Disaster Management
Rapid mapping and damage assessment
after natural disaster
e.g after hurricanes, earthquakes, landslides
etc.,
NRSC has done ALS survey in Tsunami
affected area
44. Mapping of Corridors
Mapping corridors e.g. roads, railway tracks,
pipelines, waterway landscapes
Mapping of electrical transmissions lines and
towers including ground / tree clearance
DTM generation, especially in forested areas (in
forest road and path planning, drainage, etc)
45. Urban City Modeling
ALS data has become an important source for
generating high quality 3D urban city modeling.
3D city model using high resolution IKONOS
imagery and airborne laser scanning data (Tao
and Yasuoka 2002).
Digital Surface Models (DSM) acquired at
different occasions to successfully detect the
building changes (Murakani et al 1999).
46. Terrain Mapping
Landscape modeling using integrated airborne multi-
spectral and laser scanning data (Hill et al 2002).
Generation of digital surface models and digital elevation
models that can provide information on the
geomorphology of the earth’s surface (Pereira and
Wicherson 1999).
Merging of high resolution satellite data and airborne laser
scanning data provide information geomorphological
features like cuesta, mesa, escarpments and river terraces
(Anbazhagan et al 2005)
47. Forest Resource Mapping
ALS technology can provide information about tree
height, crown diameter, tree density, and biomass
estimation.
Vegetation height is a function of species
composition, climate and site quality, and can be
used for land cover classification.
Forest structure and biophysical parameters, and
digital elevation models for watershed delineation
and water flows.
48. (A) The unprocessed lidar height surface (i.e., digital surface model, DSM),
(B) elevation surface (i.e., digital terrain model, DTM), and
(C) the estimated vegetation height surface (i.e., digital canopy model, DCM)
resulting from the subtraction of the DTM (B) from the DSM (A).
Clark et al 2004
49. Management of Fluvial zones
Accurate and updated models of flood plains are critical
for flood plain monitoring and disaster planning.
Laser data used to generate hydrodynamic model. Such
model is determine the effect of high water levels and of
earth works, such as removal of sand in river areas
(Pereira and Wicherson 1999).
LIDAR and Photogrammetry data used for monitoring
water elevation and volume changes in riparian
resources within the Grand Canyon region (Davis et al
2002).
50. Coastal zone Management
Highly dynamic coastal zone require constant
updating of baseline survey data. ALS offers a
cost effective method to do this on a routine
basis.
Mapping and monitoring of shore lines, beaches,
tidal flats, dunes, and wetlands.
Measurement of coastal areas, determination of
coastal change and erosion
55. HIGWAY ENGINEERINGPROJECTS
The product generated by DSM, orthophotos
mosaic and highway geometric project
integration made possible a high quality
visualization of highway project. This product
can be used as much visualization element for
customer project presentation as for public
hearings.
56. Coastal Bathymetric studies
Bathymetric layers operated same principle as the
topographic lasers, but emit in two wavelength, usually
1064 nm and 532 nm.
The infrared wavelength is reflected on the water
surface, while the green one penetrates the water and
reflected by bottom surface or other objects in the
water.
Laser data used for water depth measurement and
monitor the submerged jetty and disposal areas.
57. ALS development
1995 LIDAR commercial operations 5 world wide
2001 75 organizations 60 sensor commercial
2002 120 organizations 75 sensors
2005 150 – 200 sensors
Major commercial sensors N.America (50%), Europe (28%) 15% Asia-
pacific mostly Japan
Remote Sensing 9.1% annual growth rate
Forecast 2006 – LIDAR, SAR, Hyperspectral data
(Lohani and Flood, 2003)
58. ALS development
$30 - $50 million per year for Lidar data acquisition
growth in the rate 20% - 40%
30% private sector in USA , leading market
energy utilities
35% state/local government
35% federal government
59. Conclusion
Airborne Laser scanning data is an accurate,
fast and versatile measurement technique,
and open up new exciting area of application.
Integration of airborne laser data and high
resolution satellite data will give excellent
information on landscape modeling
Potential integration with imaging sensors is
expected to put airborne data acquisition on
a revolutionary level of system performance
60. References
Abbott,R.H., Penny,M.F., 1975.
Ackermann. F., 1999.
Anbazhagan,S., Trommler.M., Csaplovics.E., 2005
Cunningham,L.L., 1972.
Davis.P.A., et al., 2002.
Haala,N., Brenner,C., Anders,K.H., 1997.
Hill.R.A., and Veitch.N., 2002
Hill et al 2002. Irish.L.J, Lillycrop.W.J. 1999.
Kushwaha.S.P.S., and Behera.M.D., 2002.
Lohani.B., and Flood.M., 2004
Maas, H.G., and Vosselman.G.,1999.
Murakami et al (1999).
Pereira.L.M.G, Weicherson.R.J.1999
Tao.G., Yasuoka.Y.,
Vosselman.G., Suveg.I., 2001
Wehr.A., and Lohr.U., 1999.
Wulder. M., Onge,B., Treitz.P., 2000.