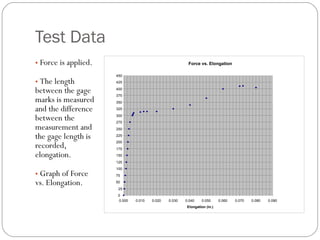
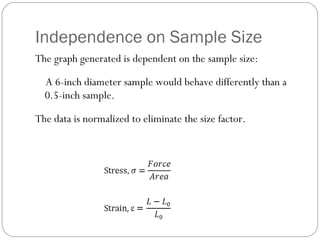
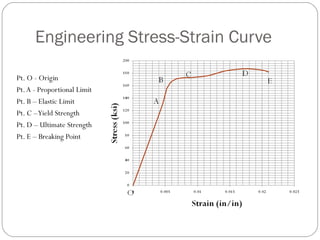
Professor Julie A. Young Thomas Nelson Community College Mechanical Properties of Materials Derived from the Stress vs. Strain Curve
Introduction Material selection is an important step in product development. In a mechanical engineering sense, we select a material based on: Strength Stiffness Ductility These properties dictates how a material responds to applied loads and forces. But how are mechanical material properties determined?
Learning Objectives: Given a material sample, explain how the uniaxial tensile test is conducted to determine mechanical properties of a material and how the plot of stress vs. strain is generated. Given a stress vs. strain curve for a material (either one that yields or does not yield), identify the Proportional Limit, Elastic Limit, Yield Strength and Ultimate Strength, calculate the Modulus of Elasticity and the percent elongation.  State whether the material is brittle or ductile.
Uniaxial Tensile Test One of the simplest and more effective tests. Places a constant force on an material.
The Material Test Sample A cylindrical material sample of the material is used. Two marks are scribed on the material a precise distance apart.  This is called the  gage length . (L o ) The sample is placed in the machine and a force is applied in tension. . Tension       Gage Length, L o
Test Data Force is applied. The length between the gage marks is measured and the difference between the measurement and the gage length is recorded, elongation. Graph of Force vs. Elongation. Force vs. Elongation 0 25 50 75 100 125 150 175 200 225 250 275 300 325 350 375 400 425 450 0.000 0.010 0.020 0.030 0.040 0.050 0.060 0.070 0.080 0.090 Elongation (in.)
Independence on Sample Size The graph generated is dependent on the sample size: A 6-inch diameter sample would behave differently than a 0.5-inch sample. The data is normalized to eliminate the size factor.
Engineering Stress-Strain Curve Pt. O - Origin Pt. A - Proportional Limit Pt. B – Elastic Limit Pt. C – Yield Strength Pt. D – Ultimate Strength Pt. E – Breaking Point
Additional Properties from the Stress-Strain Curve Modulus of Elasticity – the slope of the stress-strain curve in the linear region Percent Elongation – if less than 5%, the material is brittle,  if more than 5%, the material is ductile
Conclusion Mechanical properties of materials are determined from the stress-strain curve. We choose a material based on the following mechanical properties: Strength (Yield and Ultimate) Stiffness (Modulus of Elasticity) Ductility (Percent Elongation)

Stress vs. Strain Curve

  • 1.
    Professor Julie A.Young Thomas Nelson Community College Mechanical Properties of Materials Derived from the Stress vs. Strain Curve
  • 2.
    Introduction Material selectionis an important step in product development. In a mechanical engineering sense, we select a material based on: Strength Stiffness Ductility These properties dictates how a material responds to applied loads and forces. But how are mechanical material properties determined?
  • 3.
    Learning Objectives: Givena material sample, explain how the uniaxial tensile test is conducted to determine mechanical properties of a material and how the plot of stress vs. strain is generated. Given a stress vs. strain curve for a material (either one that yields or does not yield), identify the Proportional Limit, Elastic Limit, Yield Strength and Ultimate Strength, calculate the Modulus of Elasticity and the percent elongation. State whether the material is brittle or ductile.
  • 4.
    Uniaxial Tensile TestOne of the simplest and more effective tests. Places a constant force on an material.
  • 5.
    The Material TestSample A cylindrical material sample of the material is used. Two marks are scribed on the material a precise distance apart. This is called the gage length . (L o ) The sample is placed in the machine and a force is applied in tension. . Tension Gage Length, L o
  • 6.
    Test Data Forceis applied. The length between the gage marks is measured and the difference between the measurement and the gage length is recorded, elongation. Graph of Force vs. Elongation. Force vs. Elongation 0 25 50 75 100 125 150 175 200 225 250 275 300 325 350 375 400 425 450 0.000 0.010 0.020 0.030 0.040 0.050 0.060 0.070 0.080 0.090 Elongation (in.)
  • 7.
    Independence on SampleSize The graph generated is dependent on the sample size: A 6-inch diameter sample would behave differently than a 0.5-inch sample. The data is normalized to eliminate the size factor.
  • 8.
    Engineering Stress-Strain CurvePt. O - Origin Pt. A - Proportional Limit Pt. B – Elastic Limit Pt. C – Yield Strength Pt. D – Ultimate Strength Pt. E – Breaking Point
  • 9.
    Additional Properties fromthe Stress-Strain Curve Modulus of Elasticity – the slope of the stress-strain curve in the linear region Percent Elongation – if less than 5%, the material is brittle, if more than 5%, the material is ductile
  • 10.
    Conclusion Mechanical propertiesof materials are determined from the stress-strain curve. We choose a material based on the following mechanical properties: Strength (Yield and Ultimate) Stiffness (Modulus of Elasticity) Ductility (Percent Elongation)