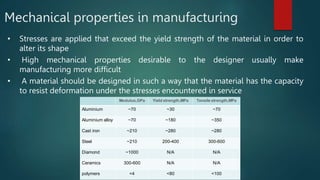
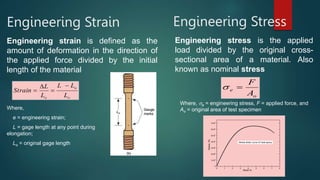
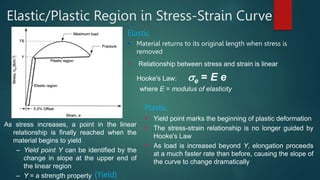
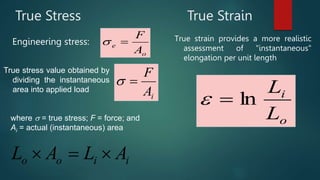
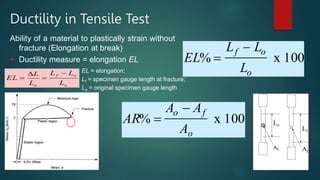
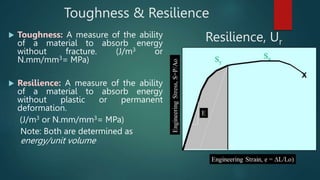
MANUFACTURING
PROPERTIES OF MATERIALS
UNIT-1
INTRODUCTION
BIKASH KUMAR, PHD
ASSISTANT PROFESSOR
DEPARTMENT OF INDUSTRIAL AND PRODUCTION ENGINEERING
Mechanical properties in manufacturing
• Stresses are applied that exceed the yield strength of the material in order to
alter its shape
• High mechanical properties desirable to the designer usually make
manufacturing more difficult
• A material should be designed in such a way that the material has the capacity
to resist deformation under the stresses encountered in service
Modulus,GPa Yield strength,MPa Tensile strength,MPa
Aluminium ~70 ~30 ~70
Aluminium alloy ~70 ~180 ~350
Cast iron ~210 ~280 ~280
Steel ~210 200-400 300-600
Diamond ~1000 N/A N/A
Ceramics 300-600 N/A N/A
polymers <4 <80 <100
Stress-Strain Relationships
3. Shear - tend to cause adjacent portions of material
to slide against each other
1. Tensile - tend to stretch the material
2. Compressive - tend to squeeze it
Three types of static stresses (deformation) to which materials can be
subjected:
 Universal Tensile Testing Machine to
obtain Stress-strain curve
Typical test specimen
Tensile Test
i
i
o
o A
L
A
L 


Most common test for studying stress-strain
relationship of metals is Tensile test
In this test, a force pulls the material, elongating it
and reducing its diameter
Tensile test:
(a) tensile force applied in (1) and (2)
(b) resulting elongation of material
Engineering Strain
Where,
e = engineering strain;
L = gage length at any point during
elongation;
Lo = original gage length
o
o
o L
L
L
L
L
Strain




Engineering strain is defined as the
amount of deformation in the direction of
the applied force divided by the initial
length of the material
Engineering stress is the applied
load divided by the original cross-
sectional area of a material. Also
known as nominal stress
Engineering Stress
o
e
A
F


Where, e = engineering stress, F = applied force, and
Ao = original area of test specimen
0 1 2 3 4 5 6 7 8
0
1x10
7
2x10
7
3x10
7
4x10
7
5x10
7
6x10
7
7x10
7
Stress,
Pa
Strain,%
Stress-strain curve of neat epoxy
Elastic/Plastic Region in Stress-Strain Curve
• Material returns to its original length when stress is
removed
• Relationship between stress and strain is linear
Hooke's Law: e = E e
where E = modulus of elasticity
 Yield point marks the beginning of plastic deformation
 The stress-strain relationship is no longer guided by
Hooke's Law
 As load is increased beyond Y, elongation proceeds
at a much faster rate than before, causing the slope of
the curve to change dramatically
Elastic
Plastic
As stress increases, a point in the linear
relationship is finally reached when the
material begins to yield
– Yield point Y can be identified by the
change in slope at the upper end of
the linear region
– Y = a strength property (Yield)
Tensile Strength in Stress-Strain Curve
 Elongation is accompanied by a
uniform reduction in cross
section area, consistent with
maintaining constant volume
 Finally, the applied load F reaches a
maximum value, and engineering
stress at this point is called the tensile
strength TS / ultimate tensile strength)
Tensile Strength Vs Yield Strength
If stress maintained specimen will break
Fracture
Strength
Yield stress, y , usually
more important than
tensile strength. Once
yield stress has been
passed, structure has
deformed beyond
acceptable limits.
Typical Engineering Stress-Strain Plot
4. necking begins, load begins to decrease
5. fracture.
If pieces are put back together as in
(6), final length can be measured.
1. beginning of test, no load;
2. uniform elongation and reduction of cross
section area;
3. continued elongation, maximum load
reached;
Typical progress of a
tensile test:
True Stress
where  = true stress; F = force; and
Ai = actual (instantaneous) area
i
A
F


Engineering stress:
o
e
A
F


i
i
o
o A
L
A
L 


True stress value obtained by
dividing the instantaneous
area into applied load
True Strain
True strain provides a more realistic
assessment of "instantaneous"
elongation per unit length
o
i
L
L
ln


Ductility in Tensile Test
EL = elongation;
Lf = specimen gauge length at fracture;
Lo = original specimen gauge length
o
o
f
o L
L
L
L
L
EL




Ability of a material to plastically strain without
fracture (Elongation at break)
 Ductility measure = elongation EL EL% 
Lf  Lo
Lo
x 100
AR% 
Ao  Af
Ao
x 100
Ductile Vs Brittle Materials
 Only Ductile materials will exhibit necking.
 Ductile if EL%>8% (approximately)
 Brittle if EL% < 5% (approximately)
Engineering
Stress
Engineering Strain
Ability to absorb energy up to fracture
(Area under the strain-stress curve up
to fracture)
Toughness
Brittle fracture: elastic energy
Ductile fracture: elastic + plastic energy
Toughness & Resilience
 Toughness: A measure of the ability
of a material to absorb energy
without fracture. (J/m3 or
N.mm/mm3= MPa)
 Resilience: A measure of the ability
of a material to absorb energy
without plastic or permanent
deformation.
(J/m3 or N.mm/mm3= MPa)
Note: Both are determined as
energy/unit volume
Resilience, Ur
Hardness
Resistance to permanent indentation
 Good hardness generally means material is resistant to scratching
and wear
 Most tooling used in manufacturing must be hard for scratch and
wear resistance
 Commonly used for assessing material properties because they are
quick and convenient
 Well-known hardness tests:
Brinell and Rockwell
Brinell Hardness Test
Hardness testing methods: (a) Brinell
Widely used for testing metals and
nonmetals of low to medium
hardness
A hard ball is pressed into
specimen surface with a load of
500, 1500, or 3000 kg
Rockwell Hardness Test
Another widely used test
1.A cone shaped indenter is
pressed into specimen
using a minor load of 10 kg
2.Then, a major load of 150
kg is applied, causing
indenter to penetrate
beyond its initial position
Hardness-testing Methods and Formulas
Fatigue
 Material fatigue is a phenomenon where structures fail when
subjected to a cyclic load. This type of structural damage occurs
even when the experienced stress range is far below the static
material strength. Fatigue is the most common source behind
failures of mechanical structures
 Cyclic Stress – on gear teeth, tool dies, camshaft, springs etc.
 Thermal Stress -- cool die in repeated contact with hot work
pieces
 Both stresses may cause part failure at stress levels below normal static
stress loading
Fatigue
 S-N Curves
 Stress Amplitude (S) --
Maximum stress specimen
is subjected
 Number of Cycles (N)
 Level of stress a material
tolerates decreases with
an increase in cycles.
Endurance (Fatigue
Limit) - Maximum
stress material may be
subjected without
fatigue failure.
Fatigue
Endurance (Fatigue Limit) -- Maximum stress
material may be subjected without fatigue failure.
Aluminum Alloys and similar materials exhibit an
indefinite endurance limit.
Fatigue strength is specified at a certain number of
cycles (10^7.)

3. Material Properties-prt1.pptx

  • 1.
    MANUFACTURING PROPERTIES OF MATERIALS UNIT-1 INTRODUCTION BIKASHKUMAR, PHD ASSISTANT PROFESSOR DEPARTMENT OF INDUSTRIAL AND PRODUCTION ENGINEERING
  • 2.
    Mechanical properties inmanufacturing • Stresses are applied that exceed the yield strength of the material in order to alter its shape • High mechanical properties desirable to the designer usually make manufacturing more difficult • A material should be designed in such a way that the material has the capacity to resist deformation under the stresses encountered in service Modulus,GPa Yield strength,MPa Tensile strength,MPa Aluminium ~70 ~30 ~70 Aluminium alloy ~70 ~180 ~350 Cast iron ~210 ~280 ~280 Steel ~210 200-400 300-600 Diamond ~1000 N/A N/A Ceramics 300-600 N/A N/A polymers <4 <80 <100
  • 3.
    Stress-Strain Relationships 3. Shear- tend to cause adjacent portions of material to slide against each other 1. Tensile - tend to stretch the material 2. Compressive - tend to squeeze it Three types of static stresses (deformation) to which materials can be subjected:  Universal Tensile Testing Machine to obtain Stress-strain curve Typical test specimen
  • 4.
    Tensile Test i i o o A L A L   Most common test for studying stress-strain relationship of metals is Tensile test In this test, a force pulls the material, elongating it and reducing its diameter Tensile test: (a) tensile force applied in (1) and (2) (b) resulting elongation of material
  • 5.
    Engineering Strain Where, e =engineering strain; L = gage length at any point during elongation; Lo = original gage length o o o L L L L L Strain     Engineering strain is defined as the amount of deformation in the direction of the applied force divided by the initial length of the material Engineering stress is the applied load divided by the original cross- sectional area of a material. Also known as nominal stress Engineering Stress o e A F   Where, e = engineering stress, F = applied force, and Ao = original area of test specimen 0 1 2 3 4 5 6 7 8 0 1x10 7 2x10 7 3x10 7 4x10 7 5x10 7 6x10 7 7x10 7 Stress, Pa Strain,% Stress-strain curve of neat epoxy
  • 6.
    Elastic/Plastic Region inStress-Strain Curve • Material returns to its original length when stress is removed • Relationship between stress and strain is linear Hooke's Law: e = E e where E = modulus of elasticity  Yield point marks the beginning of plastic deformation  The stress-strain relationship is no longer guided by Hooke's Law  As load is increased beyond Y, elongation proceeds at a much faster rate than before, causing the slope of the curve to change dramatically Elastic Plastic As stress increases, a point in the linear relationship is finally reached when the material begins to yield – Yield point Y can be identified by the change in slope at the upper end of the linear region – Y = a strength property (Yield)
  • 7.
    Tensile Strength inStress-Strain Curve  Elongation is accompanied by a uniform reduction in cross section area, consistent with maintaining constant volume  Finally, the applied load F reaches a maximum value, and engineering stress at this point is called the tensile strength TS / ultimate tensile strength)
  • 8.
    Tensile Strength VsYield Strength If stress maintained specimen will break Fracture Strength Yield stress, y , usually more important than tensile strength. Once yield stress has been passed, structure has deformed beyond acceptable limits.
  • 9.
    Typical Engineering Stress-StrainPlot 4. necking begins, load begins to decrease 5. fracture. If pieces are put back together as in (6), final length can be measured. 1. beginning of test, no load; 2. uniform elongation and reduction of cross section area; 3. continued elongation, maximum load reached; Typical progress of a tensile test:
  • 10.
    True Stress where = true stress; F = force; and Ai = actual (instantaneous) area i A F   Engineering stress: o e A F   i i o o A L A L    True stress value obtained by dividing the instantaneous area into applied load True Strain True strain provides a more realistic assessment of "instantaneous" elongation per unit length o i L L ln  
  • 11.
    Ductility in TensileTest EL = elongation; Lf = specimen gauge length at fracture; Lo = original specimen gauge length o o f o L L L L L EL     Ability of a material to plastically strain without fracture (Elongation at break)  Ductility measure = elongation EL EL%  Lf  Lo Lo x 100 AR%  Ao  Af Ao x 100
  • 12.
    Ductile Vs BrittleMaterials  Only Ductile materials will exhibit necking.  Ductile if EL%>8% (approximately)  Brittle if EL% < 5% (approximately) Engineering Stress Engineering Strain Ability to absorb energy up to fracture (Area under the strain-stress curve up to fracture) Toughness Brittle fracture: elastic energy Ductile fracture: elastic + plastic energy
  • 13.
    Toughness & Resilience Toughness: A measure of the ability of a material to absorb energy without fracture. (J/m3 or N.mm/mm3= MPa)  Resilience: A measure of the ability of a material to absorb energy without plastic or permanent deformation. (J/m3 or N.mm/mm3= MPa) Note: Both are determined as energy/unit volume Resilience, Ur
  • 14.
    Hardness Resistance to permanentindentation  Good hardness generally means material is resistant to scratching and wear  Most tooling used in manufacturing must be hard for scratch and wear resistance  Commonly used for assessing material properties because they are quick and convenient  Well-known hardness tests: Brinell and Rockwell
  • 15.
    Brinell Hardness Test Hardnesstesting methods: (a) Brinell Widely used for testing metals and nonmetals of low to medium hardness A hard ball is pressed into specimen surface with a load of 500, 1500, or 3000 kg
  • 16.
    Rockwell Hardness Test Anotherwidely used test 1.A cone shaped indenter is pressed into specimen using a minor load of 10 kg 2.Then, a major load of 150 kg is applied, causing indenter to penetrate beyond its initial position
  • 17.
  • 18.
    Fatigue  Material fatigueis a phenomenon where structures fail when subjected to a cyclic load. This type of structural damage occurs even when the experienced stress range is far below the static material strength. Fatigue is the most common source behind failures of mechanical structures  Cyclic Stress – on gear teeth, tool dies, camshaft, springs etc.  Thermal Stress -- cool die in repeated contact with hot work pieces  Both stresses may cause part failure at stress levels below normal static stress loading
  • 19.
    Fatigue  S-N Curves Stress Amplitude (S) -- Maximum stress specimen is subjected  Number of Cycles (N)  Level of stress a material tolerates decreases with an increase in cycles. Endurance (Fatigue Limit) - Maximum stress material may be subjected without fatigue failure.
  • 20.
    Fatigue Endurance (Fatigue Limit)-- Maximum stress material may be subjected without fatigue failure. Aluminum Alloys and similar materials exhibit an indefinite endurance limit. Fatigue strength is specified at a certain number of cycles (10^7.)

Editor's Notes

  • #2 In this lecture, we will introduce the material properties in manufacturing. These material properties refer to the mechanical properties of materials in manufacturing, especially yield strength. We will look at the following questions:   First, what is a stress-strain relationship? Second, how do we obtain a stress-strain relationship? Third, how many types of deformation do we find in manufacturing? The answer is three types: tension, compression and shearing.   We are going to learn a number of new definitions and new equations. Then we will use these definitions and equations to solve two problems
  • #3 In manufacturing, the shape or the geometry of a material is often changed by applying a stress. The stress applied must exceed the yield strength of the material to change its shape. For this reason, low strength materials are desired in manufacturing, because they lower manufacturing costs. However, high mechanical properties are often used in product design. This is the crux of our dilemma – the high mechanical properties which are desirable to the designer usually make manufacturing more difficult. How can we solve this? The only way really is for more communication between engineers and product designers
  • #4 There are three types of deformation in manufacturing: tension, compressing and shearing.   What is tension? In tension, a load is applied to stretch the material. In compressing, it is applied to squeeze the material. In shearing, a shearing load is applied which causes adjacent portions of material to slide against each other.   The Stress‑Strain Relationship of materials is based on the inherent properties of materials. This means that the stress-strain relationship obtained from all the three types of deformation would be similar; that is, a stress-strain relationship obtained from tension can be used in compressing and shearing
  • #5 In tensile testing, a force or a stress pulls the material, elongating the material and reducing its diameter. The left figure shows you the geometry of the material before testing, and the right figure shows you the change of elongation and the reduction of the crossing area. In tensile testing, the sample is stretched. So we expect an increase in the length of the sample and a reduction of the crossing area. Which parameter keeps constant in the tensile testing? Does the volume change? No, the volume does not change. So we have the equation at the bottom of the slide
  • #6 The stress-strain relationship of the materials is very important in manufacturing. What is stress? What is strain? Stress is also called engineering stress. Strain is also called engineering strain. Strain is calculated using this equation
  • #7 In the elastic region, the stress increases linearly with strain. This is the famous Hooke's law
  • #8 How can you work out the tensile strength from the Stress-strain curve? The tensile strength is the maximum stress in the stress-strain curve
  • #10 So, as you can see, elastic deformation occurs from figure one to figure two. Necking occurs when the maximum load has been reached. In figure five, the sample is fractured
  • #11 We have looked at stress-strain relations. Stress is engineering stress. It is determined by the equation in this slide. The load divided by the original cross-section area. The load is variable, but the original cross-section area is constant.   What is true stress? True stress equals the load variable divided by the instantaneous cross-section area, which is variable. If the load is given in a tensile test, how can we work out the instantaneous cross-section area? In tensile testing, the sample elongates and the cross-sectional area of the sample reduces. However, the volume of the sample keeps constant. So, we have the bottom equation
  • #12 How do you work out the ductility from the Stress-Strain curve? The ductility is the strain value when the sample is fractured
  • #15 In this lecture, we have looked at Young’s modulus. We have learnt about stress-strain curves and how to calculate the Young’s modulus. Young’s modulus is actually the slope in the straight portion of the elastic region in the stress-strain curve. Young’s modulus means stiffness; that is, the resistance of a material to a large scale deformation. Now let’s look at hardness. The hardness of a material refers to the resistance of this material to local deformation, to permanent deformation. If a material has high hardness, it should be resistant to scratching and wear. In manufacturing, most tooling used in manufacturing must be hard for scratch and wear resistance
  • #16 In a Brinell hardness test, a hard ball is pressed into the specimen surface with a load of 500, 1500, or 3000 kilograms.
  • #17 Rockwell hardness testing is more complicated. In a Rockwell testing, a cone shaped indenter is pressed into the specimen using a minor load of 10 kilograms. Then a major load of 150 kilograms is applied, causing the indenter to penetrate beyond its initial position