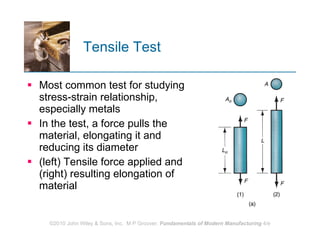
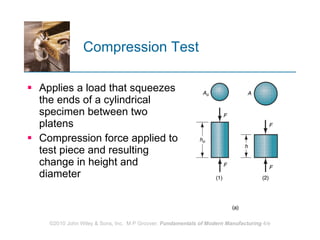
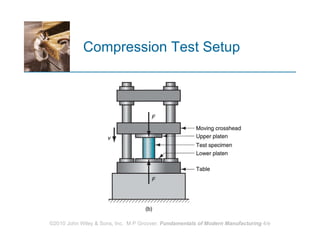
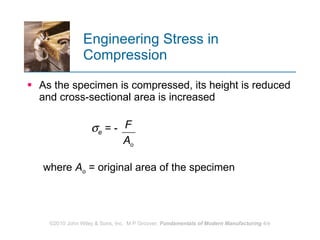
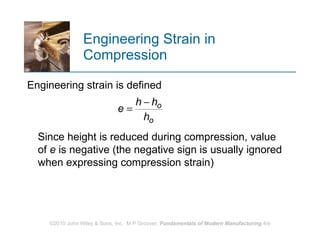
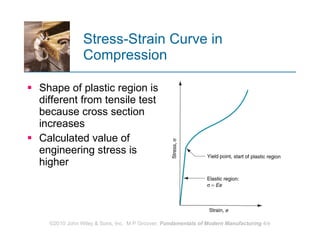
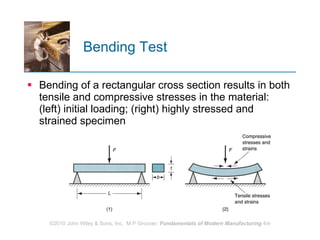
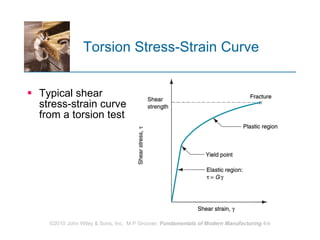
MECHANICAL PROPERTIES  OF MATERIALS Stress‑Strain Relationships Hardness Effect of Temperature on Properties Fluid Properties Viscoelastic Behavior of Polymers
Mechanical Properties in  Design and Manufacturing Mechanical properties determine a material’s behavior when subjected to mechanical stresses  Properties include elastic modulus, ductility, hardness, and various measures of strength  Dilemma: mechanical properties that are desirable to the designer, such as high strength, usually make manufacturing more difficult
Stress‑Strain Relationships Three types of static stresses to which materials can be subjected:  Tensile - stretching the material Compressive - squeezing the material Shear - causing adjacent portions of the material to slide against each other  Stress‑strain curve - basic relationship that describes mechanical properties for all three types
Tensile Test Most common test for studying stress‑strain relationship, especially metals  In the test, a force pulls the material, elongating it and reducing its diameter (left) Tensile force applied and (right) resulting elongation of material
Tensile Test Specimen ASTM (American Society for Testing and Materials) specifies preparation of test specimen
Tensile Test Setup Tensile testing machine
Tensile Test Sequence (1) no load; (2) uniform elongation and area reduction; (3) maximum load; (4) necking; (5) fracture; (6) putting pieces back together to measure final length
Engineering Stress Defined as force divided by original area:  where   e  = engineering stress,  F  = applied force, and  A o  = original area of test specimen
Engineering Strain Defined at any point in the test as  where  e  = engineering strain;  L  = length at any point during elongation; and  L o  = original gage length
Typical Engineering  Stress-Strain Plot Typical engineering stress‑strain plot in a tensile test of a metal Two regions: Elastic region Plastic region
Elastic Region in  Stress‑Strain Curve Relationship between stress and strain is linear Hooke's Law:   e  =  E e   where  E  =  modulus of elasticity Material returns to its original length when stress is removed E  is a measure of the inherent stiffness of a material Its value differs for different materials
Yield Point in  Stress‑Strain Curve As stress increases, a point in the linear relationship is finally reached when the material begins to yield Yield point   Y  can be identified by the change in slope at the upper end of the linear region  Y  = a strength property Other names for yield point: Yield strength Yield stress Elastic limit
Plastic Region in  Stress‑Strain Curve Yield point marks the beginning of plastic deformation The stress-strain relationship is no longer guided by Hooke's Law  As load is increased beyond  Y , elongation proceeds at a much faster rate than before, causing the slope of the curve to change dramatically
Tensile Strength in  Stress‑Strain Curve Elongation is accompanied by a uniform reduction in cross‑sectional area, consistent with maintaining constant volume  Finally, the applied load  F  reaches a maximum value, and engineering stress at this point is called the  tensile strength   TS  (a.k.a. ultimate tensile strength) TS  =
Ductility in Tensile Test Ability of a material to plastically strain without fracture Ductility measure = elongation  EL where  EL  = elongation;  L f  = specimen length at fracture; and  L o  = original specimen length L f  is measured as the distance between gage marks after two pieces of specimen are put back together
True Stress Stress value obtained by dividing the instantaneous area into applied load where    = true stress;  F  = force; and  A  = actual (instantaneous) area resisting the load
True Strain Provides a more realistic assessment of "instantaneous" elongation per unit length
True Stress-Strain Curve True stress‑strain curve for previous engineering stress‑strain plot
Strain Hardening in  Stress-Strain Curve Note that true stress increases continuously in the plastic region until necking In the engineering stress‑strain curve, the significance of this was lost because stress was based on the original area value It means that the metal is becoming stronger as strain increases  This is the property called  strain hardening
True Stress-Strain  in Log-Log Plot True stress‑strain curve plotted on log‑log scale.
Flow Curve  Because it is a straight line in a log-log plot, the relationship between true stress and true strain in the plastic region is  where  K  = strength coefficient;   and  n =  strain hardening exponent
Categories of Stress-Strain Relationship: Perfectly Elastic Behavior is defined completely by modulus of elasticity  E Fractures rather than yielding to plastic flow  Brittle materials: ceramics, many cast irons, and thermosetting polymers
Stress-Strain Relationships: Elastic and Perfectly Plastic Stiffness defined by  E   Once  Y  reached, deforms plastically at same stress level  Flow curve:  K  =  Y,   n  = 0 Metals behave like this when heated to sufficiently high temperatures (above recrystallization)
Stress-Strain Relationships: Elastic and Strain Hardening Hooke's Law in elastic region, yields at  Y Flow curve:  K  >  Y ,  n  > 0 Most ductile metals behave this way when cold worked
Compression Test Applies a load that squeezes the ends of a cylindrical specimen between two platens Compression force applied to test piece and resulting change in height and diameter
Compression Test Setup
Engineering Stress in Compression As the specimen is compressed, its height is reduced and cross‑sectional area is increased  e  = - where  A o  = original area of the specimen
Engineering Strain in Compression  Engineering strain is defined Since height is reduced during compression, value of  e  is negative (the negative sign is usually ignored when expressing compression strain)
Stress-Strain Curve in Compression Shape of plastic region is different from tensile test because cross section increases Calculated value of engineering stress is higher
Tensile Test vs.  Compression Test Although differences exist between engineering stress‑strain curves in tension and compression, the true stress‑strain relationships are nearly identical Since tensile test results are more common, flow curve values ( K  and  n ) from tensile test data can be applied to compression operations  When using tensile  K  and  n  data for compression, ignore necking, which is a phenomenon peculiar to strain induced by tensile stresses
Testing of Brittle Materials Hard brittle materials (e.g., ceramics) possess elasticity but little or no plasticity Conventional tensile test cannot be easily applied Often tested by a  bending   test  (also called  flexure test ) Specimen of rectangular cross‑section is positioned between two supports, and a load is applied at its center
Bending Test Bending of a rectangular cross section results in both tensile and compressive stresses in the material: (left) initial loading; (right) highly stressed and strained specimen
Testing of Brittle Materials Brittle materials do not flex They deform elastically until fracture  Failure occurs because tensile strength of outer fibers of specimen are exceeded  Failure type:  cleavage  - common with ceramics and metals at low temperatures, in which separation rather than slip occurs along certain crystallographic planes
Transverse Rupture Strength The strength value derived from the bending test: where  TRS  = transverse rupture strength;  F  = applied load at fracture;  L  = length of specimen between supports; and  b  and  t  are dimensions of cross section
Shear Properties Application of stresses in opposite directions on either side of a thin element: (a) shear stress and (b) shear strain
Shear Stress and Strain Shear stress  defined as  where  F  = applied force; and  A  = area over which deflection occurs. Shear strain  defined as where    = deflection element; and  b  = distance over which deflection occurs
Torsion Stress-Strain Curve Typical shear stress‑strain curve from a torsion test
Shear Elastic Stress‑Strain Relationship  In the elastic region, the relationship is defined as where G = shear modulus, or shear modulus of elasticity For most materials,  G     0.4 E , where  E  = elastic  modulus
Shear Plastic Stress‑Strain Relationship  Relationship similar to flow curve for a tensile test Shear stress at fracture = shear strength  S Shear strength can be estimated from tensile strength:  S     0.7( TS ) Since cross‑sectional area of test specimen in torsion test does not change as in tensile and compression, engineering stress‑strain curve for shear    true stress‑strain curve
Hardness Resistance to permanent indentation  Good hardness generally means material is resistant to scratching and wear Most tooling used in manufacturing must be hard for scratch and wear resistance
Hardness Tests  Commonly used for assessing material properties because they are quick and convenient Variety of testing methods are appropriate due to differences in hardness among different materials  Most well‑known hardness tests are Brinell and Rockwell  Other test methods are also available, such as Vickers, Knoop, Scleroscope, and durometer
Widely used for testing metals and nonmetals of low to medium hardness  A hard ball is pressed into specimen surface with a load of 500, 1500, or 3000 kg Brinell Hardness Test
Brinell Hardness Number Load divided into indentation area = Brinell Hardness Number (BHN) where  HB  = Brinell Hardness Number (BHN),  F  = indentation load, kg;  D b  = diameter of ball, mm, and  D i  = diameter of indentation, mm
Rockwell Hardness Test Another widely used test A cone shaped indenter is pressed into specimen using a minor load of 10 kg, thus seating indenter in material Then, a major load of 150 kg is applied, causing indenter to penetrate beyond its initial position Additional penetration distance  d  is converted into a Rockwell hardness reading by the testing machine
Rockwell Hardness Test (1) initial minor load and (2) major load.
Effect of Temperature on Properties General effect of temperature on strength and ductility
Hot Hardness Ability of a material to retain hardness at elevated temperatures Typical hardness as a function of temperature for several materials
Recrystallization in Metals Most metals strain harden at room temperature according to the flow curve ( n  > 0) But if heated to sufficiently high temperature and deformed, strain hardening does not occur Instead, new grains form that are free of strain  The metal has recrystallized The metal behaves as a perfectly plastic material; that is,  n  = 0
Recrystallization Temperature Recrystallization temperature of a given metal = about one‑half its melting point (0.5  T m ) as measured on an absolute temperature scale Recrystallization takes time  The recrystallization temperature is specified as the temperature at which new grains are formed in about one hour
Recrystallization and Manufacturing Recrystallization can be exploited in manufacturing  Heating a metal to its recrystallization temperature prior to deformation allows a greater amount of straining Lower forces and power are required to perform the process  Forming a metal at temperatures above its recrystallization temperature is called hot working
Fluid Properties and Manufacturing Fluids flow - they take the shape of the container that holds them Many manufacturing processes are accomplished on materials converted from solid to liquid by heating Called solidification processes Examples:  Metals are cast in molten state  Glass is formed in a heated and fluid state  Polymers are almost always shaped as fluids
Viscosity in Fluids Viscosity is the resistance to flow that is characteristic of a given fluid Flow is a defining characteristic of fluids, but the tendency to flow varies for different fluids  Viscosity is a measure of the internal friction when velocity gradients are present in the fluid The more viscous the fluid, the higher the internal friction and the greater the resistance to flow  Reciprocal of viscosity is fluidity
Viscosity Viscosity can be defined using two parallel plates separated by a distance  d  and a   fluid fills the space between the two plates
Shear Stress Shear stress is the frictional force exerted by the fluid per unit area  Motion of the upper plate is resisted by this frictional force resulting from the shear viscosity of the fluid  This force  F  can be reduced to a shear stress     by dividing by plate area  A
Shear Rate Shear stress is related to shear rate, defined as the change in velocity  dv  relative to  dy where  = shear rate, 1/s;  dv  = change in velocity, m/s; and  dy  = change in distance  y , m Shear rate = velocity gradient perpendicular to flow direction
Shear Viscosity Shear viscosity is the fluid property that defines the relationship between F/A and  dv / dy ; that is,  or  where    = a constant of proportionality called the  coefficient of viscosity , Pa-s  For  Newtonian  fluids, viscosity is a constant  For non-Newtonian fluids, it is not
Coefficient of Viscosity Rearranging, coefficient of viscosity can be expressed: Viscosity of a fluid is the ratio of shear stress to shear rate during flow
Flow Rate and  Viscosity of Polymers Viscosity of a thermoplastic polymer melt is not constant  It is affected by flow rate  Its behavior is non-Newtonian  A fluid that exhibits this decreasing viscosity with increasing shear rate is called pseudoplastic  This behavior complicates analysis of polymer shaping processes such as injection molding
Newtonian versus Pseudoplastic Fluids Viscous behaviors of Newtonian and pseudoplastic fluids  Polymer melts exhibit pseudoplastic behavior For comparison, the behavior of a plastic solid material is shown.
Viscoelastic Behavior Material property that determines the strain that the material experiences when subjected to combinations of stress and temperature over time Combination of viscosity and elasticity
Elastic Behavior vs.  Viscoelastic Behavior (a) Response of elastic material; and (b) response of a viscoelastic material Material in (b) takes a strain that depends on time and temperature

Ch03

  • 1.
    MECHANICAL PROPERTIES OF MATERIALS Stress‑Strain Relationships Hardness Effect of Temperature on Properties Fluid Properties Viscoelastic Behavior of Polymers
  • 2.
    Mechanical Properties in Design and Manufacturing Mechanical properties determine a material’s behavior when subjected to mechanical stresses Properties include elastic modulus, ductility, hardness, and various measures of strength Dilemma: mechanical properties that are desirable to the designer, such as high strength, usually make manufacturing more difficult
  • 3.
    Stress‑Strain Relationships Threetypes of static stresses to which materials can be subjected: Tensile - stretching the material Compressive - squeezing the material Shear - causing adjacent portions of the material to slide against each other Stress‑strain curve - basic relationship that describes mechanical properties for all three types
  • 4.
    Tensile Test Mostcommon test for studying stress‑strain relationship, especially metals In the test, a force pulls the material, elongating it and reducing its diameter (left) Tensile force applied and (right) resulting elongation of material
  • 5.
    Tensile Test SpecimenASTM (American Society for Testing and Materials) specifies preparation of test specimen
  • 6.
    Tensile Test SetupTensile testing machine
  • 7.
    Tensile Test Sequence(1) no load; (2) uniform elongation and area reduction; (3) maximum load; (4) necking; (5) fracture; (6) putting pieces back together to measure final length
  • 8.
    Engineering Stress Definedas force divided by original area: where  e = engineering stress, F = applied force, and A o = original area of test specimen
  • 9.
    Engineering Strain Definedat any point in the test as where e = engineering strain; L = length at any point during elongation; and L o = original gage length
  • 10.
    Typical Engineering Stress-Strain Plot Typical engineering stress‑strain plot in a tensile test of a metal Two regions: Elastic region Plastic region
  • 11.
    Elastic Region in Stress‑Strain Curve Relationship between stress and strain is linear Hooke's Law:  e = E e where E = modulus of elasticity Material returns to its original length when stress is removed E is a measure of the inherent stiffness of a material Its value differs for different materials
  • 12.
    Yield Point in Stress‑Strain Curve As stress increases, a point in the linear relationship is finally reached when the material begins to yield Yield point Y can be identified by the change in slope at the upper end of the linear region Y = a strength property Other names for yield point: Yield strength Yield stress Elastic limit
  • 13.
    Plastic Region in Stress‑Strain Curve Yield point marks the beginning of plastic deformation The stress-strain relationship is no longer guided by Hooke's Law As load is increased beyond Y , elongation proceeds at a much faster rate than before, causing the slope of the curve to change dramatically
  • 14.
    Tensile Strength in Stress‑Strain Curve Elongation is accompanied by a uniform reduction in cross‑sectional area, consistent with maintaining constant volume Finally, the applied load F reaches a maximum value, and engineering stress at this point is called the tensile strength TS (a.k.a. ultimate tensile strength) TS =
  • 15.
    Ductility in TensileTest Ability of a material to plastically strain without fracture Ductility measure = elongation EL where EL = elongation; L f = specimen length at fracture; and L o = original specimen length L f is measured as the distance between gage marks after two pieces of specimen are put back together
  • 16.
    True Stress Stressvalue obtained by dividing the instantaneous area into applied load where  = true stress; F = force; and A = actual (instantaneous) area resisting the load
  • 17.
    True Strain Providesa more realistic assessment of "instantaneous" elongation per unit length
  • 18.
    True Stress-Strain CurveTrue stress‑strain curve for previous engineering stress‑strain plot
  • 19.
    Strain Hardening in Stress-Strain Curve Note that true stress increases continuously in the plastic region until necking In the engineering stress‑strain curve, the significance of this was lost because stress was based on the original area value It means that the metal is becoming stronger as strain increases This is the property called strain hardening
  • 20.
    True Stress-Strain in Log-Log Plot True stress‑strain curve plotted on log‑log scale.
  • 21.
    Flow Curve Because it is a straight line in a log-log plot, the relationship between true stress and true strain in the plastic region is where K = strength coefficient; and n = strain hardening exponent
  • 22.
    Categories of Stress-StrainRelationship: Perfectly Elastic Behavior is defined completely by modulus of elasticity E Fractures rather than yielding to plastic flow Brittle materials: ceramics, many cast irons, and thermosetting polymers
  • 23.
    Stress-Strain Relationships: Elasticand Perfectly Plastic Stiffness defined by E Once Y reached, deforms plastically at same stress level Flow curve: K = Y, n = 0 Metals behave like this when heated to sufficiently high temperatures (above recrystallization)
  • 24.
    Stress-Strain Relationships: Elasticand Strain Hardening Hooke's Law in elastic region, yields at Y Flow curve: K > Y , n > 0 Most ductile metals behave this way when cold worked
  • 25.
    Compression Test Appliesa load that squeezes the ends of a cylindrical specimen between two platens Compression force applied to test piece and resulting change in height and diameter
  • 26.
  • 27.
    Engineering Stress inCompression As the specimen is compressed, its height is reduced and cross‑sectional area is increased  e = - where A o = original area of the specimen
  • 28.
    Engineering Strain inCompression Engineering strain is defined Since height is reduced during compression, value of e is negative (the negative sign is usually ignored when expressing compression strain)
  • 29.
    Stress-Strain Curve inCompression Shape of plastic region is different from tensile test because cross section increases Calculated value of engineering stress is higher
  • 30.
    Tensile Test vs. Compression Test Although differences exist between engineering stress‑strain curves in tension and compression, the true stress‑strain relationships are nearly identical Since tensile test results are more common, flow curve values ( K and n ) from tensile test data can be applied to compression operations When using tensile K and n data for compression, ignore necking, which is a phenomenon peculiar to strain induced by tensile stresses
  • 31.
    Testing of BrittleMaterials Hard brittle materials (e.g., ceramics) possess elasticity but little or no plasticity Conventional tensile test cannot be easily applied Often tested by a bending test (also called flexure test ) Specimen of rectangular cross‑section is positioned between two supports, and a load is applied at its center
  • 32.
    Bending Test Bendingof a rectangular cross section results in both tensile and compressive stresses in the material: (left) initial loading; (right) highly stressed and strained specimen
  • 33.
    Testing of BrittleMaterials Brittle materials do not flex They deform elastically until fracture Failure occurs because tensile strength of outer fibers of specimen are exceeded Failure type: cleavage - common with ceramics and metals at low temperatures, in which separation rather than slip occurs along certain crystallographic planes
  • 34.
    Transverse Rupture StrengthThe strength value derived from the bending test: where TRS = transverse rupture strength; F = applied load at fracture; L = length of specimen between supports; and b and t are dimensions of cross section
  • 35.
    Shear Properties Applicationof stresses in opposite directions on either side of a thin element: (a) shear stress and (b) shear strain
  • 36.
    Shear Stress andStrain Shear stress defined as where F = applied force; and A = area over which deflection occurs. Shear strain defined as where  = deflection element; and b = distance over which deflection occurs
  • 37.
    Torsion Stress-Strain CurveTypical shear stress‑strain curve from a torsion test
  • 38.
    Shear Elastic Stress‑StrainRelationship In the elastic region, the relationship is defined as where G = shear modulus, or shear modulus of elasticity For most materials, G  0.4 E , where E = elastic modulus
  • 39.
    Shear Plastic Stress‑StrainRelationship Relationship similar to flow curve for a tensile test Shear stress at fracture = shear strength S Shear strength can be estimated from tensile strength: S  0.7( TS ) Since cross‑sectional area of test specimen in torsion test does not change as in tensile and compression, engineering stress‑strain curve for shear  true stress‑strain curve
  • 40.
    Hardness Resistance topermanent indentation Good hardness generally means material is resistant to scratching and wear Most tooling used in manufacturing must be hard for scratch and wear resistance
  • 41.
    Hardness Tests Commonly used for assessing material properties because they are quick and convenient Variety of testing methods are appropriate due to differences in hardness among different materials Most well‑known hardness tests are Brinell and Rockwell Other test methods are also available, such as Vickers, Knoop, Scleroscope, and durometer
  • 42.
    Widely used fortesting metals and nonmetals of low to medium hardness A hard ball is pressed into specimen surface with a load of 500, 1500, or 3000 kg Brinell Hardness Test
  • 43.
    Brinell Hardness NumberLoad divided into indentation area = Brinell Hardness Number (BHN) where HB = Brinell Hardness Number (BHN), F = indentation load, kg; D b = diameter of ball, mm, and D i = diameter of indentation, mm
  • 44.
    Rockwell Hardness TestAnother widely used test A cone shaped indenter is pressed into specimen using a minor load of 10 kg, thus seating indenter in material Then, a major load of 150 kg is applied, causing indenter to penetrate beyond its initial position Additional penetration distance d is converted into a Rockwell hardness reading by the testing machine
  • 45.
    Rockwell Hardness Test(1) initial minor load and (2) major load.
  • 46.
    Effect of Temperatureon Properties General effect of temperature on strength and ductility
  • 47.
    Hot Hardness Abilityof a material to retain hardness at elevated temperatures Typical hardness as a function of temperature for several materials
  • 48.
    Recrystallization in MetalsMost metals strain harden at room temperature according to the flow curve ( n > 0) But if heated to sufficiently high temperature and deformed, strain hardening does not occur Instead, new grains form that are free of strain The metal has recrystallized The metal behaves as a perfectly plastic material; that is, n = 0
  • 49.
    Recrystallization Temperature Recrystallizationtemperature of a given metal = about one‑half its melting point (0.5 T m ) as measured on an absolute temperature scale Recrystallization takes time The recrystallization temperature is specified as the temperature at which new grains are formed in about one hour
  • 50.
    Recrystallization and ManufacturingRecrystallization can be exploited in manufacturing Heating a metal to its recrystallization temperature prior to deformation allows a greater amount of straining Lower forces and power are required to perform the process Forming a metal at temperatures above its recrystallization temperature is called hot working
  • 51.
    Fluid Properties andManufacturing Fluids flow - they take the shape of the container that holds them Many manufacturing processes are accomplished on materials converted from solid to liquid by heating Called solidification processes Examples: Metals are cast in molten state Glass is formed in a heated and fluid state Polymers are almost always shaped as fluids
  • 52.
    Viscosity in FluidsViscosity is the resistance to flow that is characteristic of a given fluid Flow is a defining characteristic of fluids, but the tendency to flow varies for different fluids Viscosity is a measure of the internal friction when velocity gradients are present in the fluid The more viscous the fluid, the higher the internal friction and the greater the resistance to flow Reciprocal of viscosity is fluidity
  • 53.
    Viscosity Viscosity canbe defined using two parallel plates separated by a distance d and a fluid fills the space between the two plates
  • 54.
    Shear Stress Shearstress is the frictional force exerted by the fluid per unit area Motion of the upper plate is resisted by this frictional force resulting from the shear viscosity of the fluid This force F can be reduced to a shear stress  by dividing by plate area A
  • 55.
    Shear Rate Shearstress is related to shear rate, defined as the change in velocity dv relative to dy where = shear rate, 1/s; dv = change in velocity, m/s; and dy = change in distance y , m Shear rate = velocity gradient perpendicular to flow direction
  • 56.
    Shear Viscosity Shearviscosity is the fluid property that defines the relationship between F/A and dv / dy ; that is, or where  = a constant of proportionality called the coefficient of viscosity , Pa-s For Newtonian fluids, viscosity is a constant For non-Newtonian fluids, it is not
  • 57.
    Coefficient of ViscosityRearranging, coefficient of viscosity can be expressed: Viscosity of a fluid is the ratio of shear stress to shear rate during flow
  • 58.
    Flow Rate and Viscosity of Polymers Viscosity of a thermoplastic polymer melt is not constant It is affected by flow rate Its behavior is non-Newtonian A fluid that exhibits this decreasing viscosity with increasing shear rate is called pseudoplastic This behavior complicates analysis of polymer shaping processes such as injection molding
  • 59.
    Newtonian versus PseudoplasticFluids Viscous behaviors of Newtonian and pseudoplastic fluids Polymer melts exhibit pseudoplastic behavior For comparison, the behavior of a plastic solid material is shown.
  • 60.
    Viscoelastic Behavior Materialproperty that determines the strain that the material experiences when subjected to combinations of stress and temperature over time Combination of viscosity and elasticity
  • 61.
    Elastic Behavior vs. Viscoelastic Behavior (a) Response of elastic material; and (b) response of a viscoelastic material Material in (b) takes a strain that depends on time and temperature