Here are the calculations for the indexes requested:
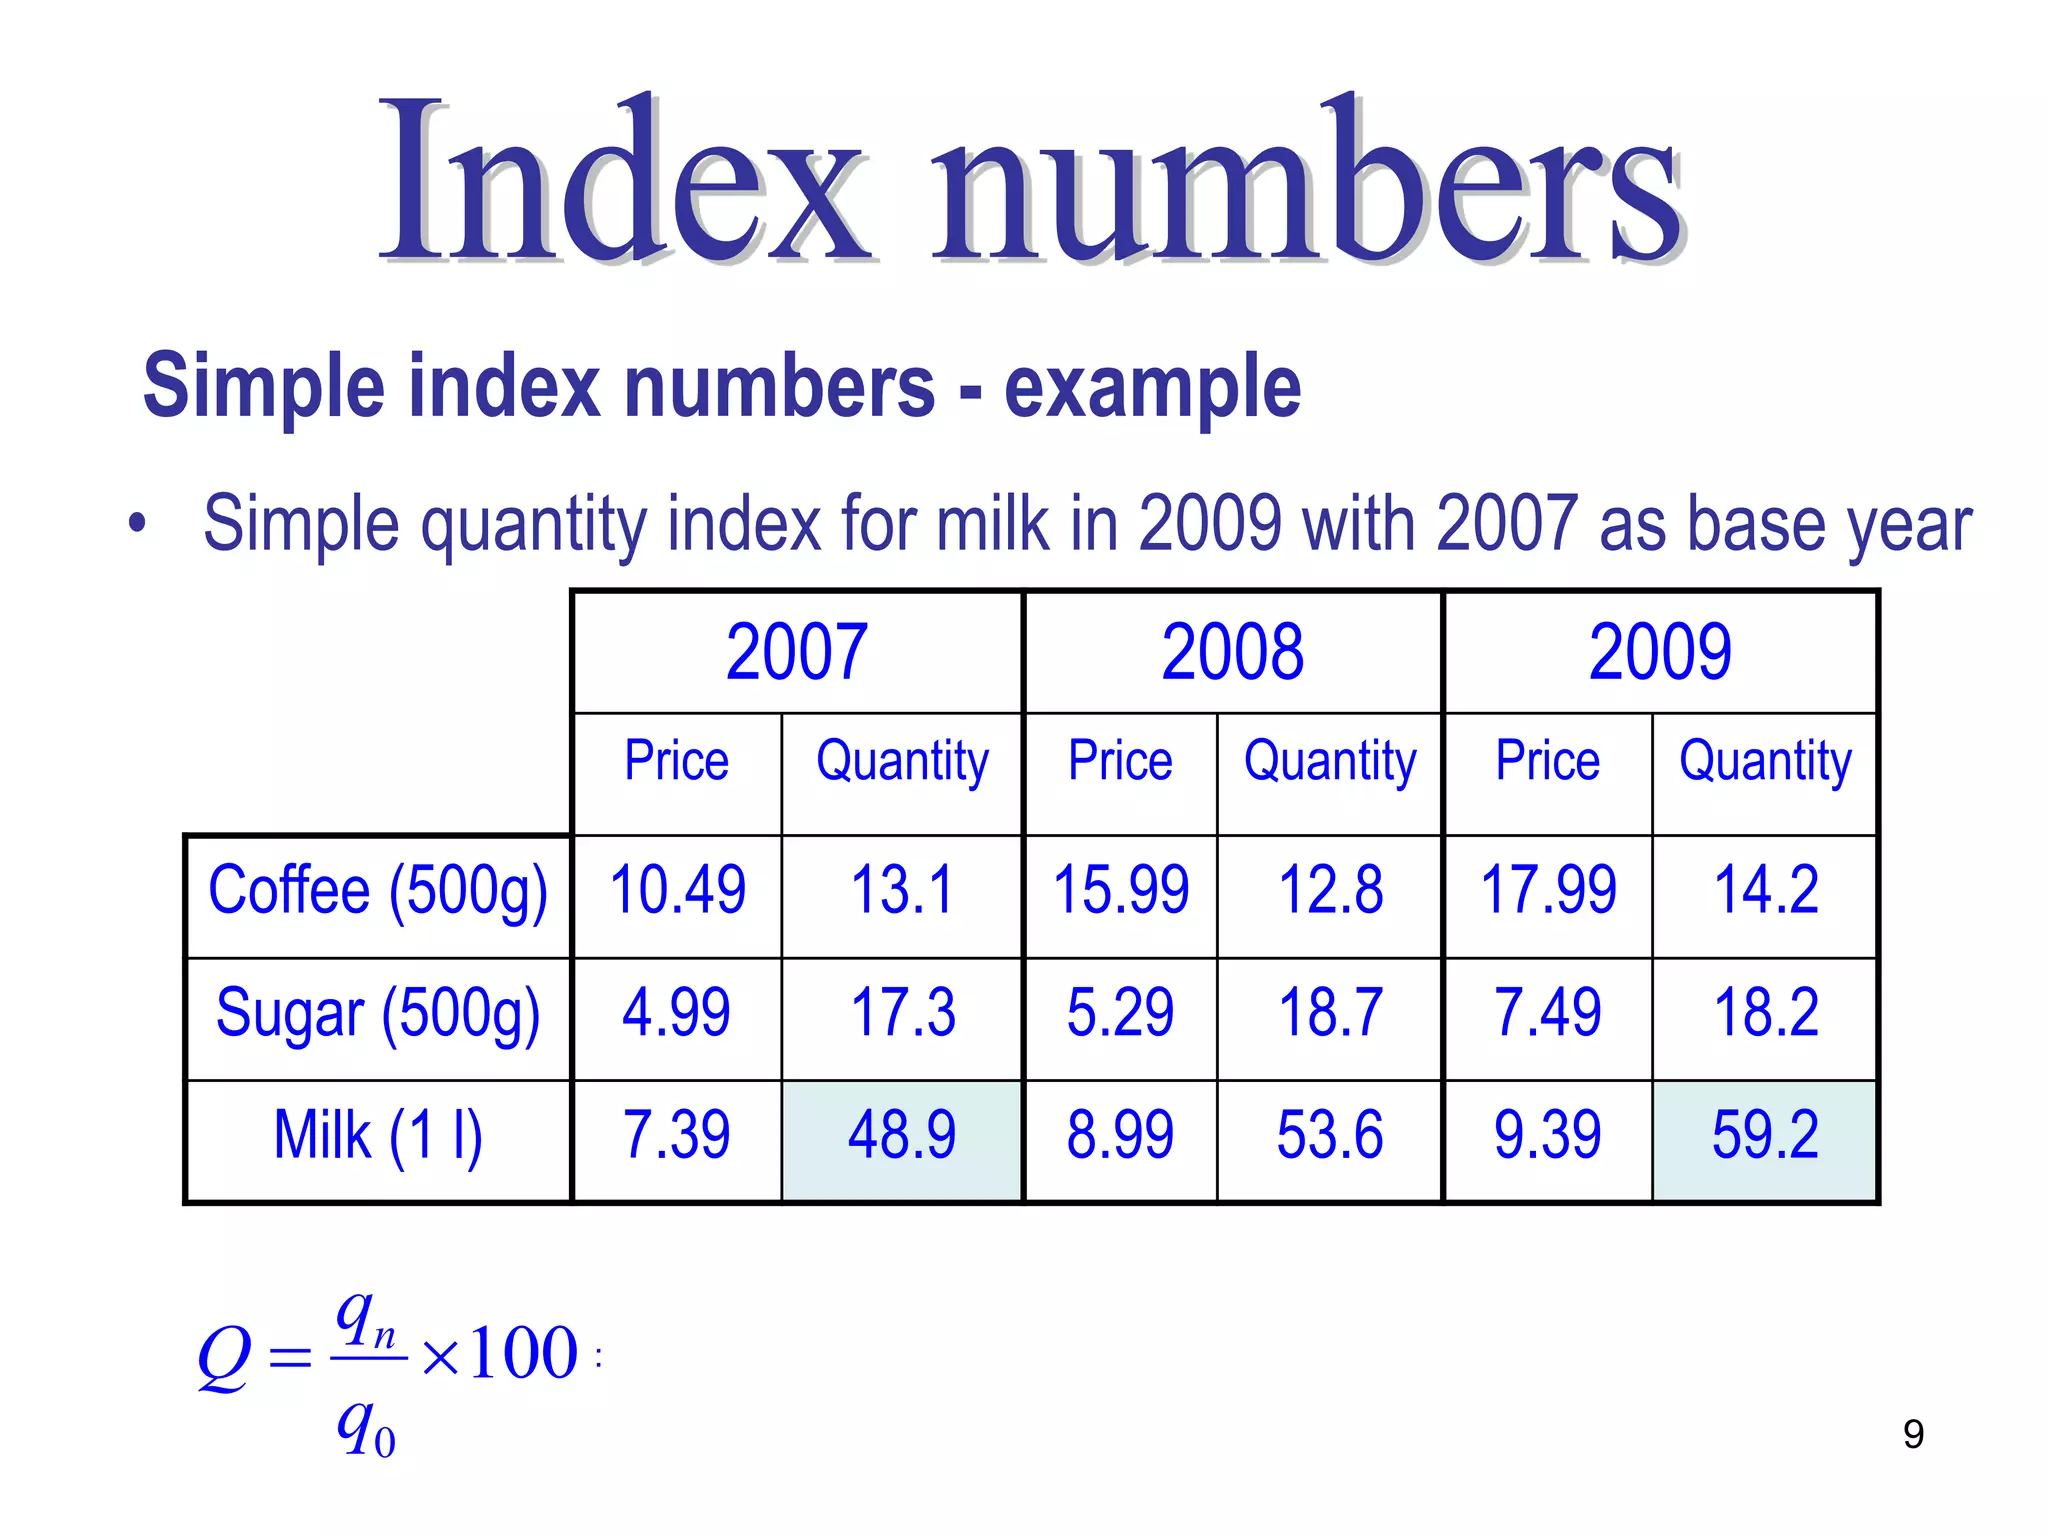
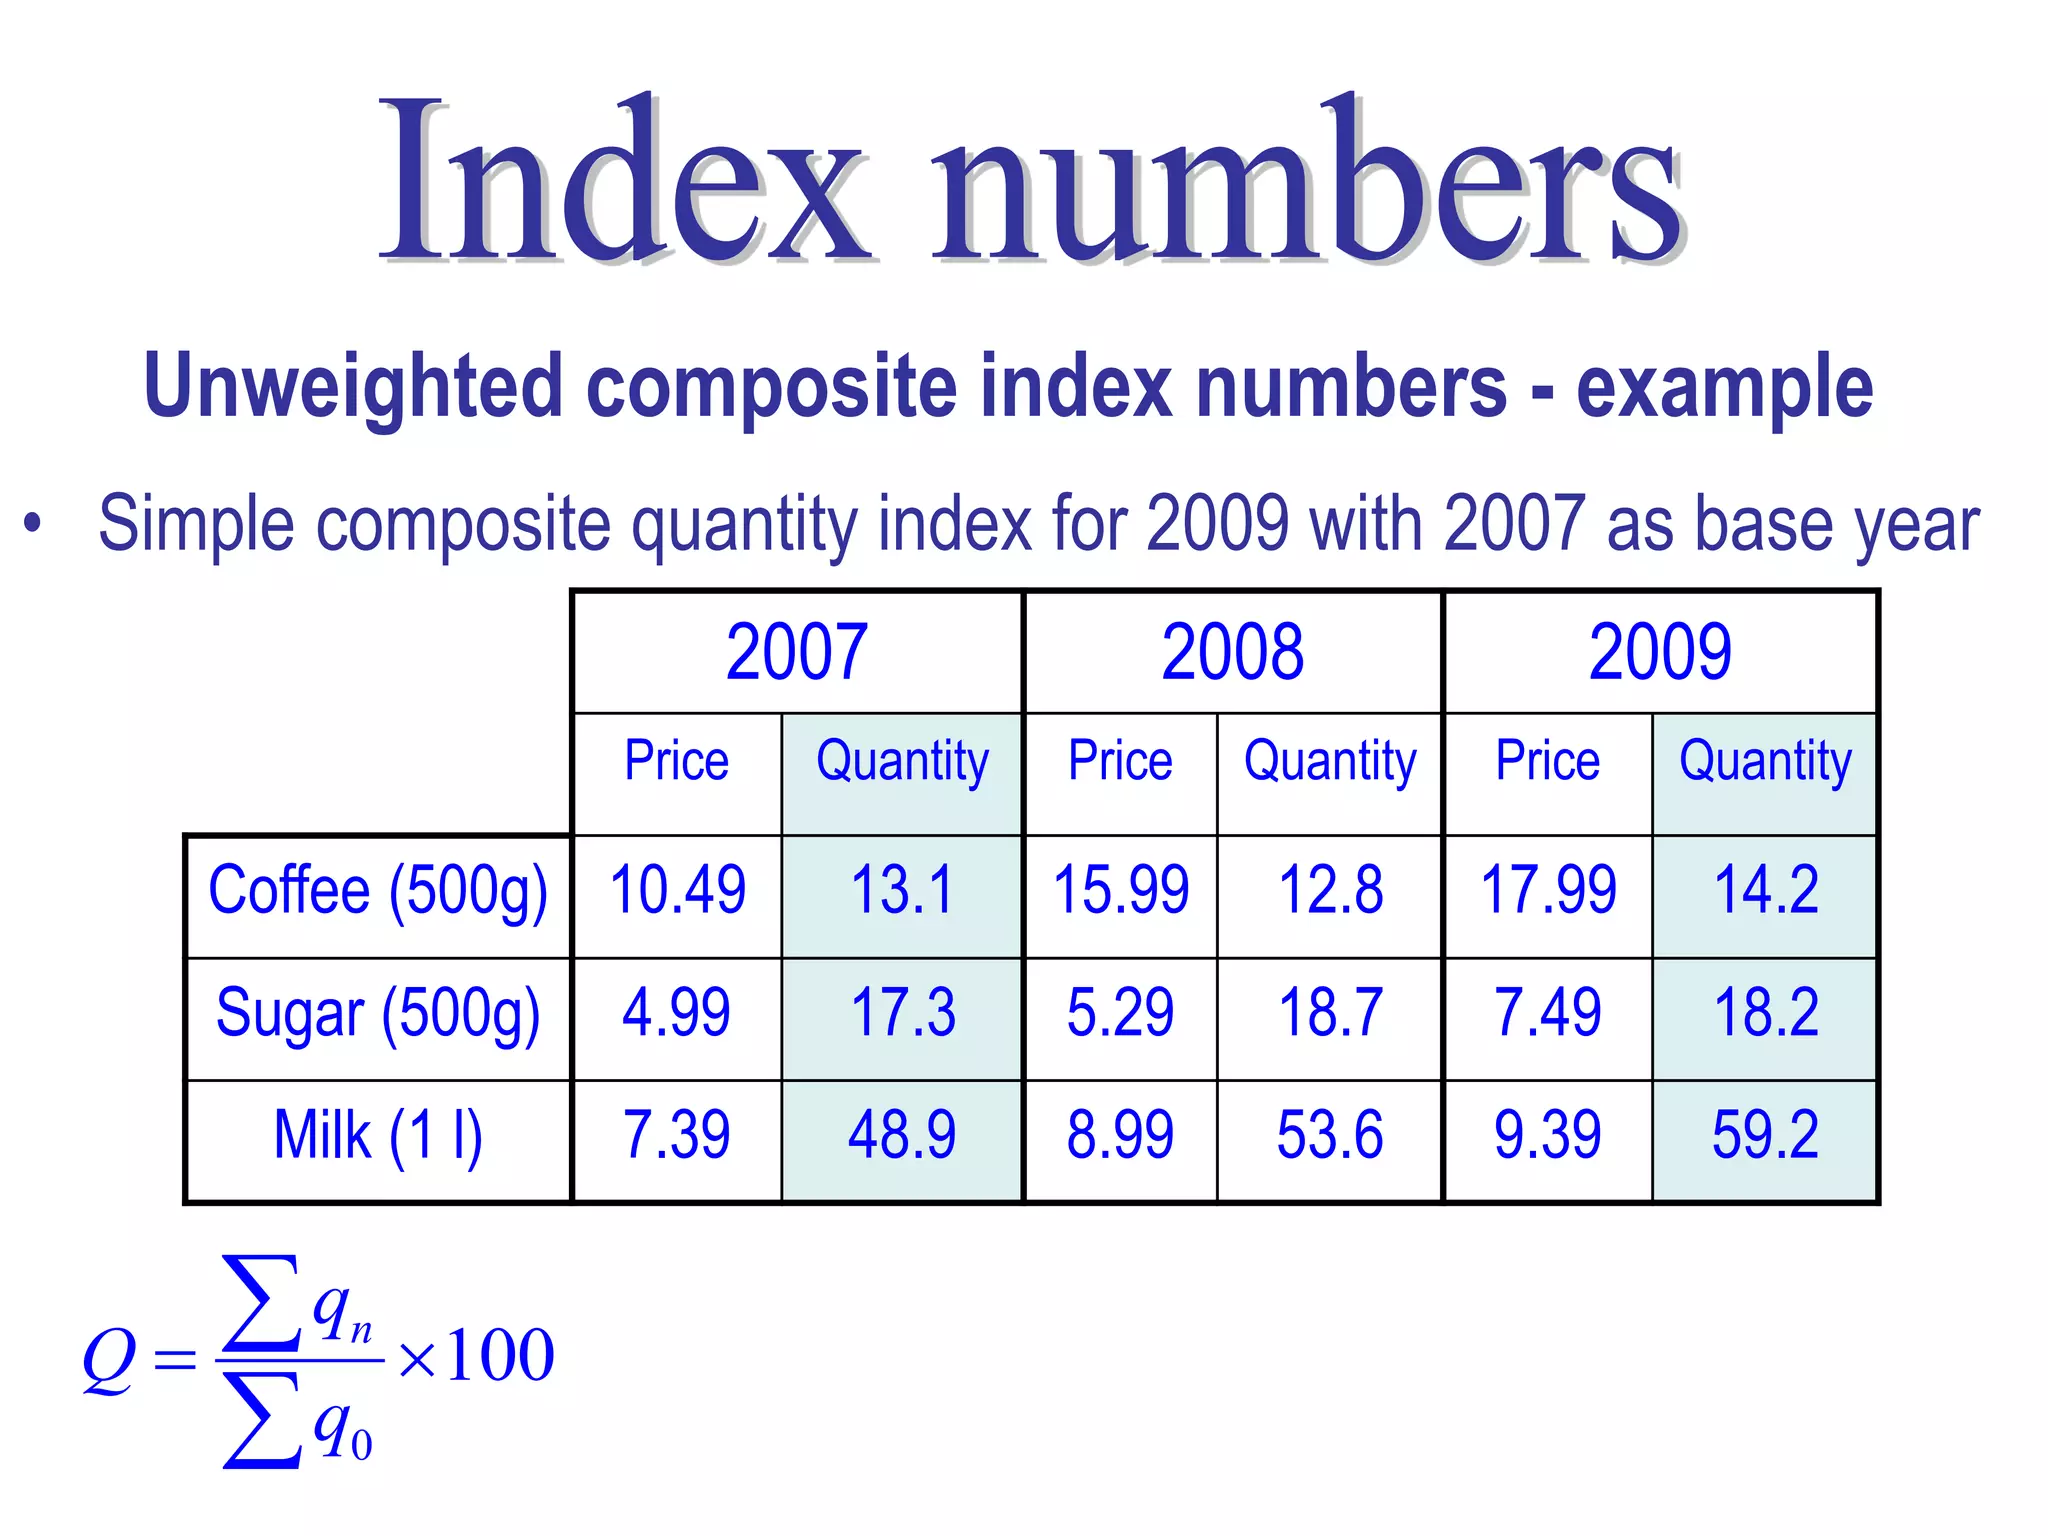
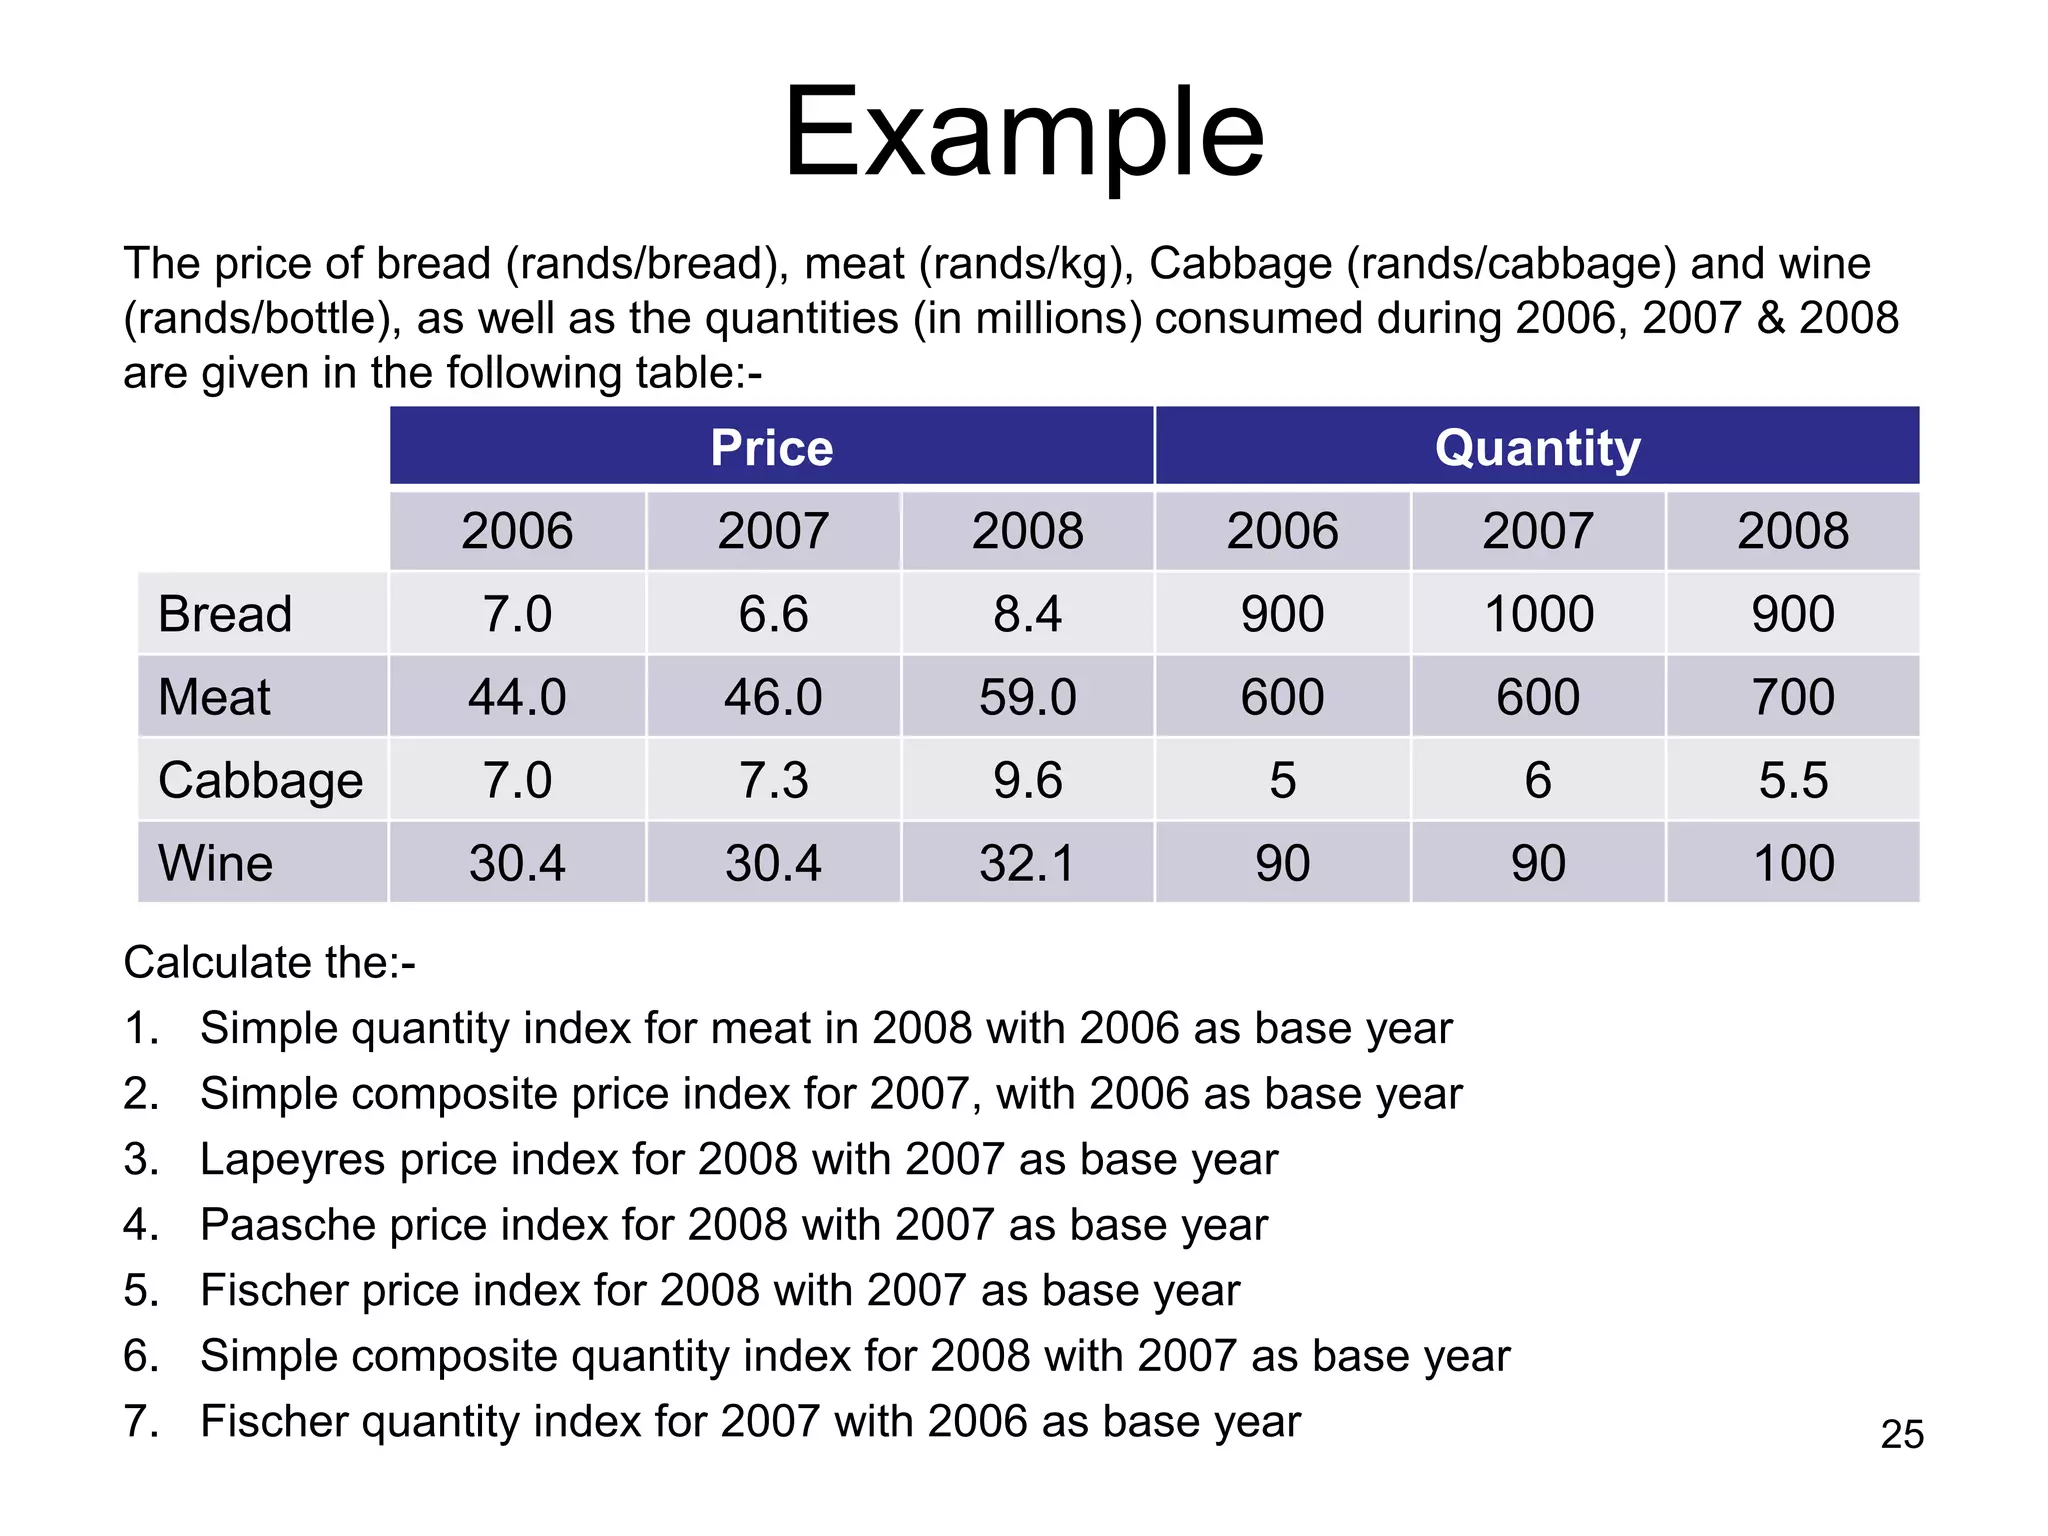
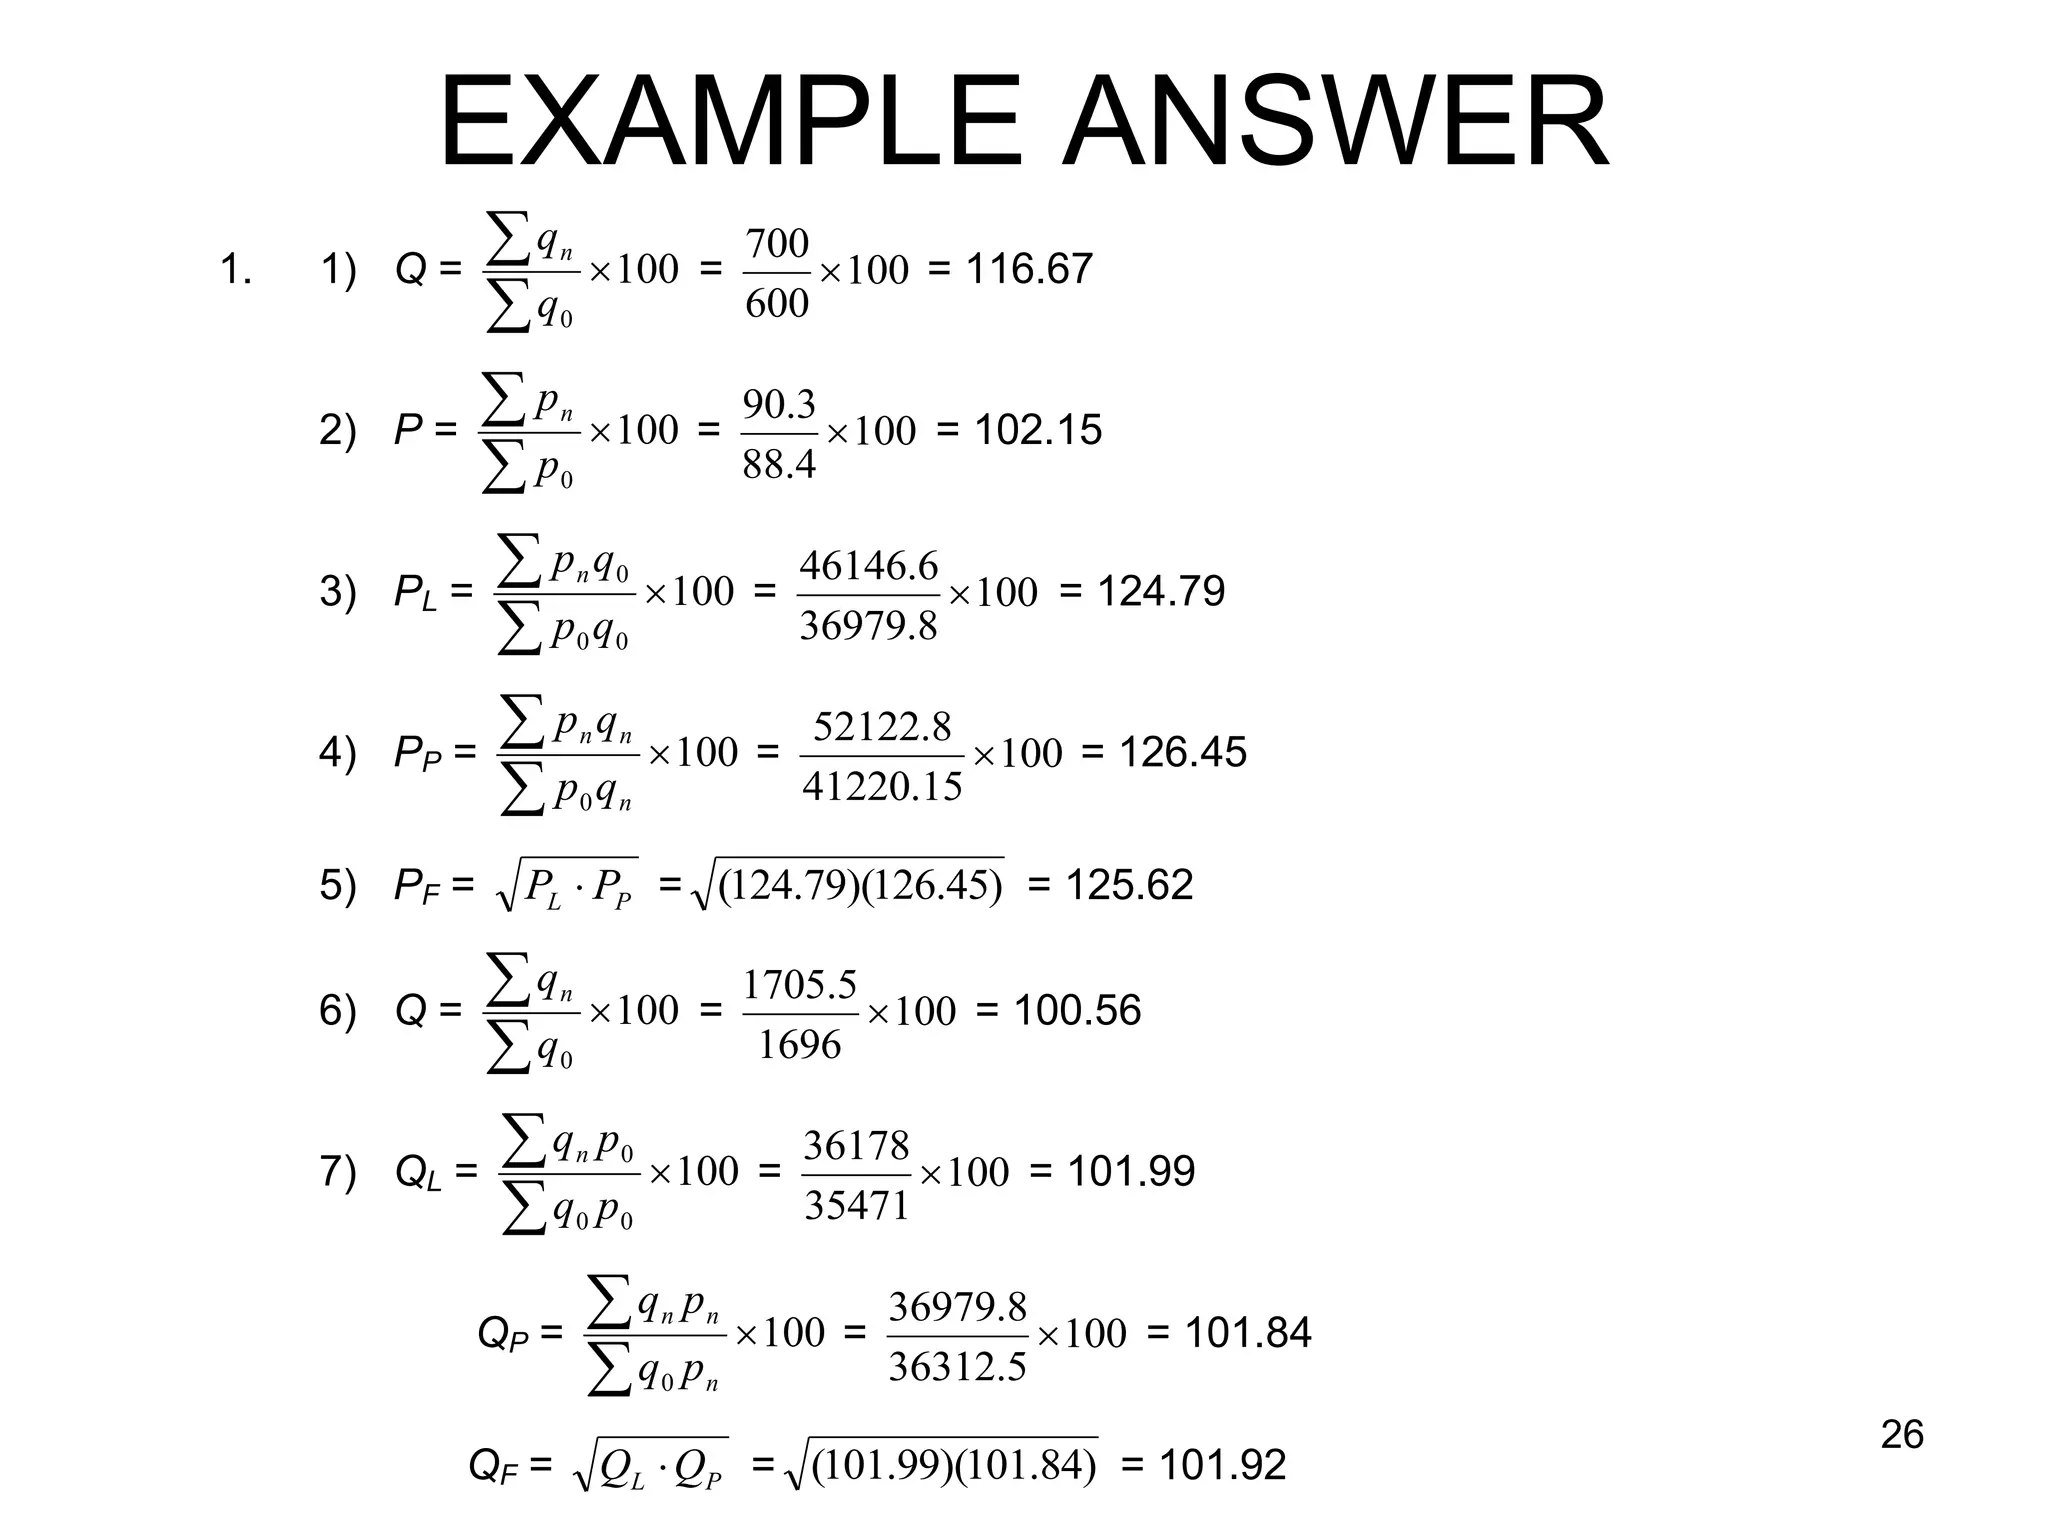
1. Simple quantity index for meat in 2008 with 2006 as base year
Qn = 700
Q0 = 600
Index = Qn/Q0 * 100 = 700/600 * 100 = 116.67
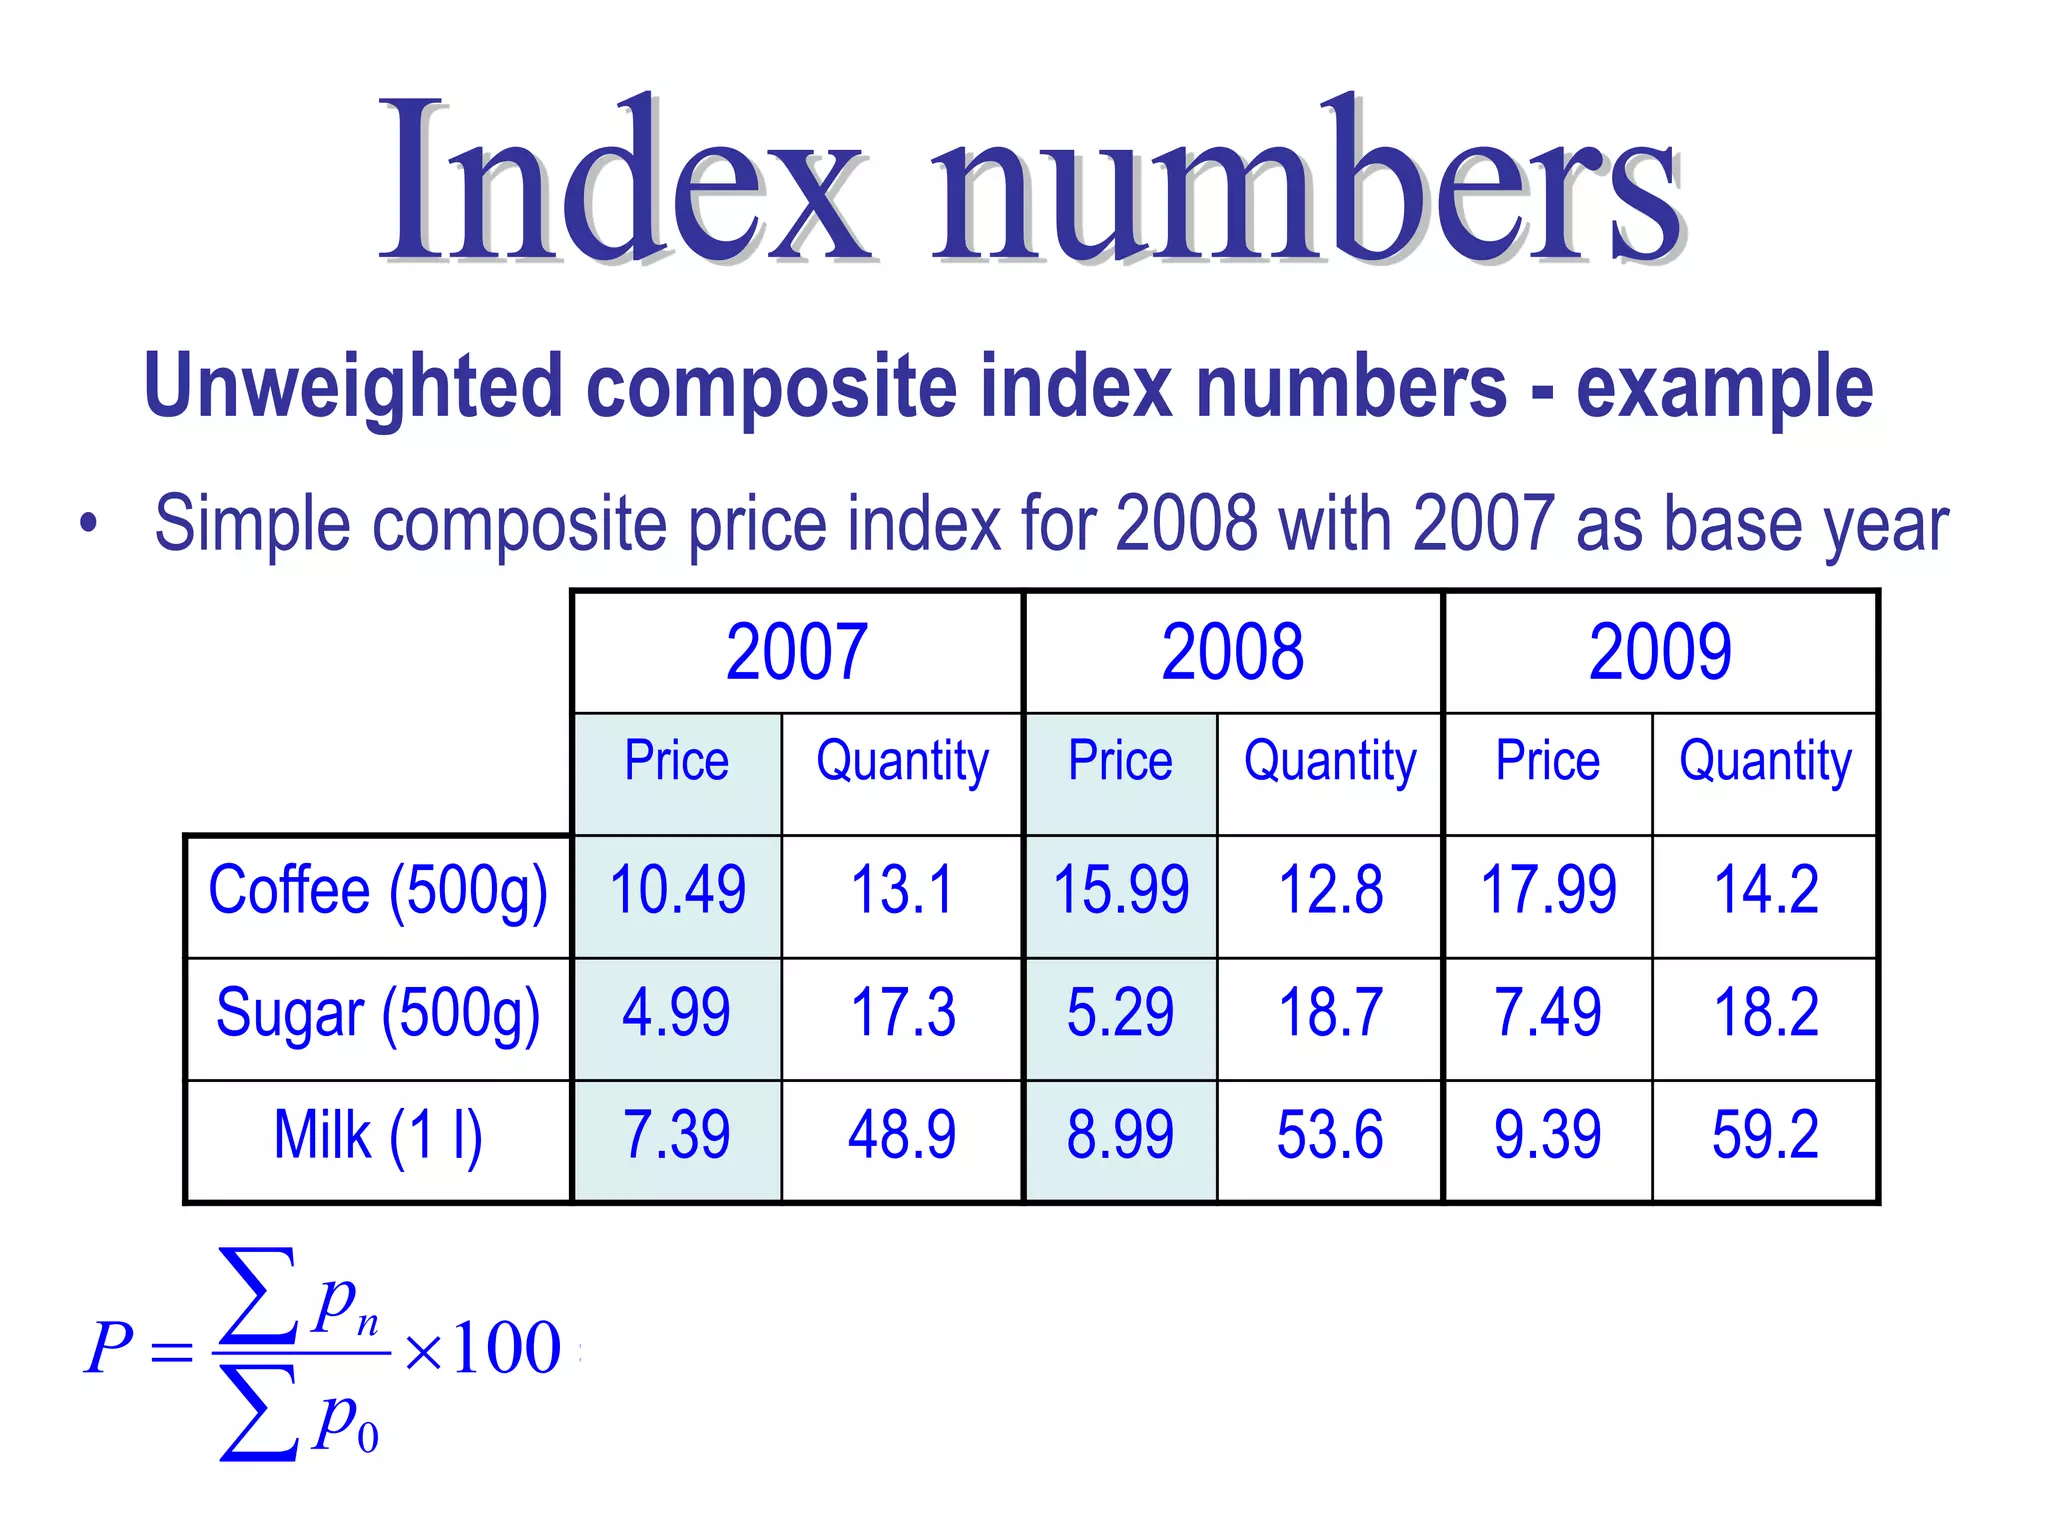
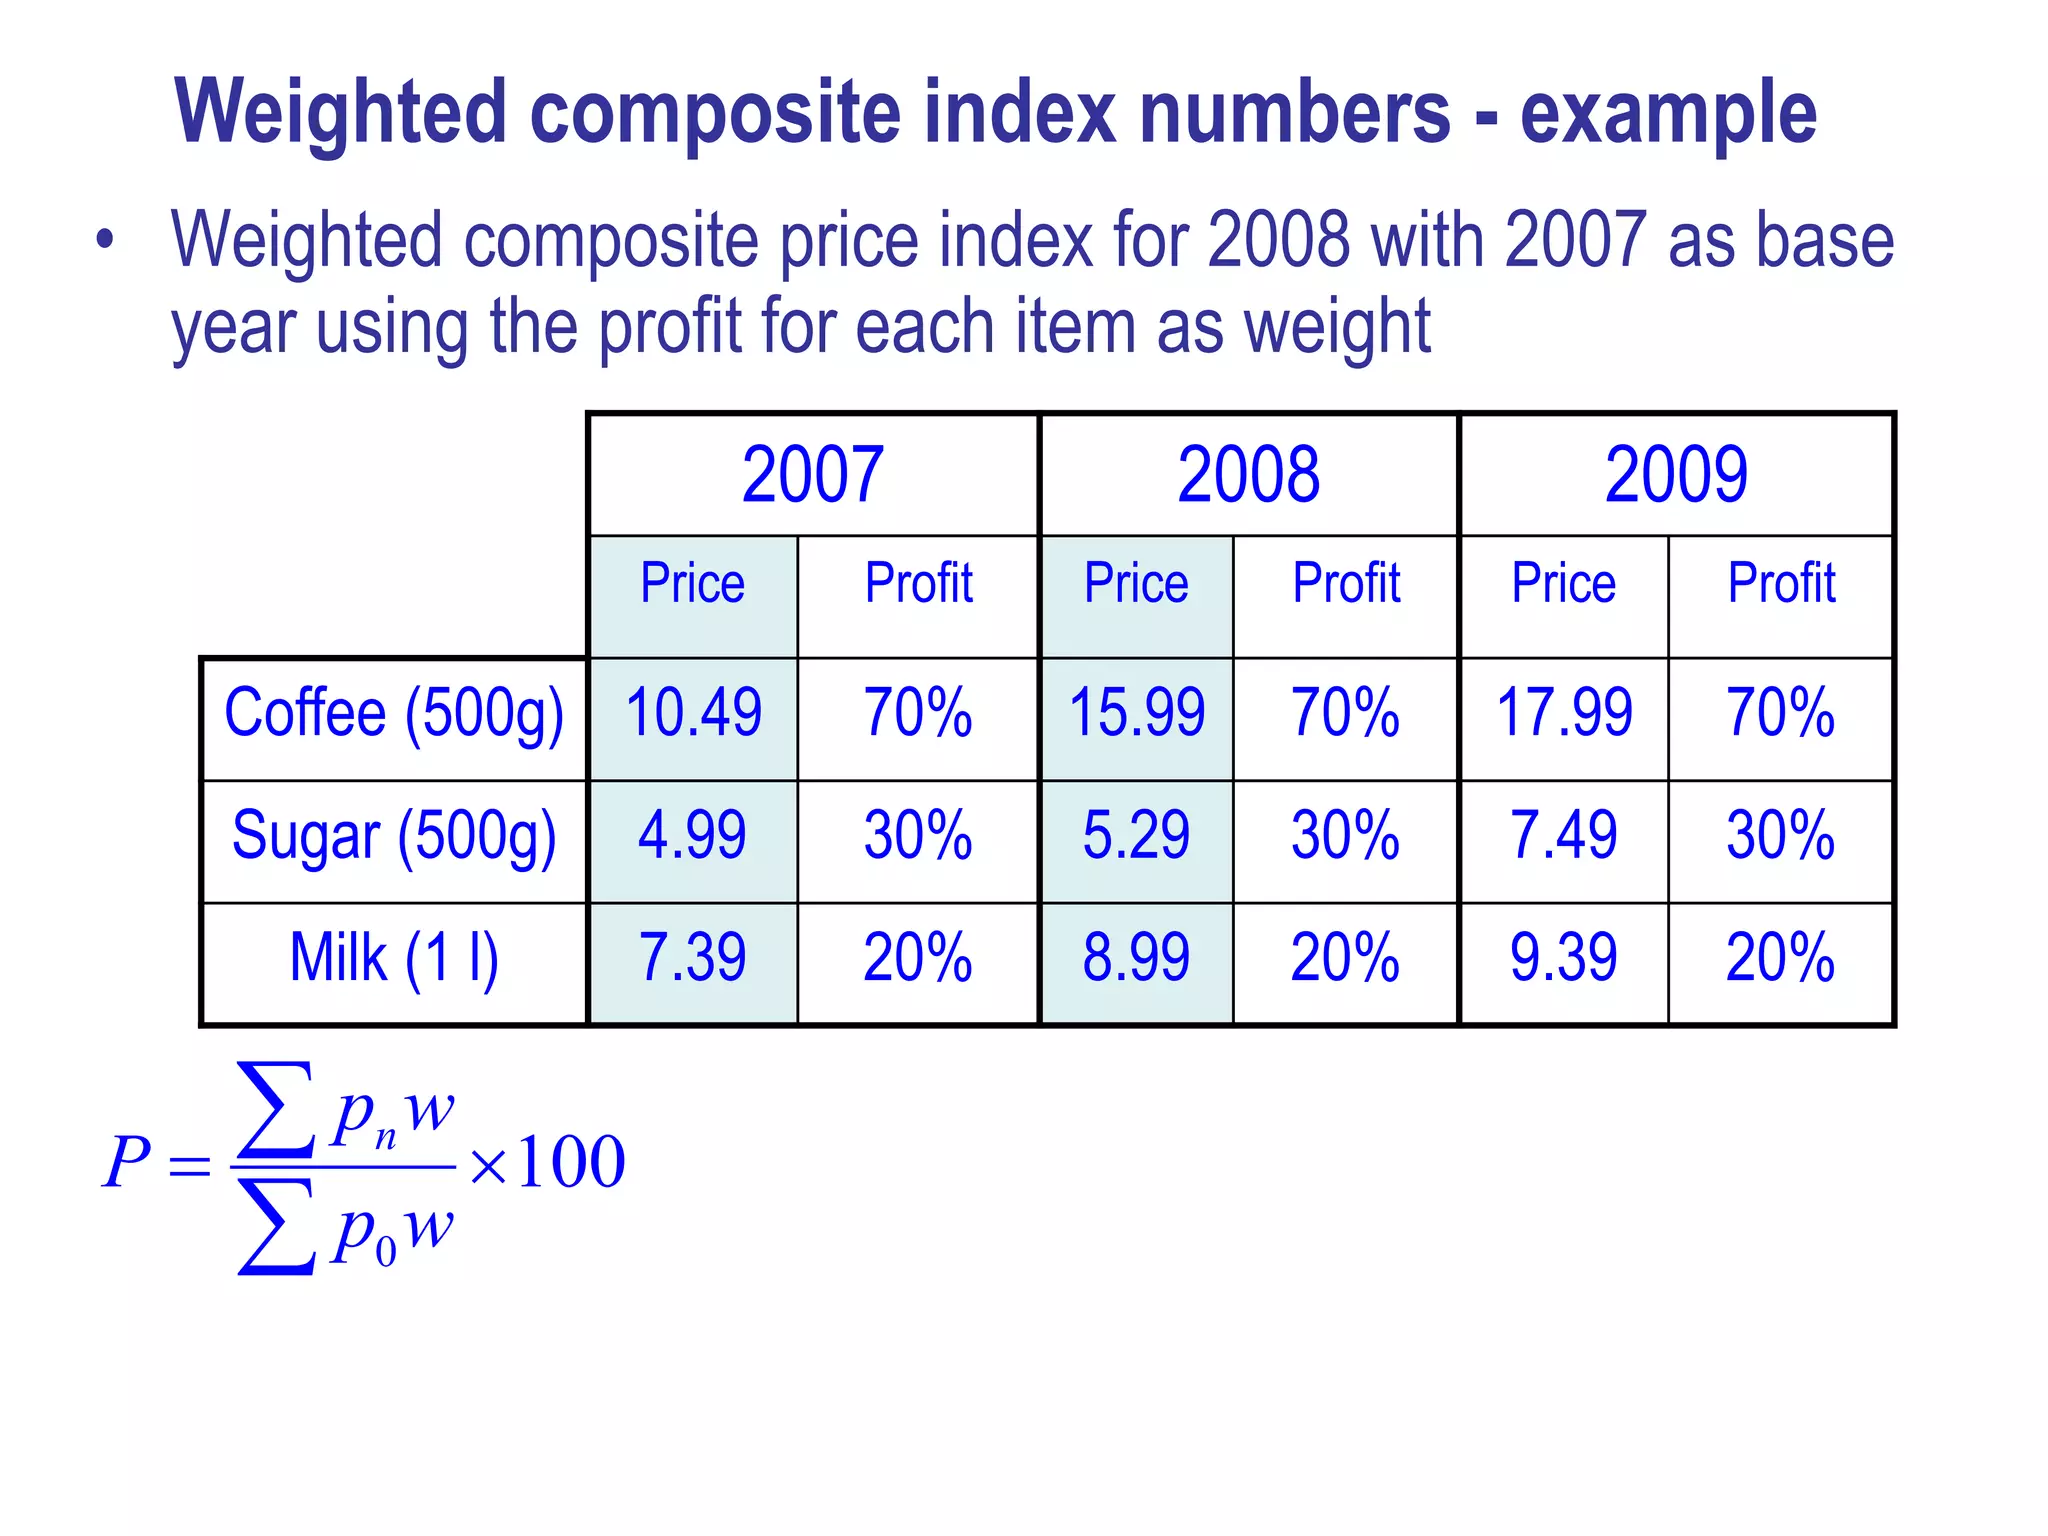
2. Simple composite price index for 2007 with 2006 as base year
ΣPn/ΣP0 * 100 = (6.6 + 46 + 7.3 + 30.4)/(7 + 44 + 7 + 30.4) * 100 = 103.57
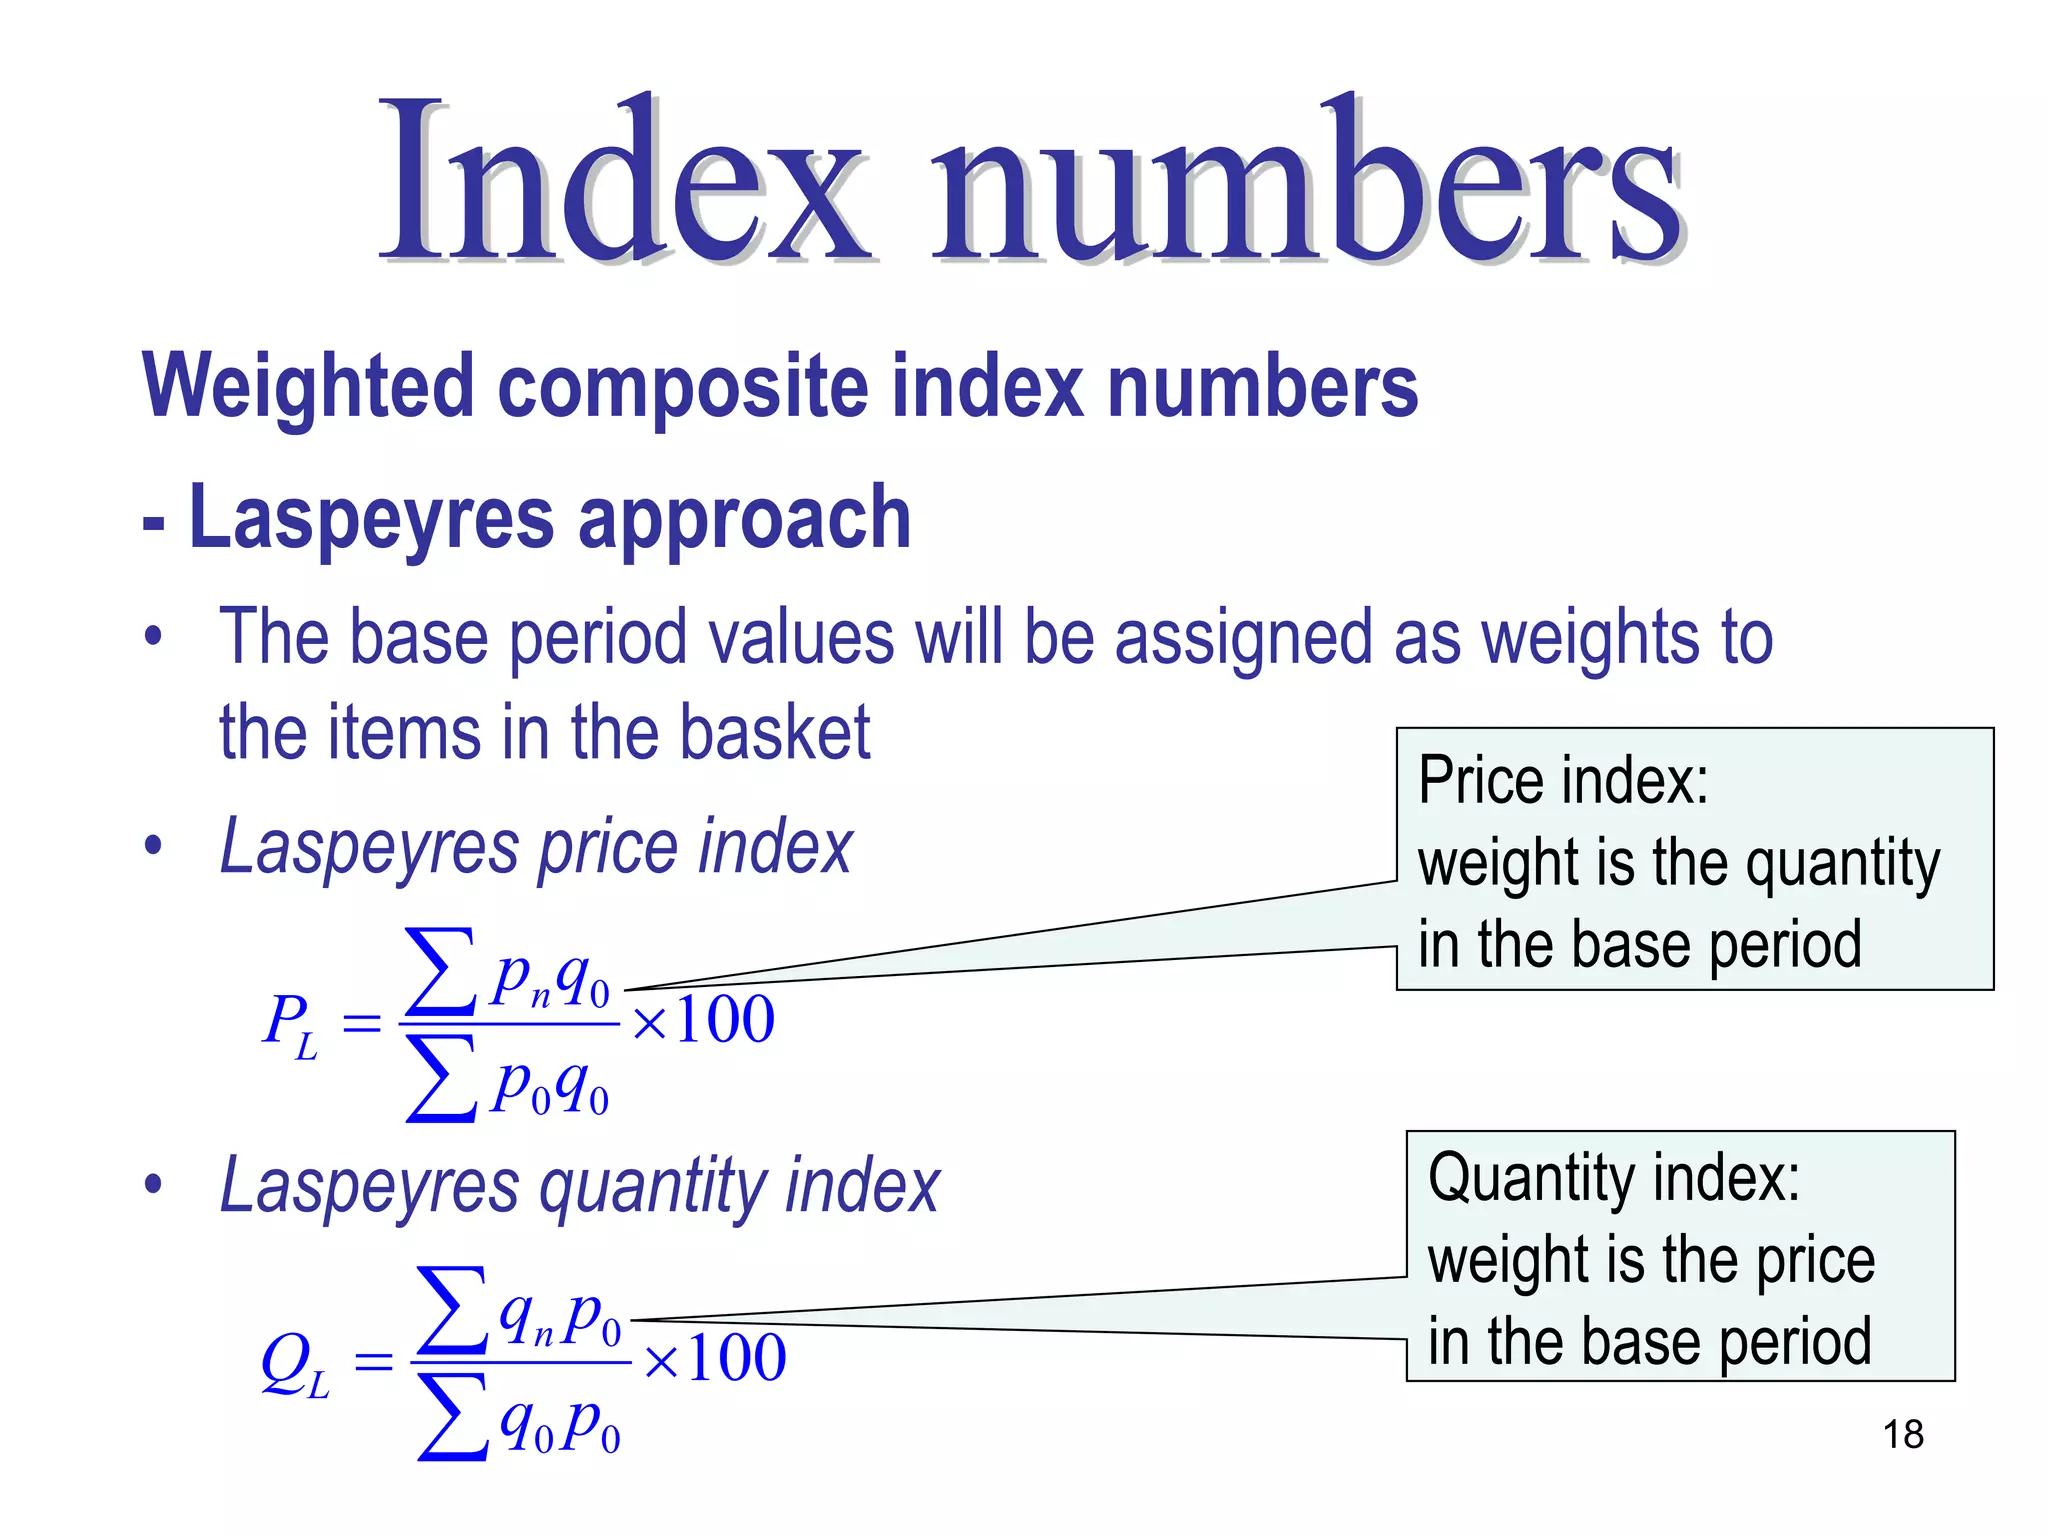
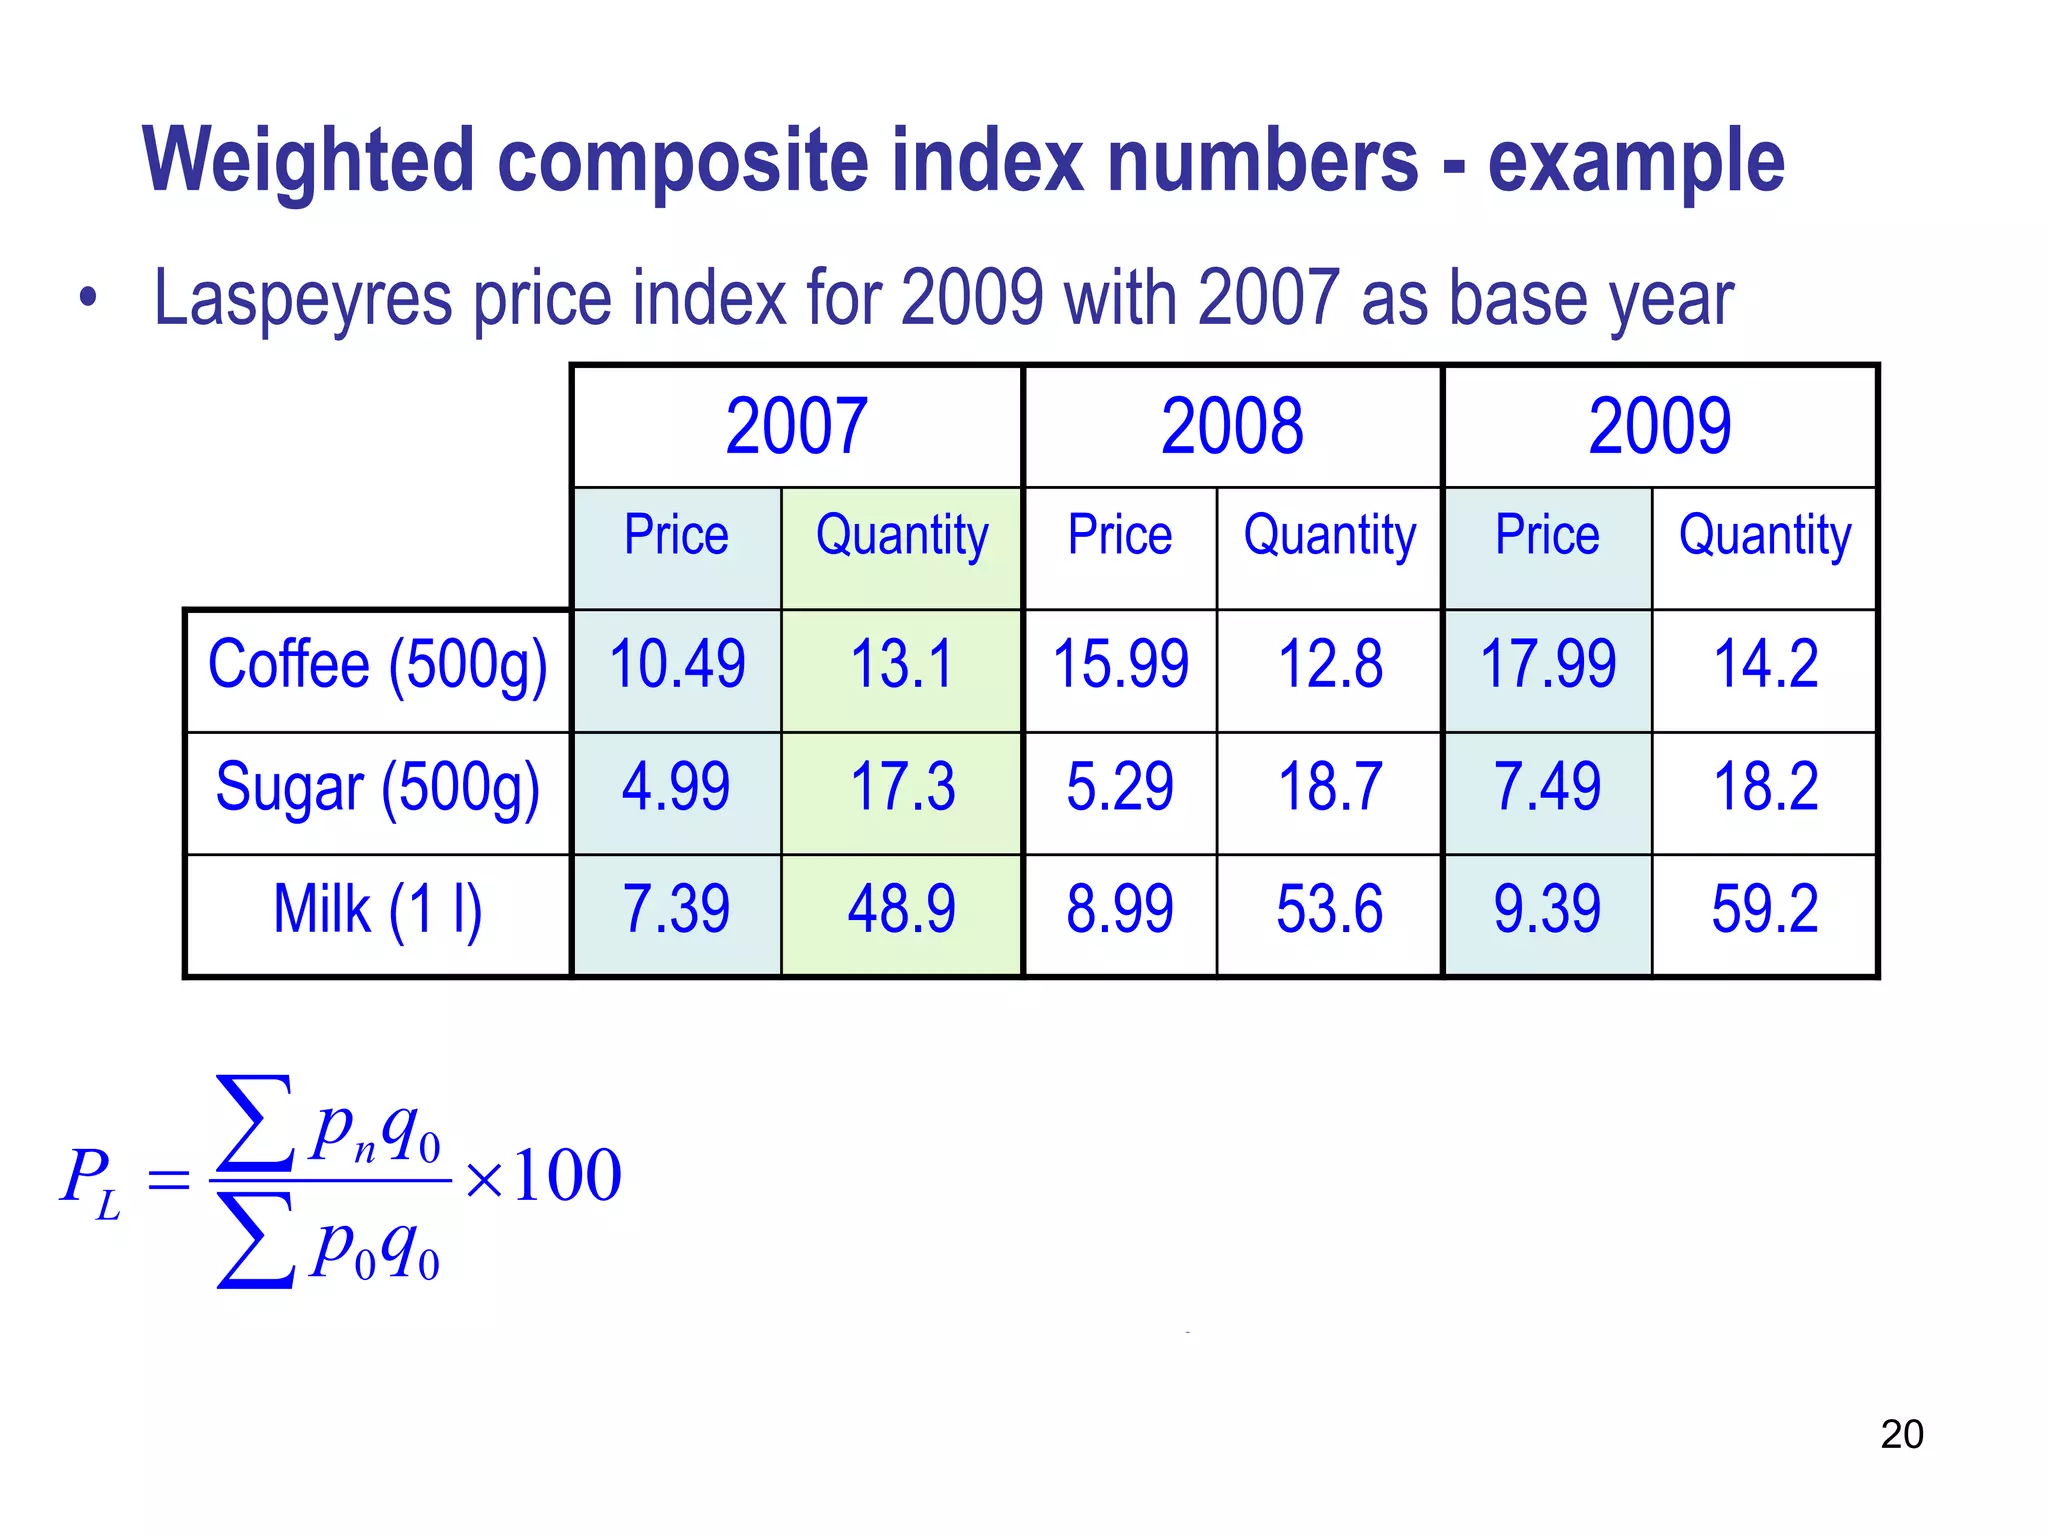
3. Laspeyres price index for 2008 with 2007 as base year
ΣPnQ0/ΣP0Q0 * 100 = (8.4