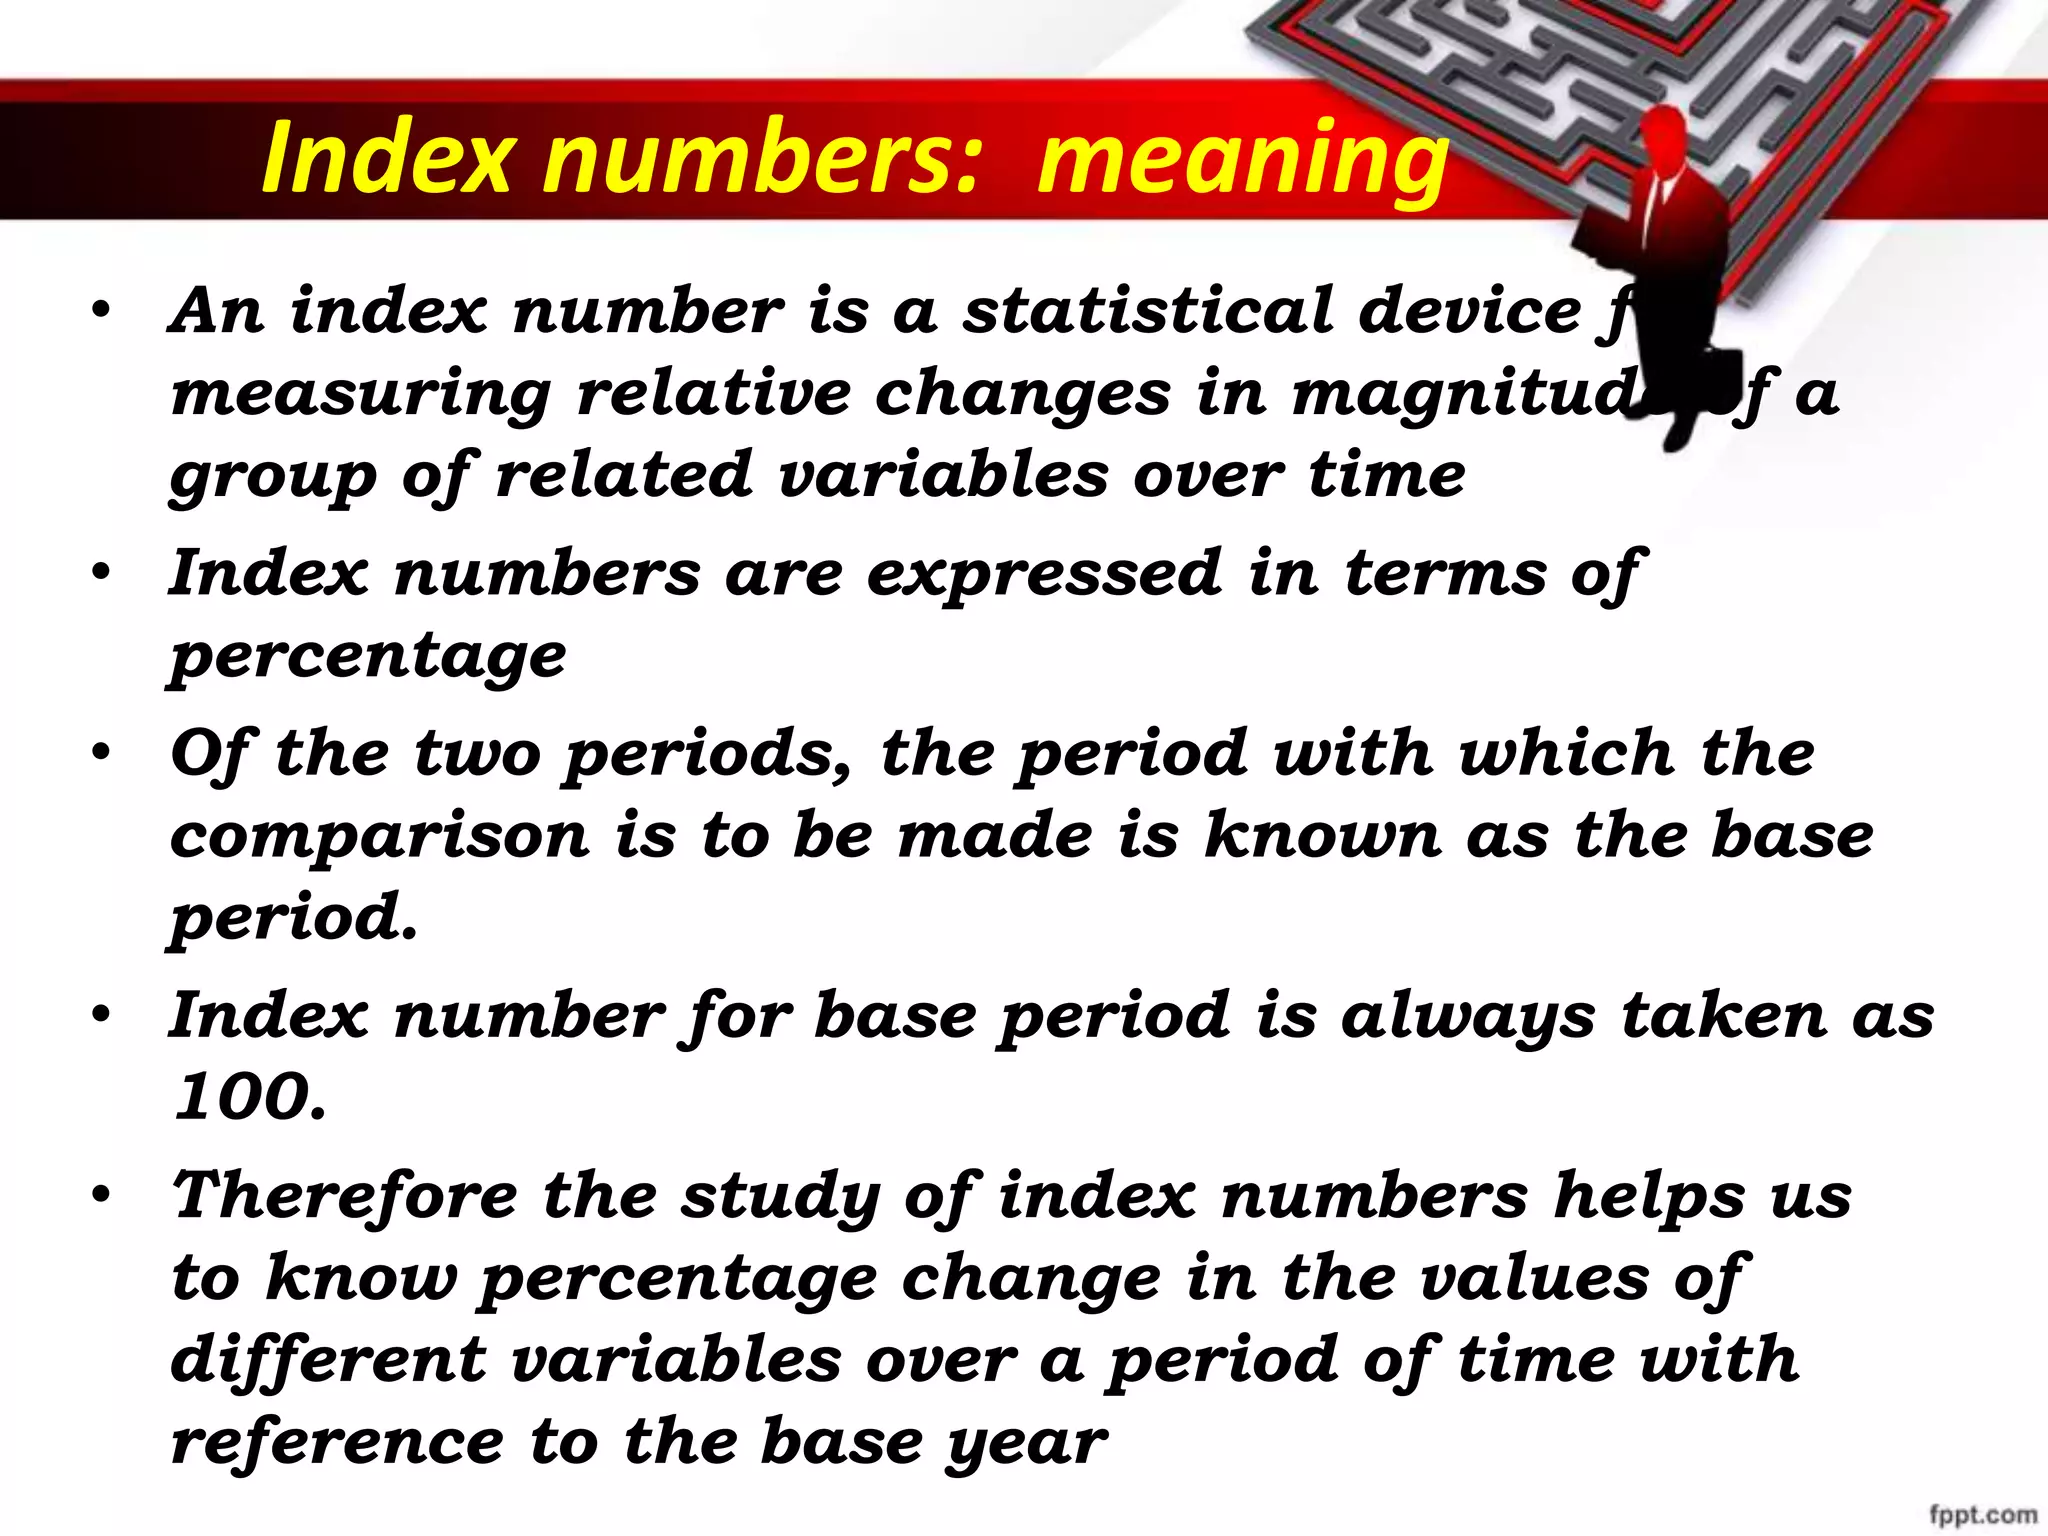
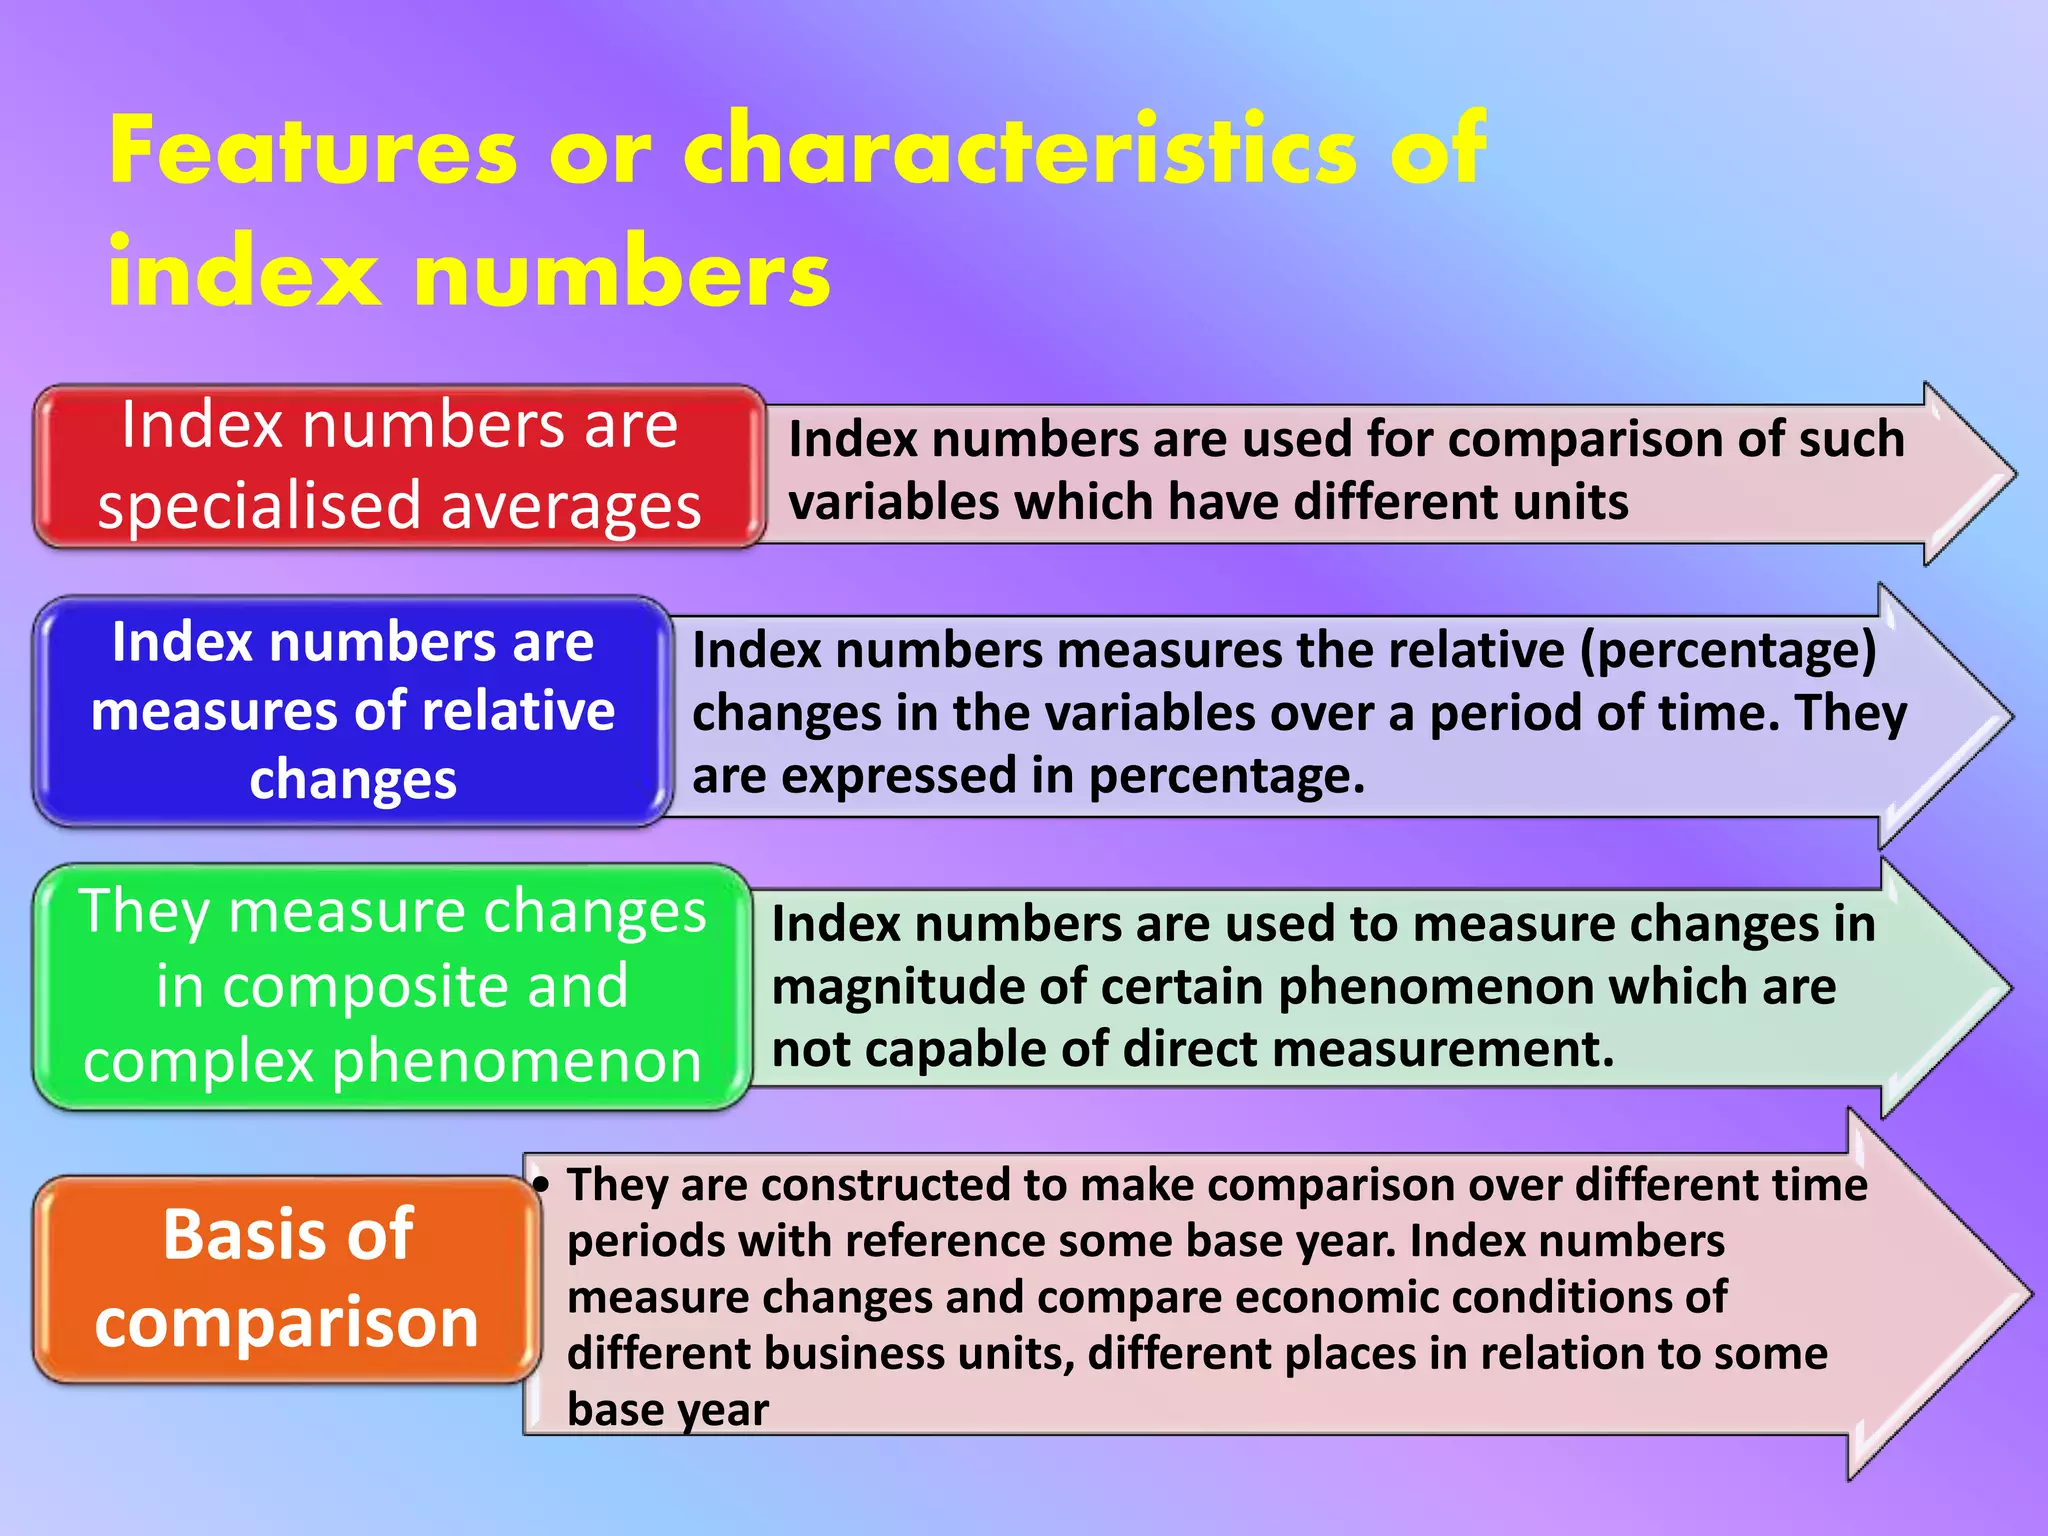
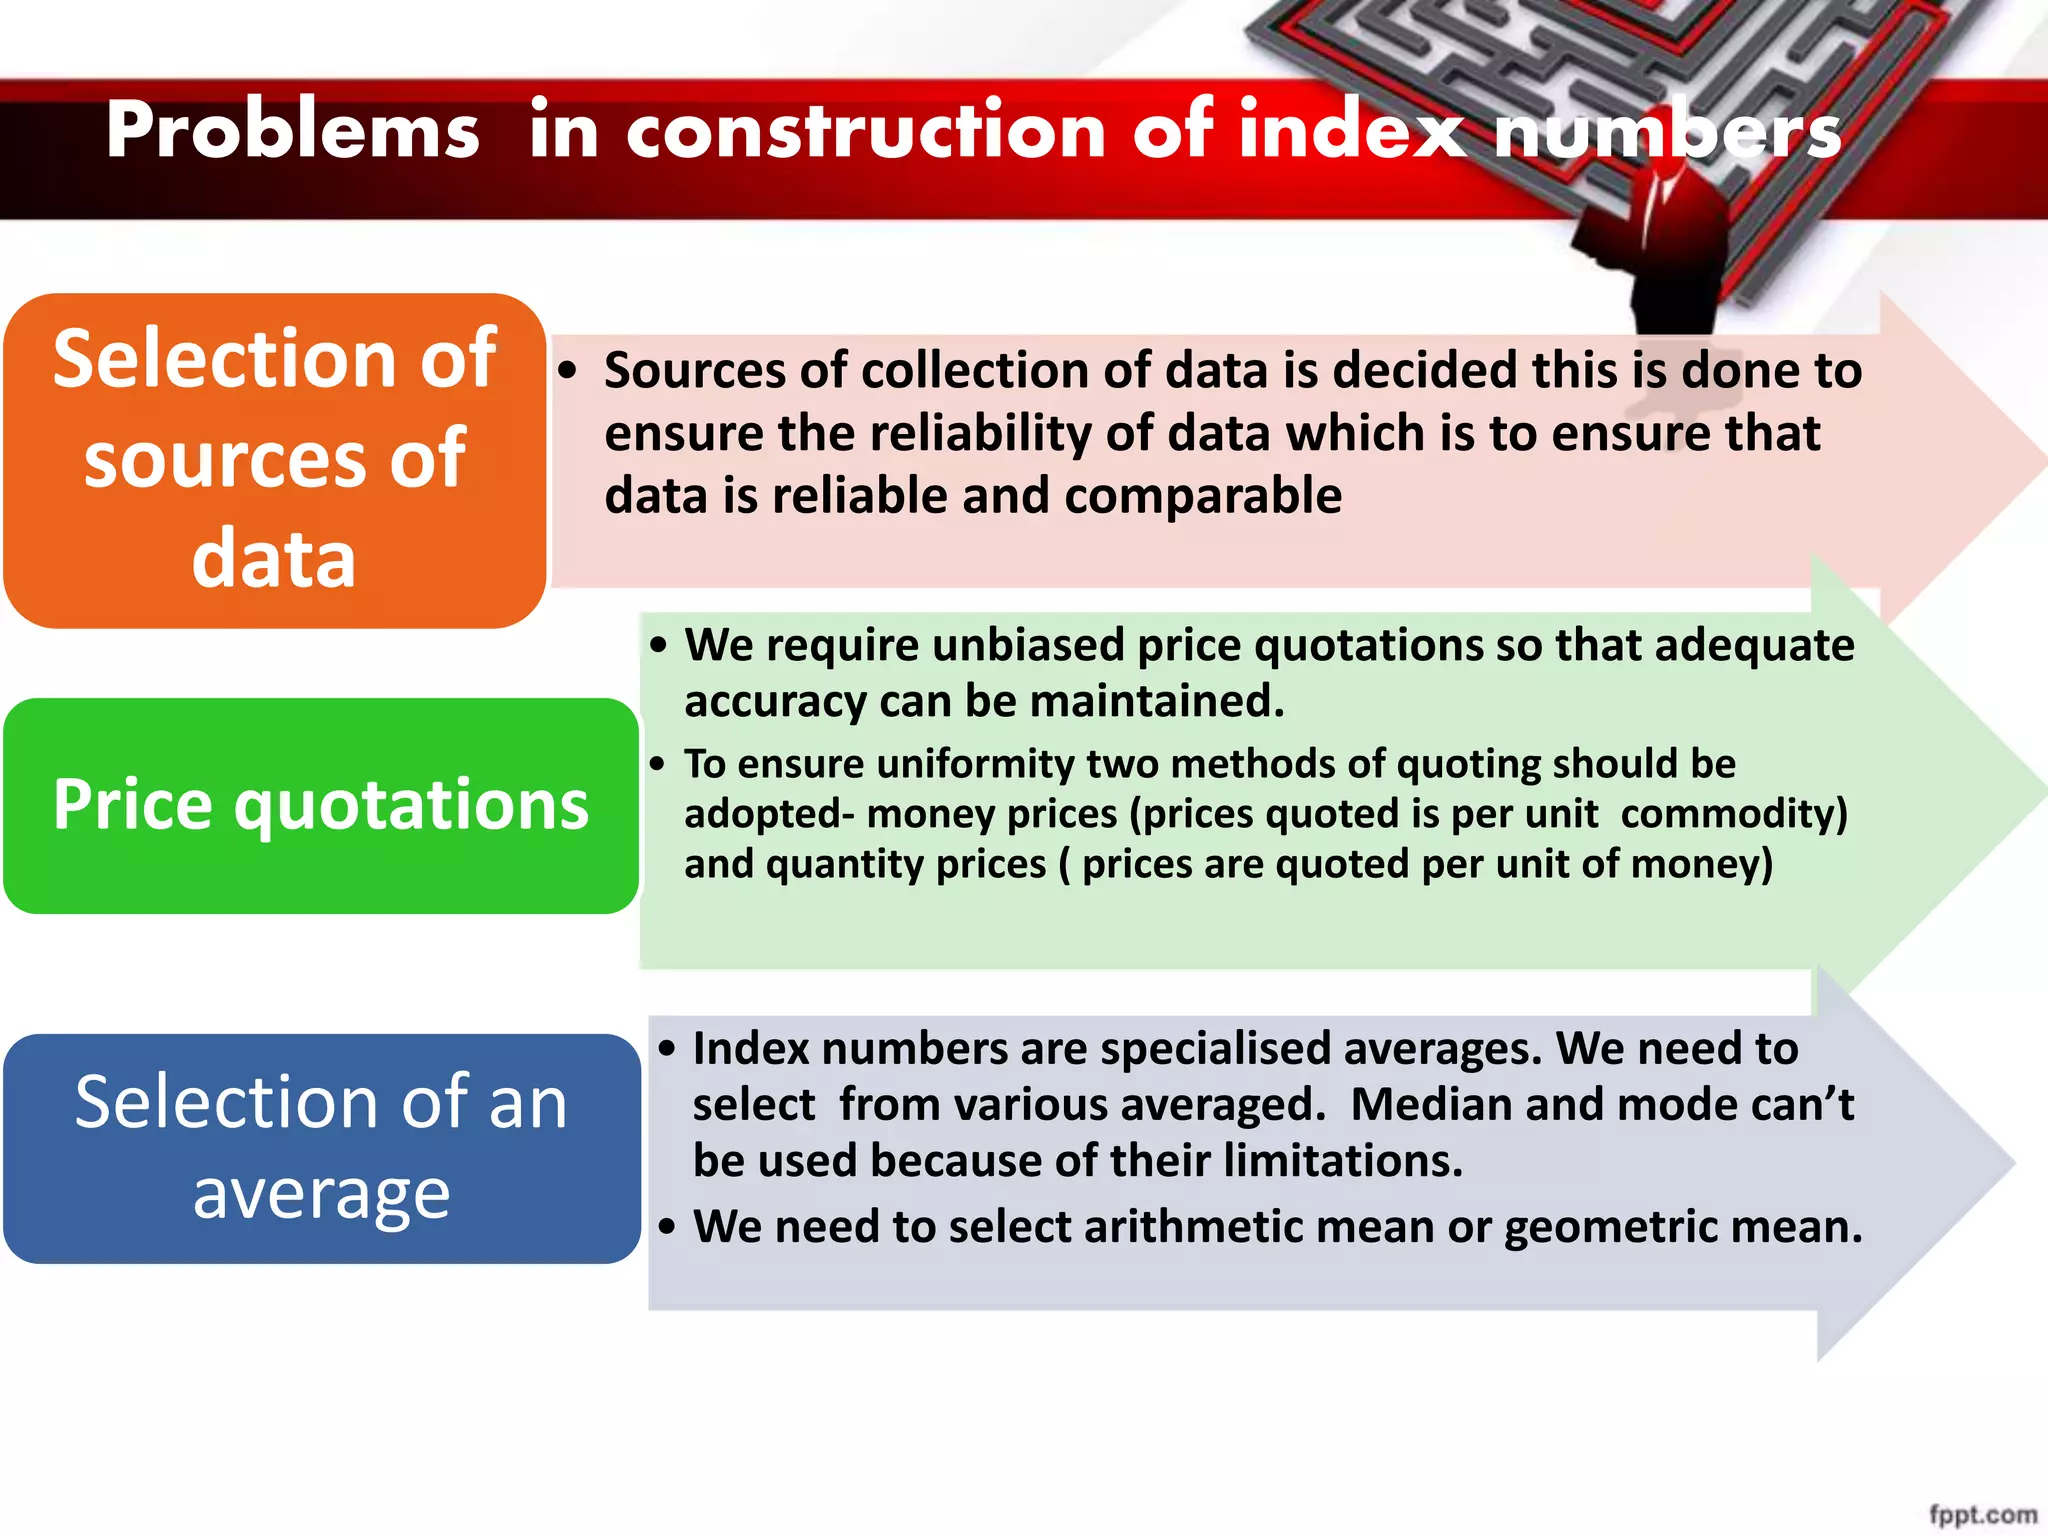
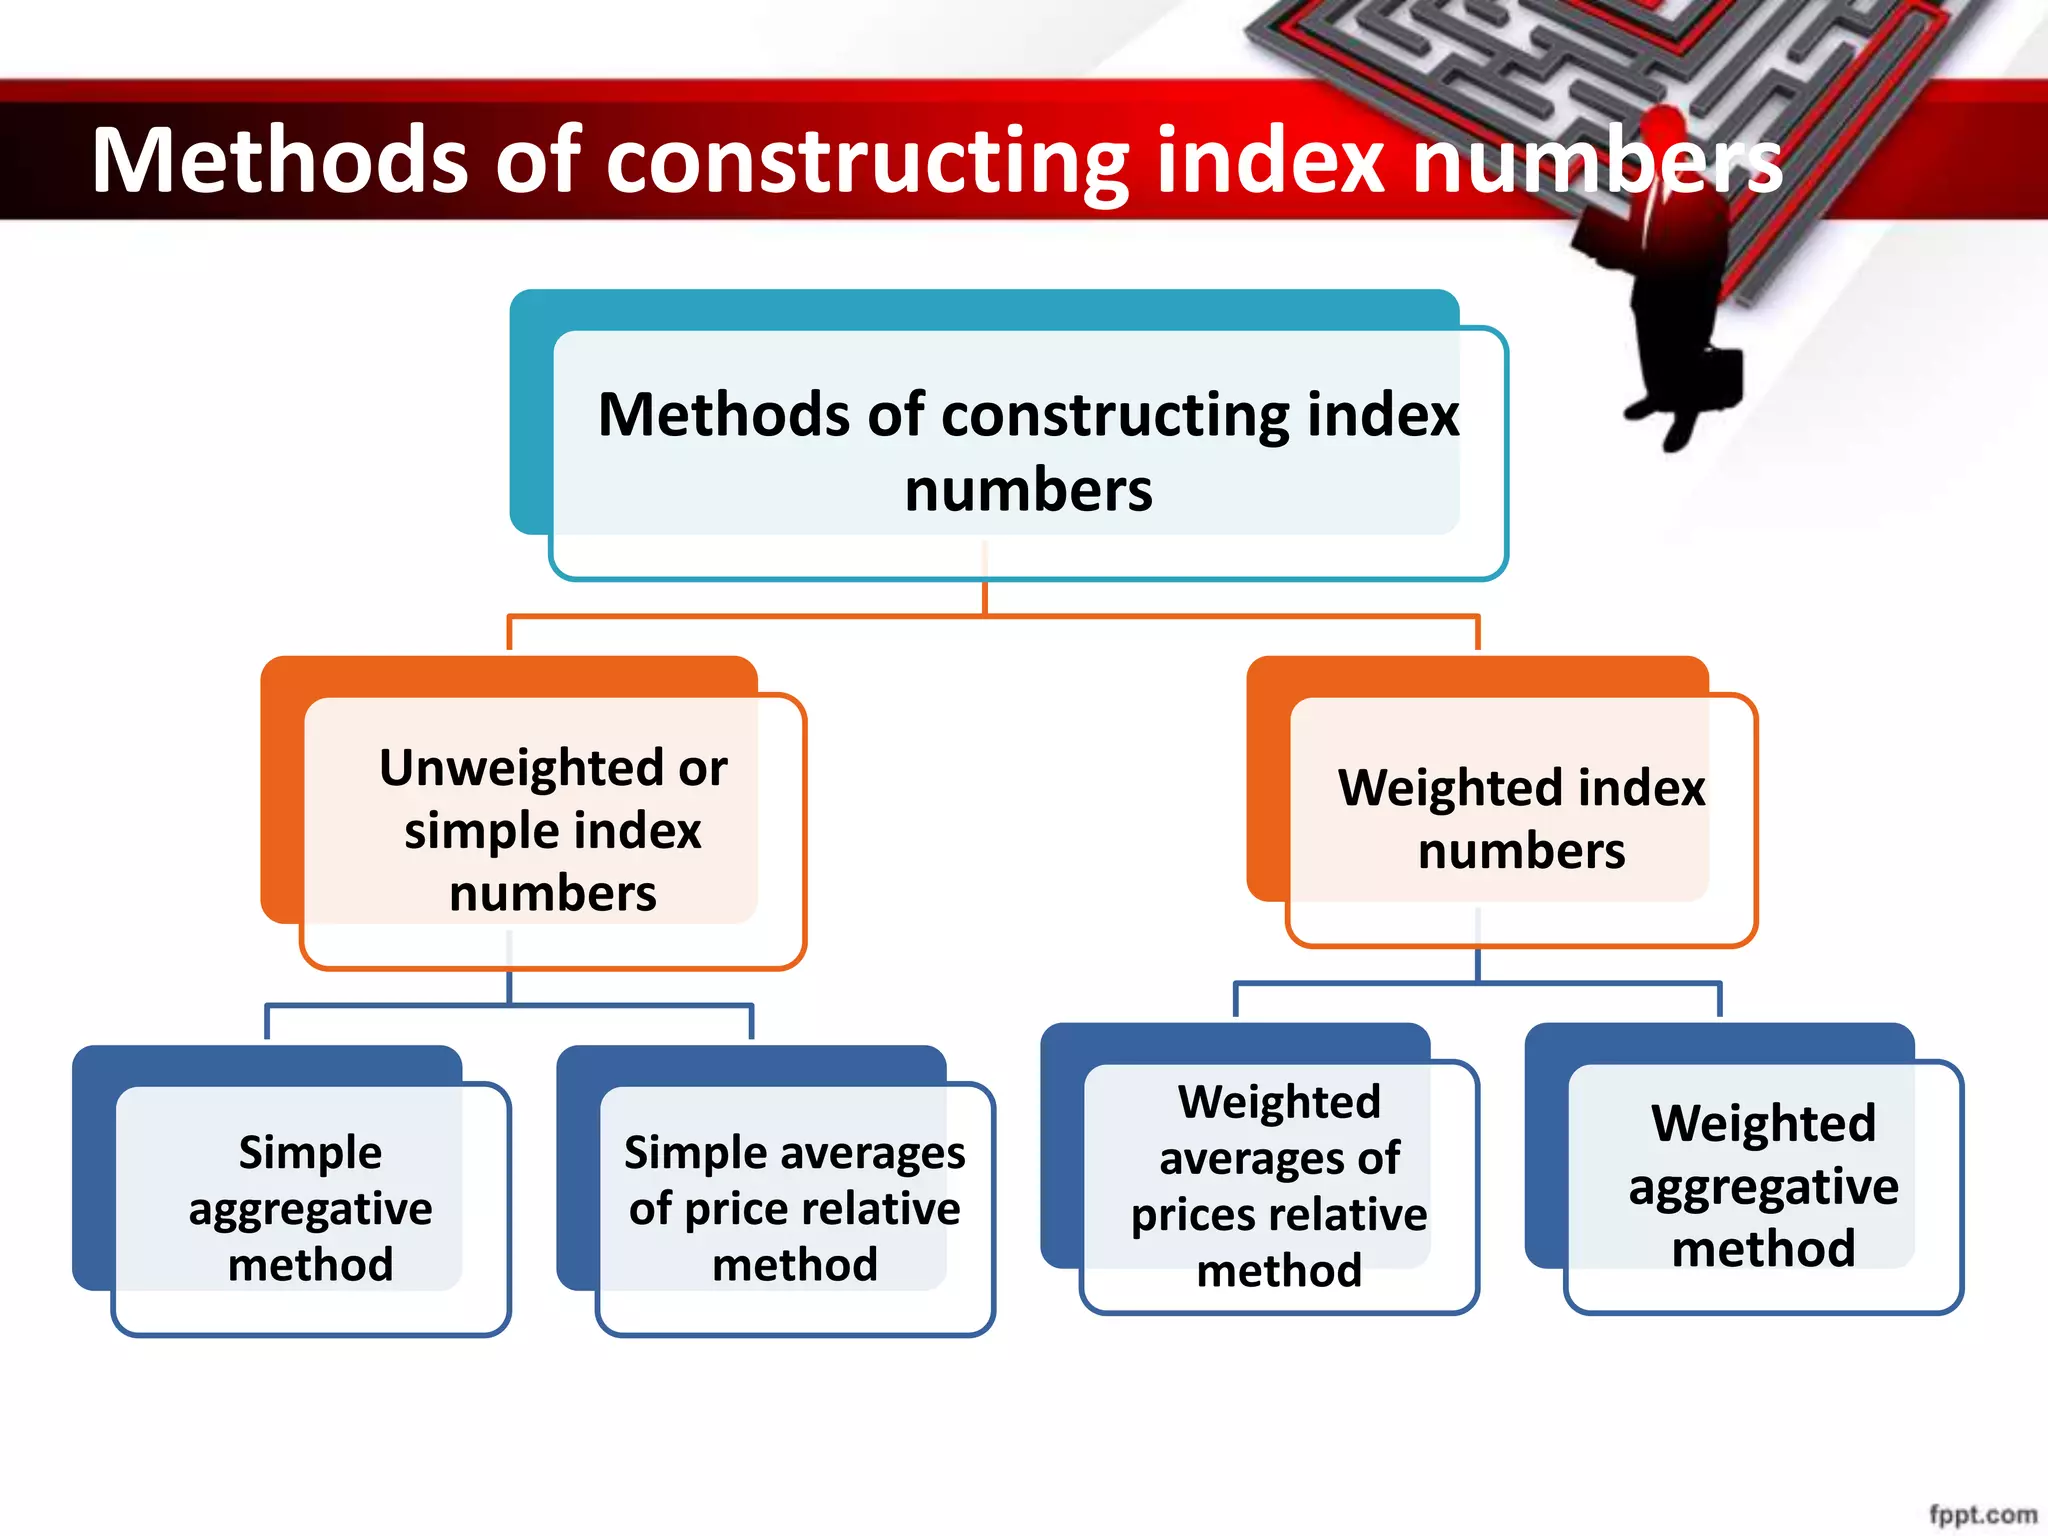
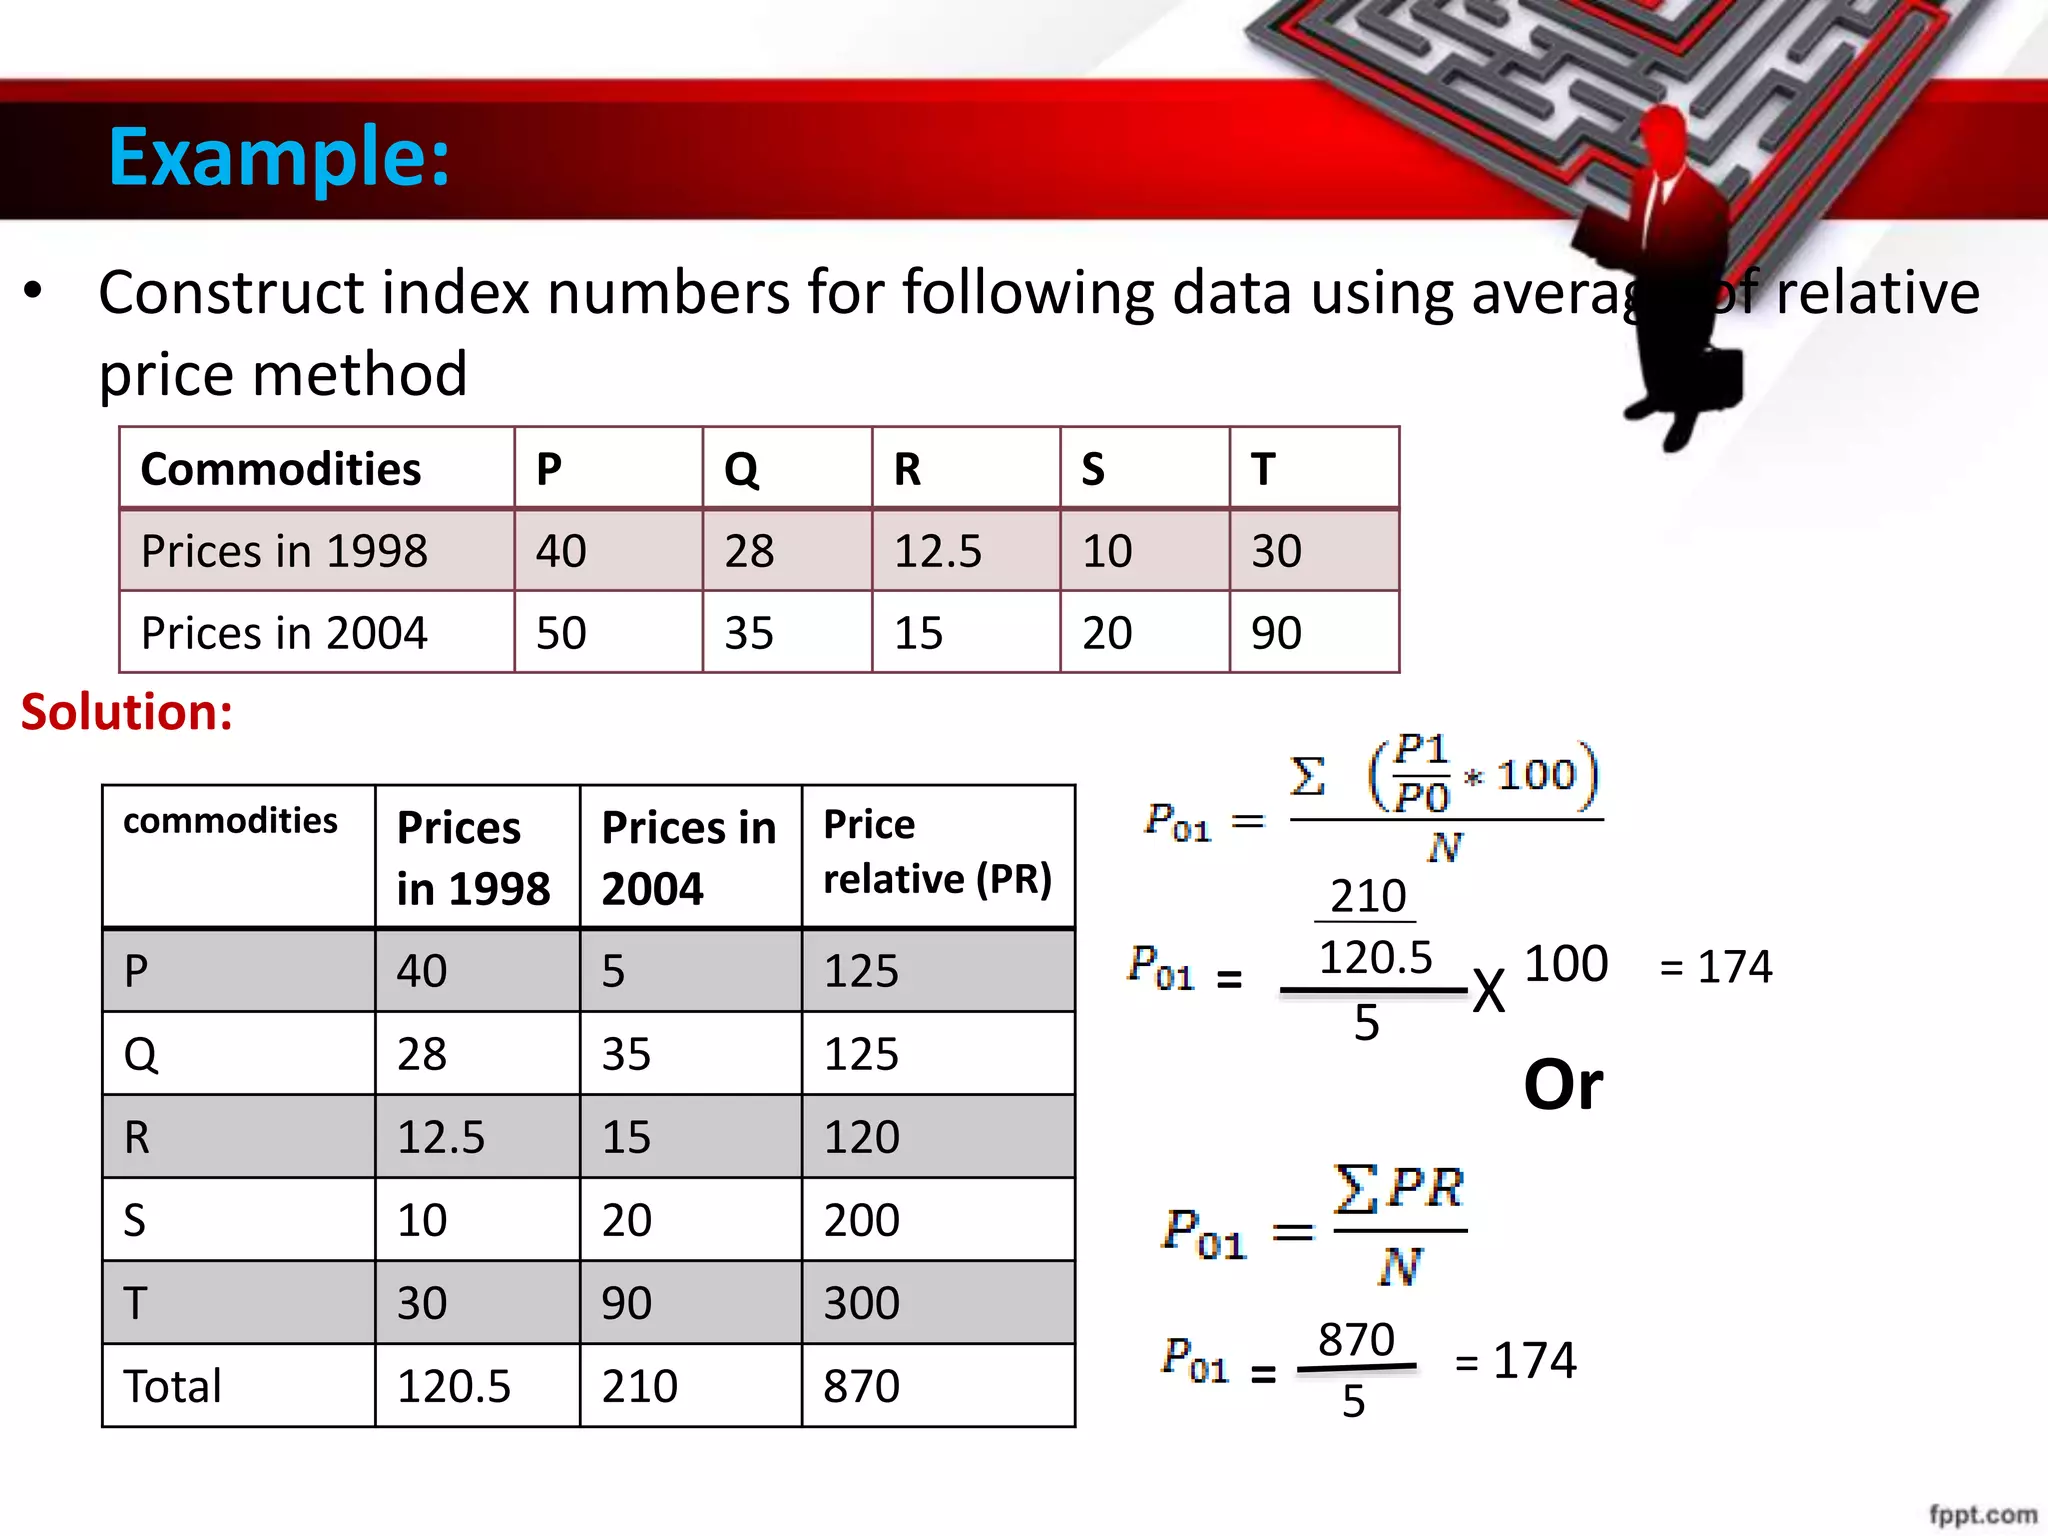
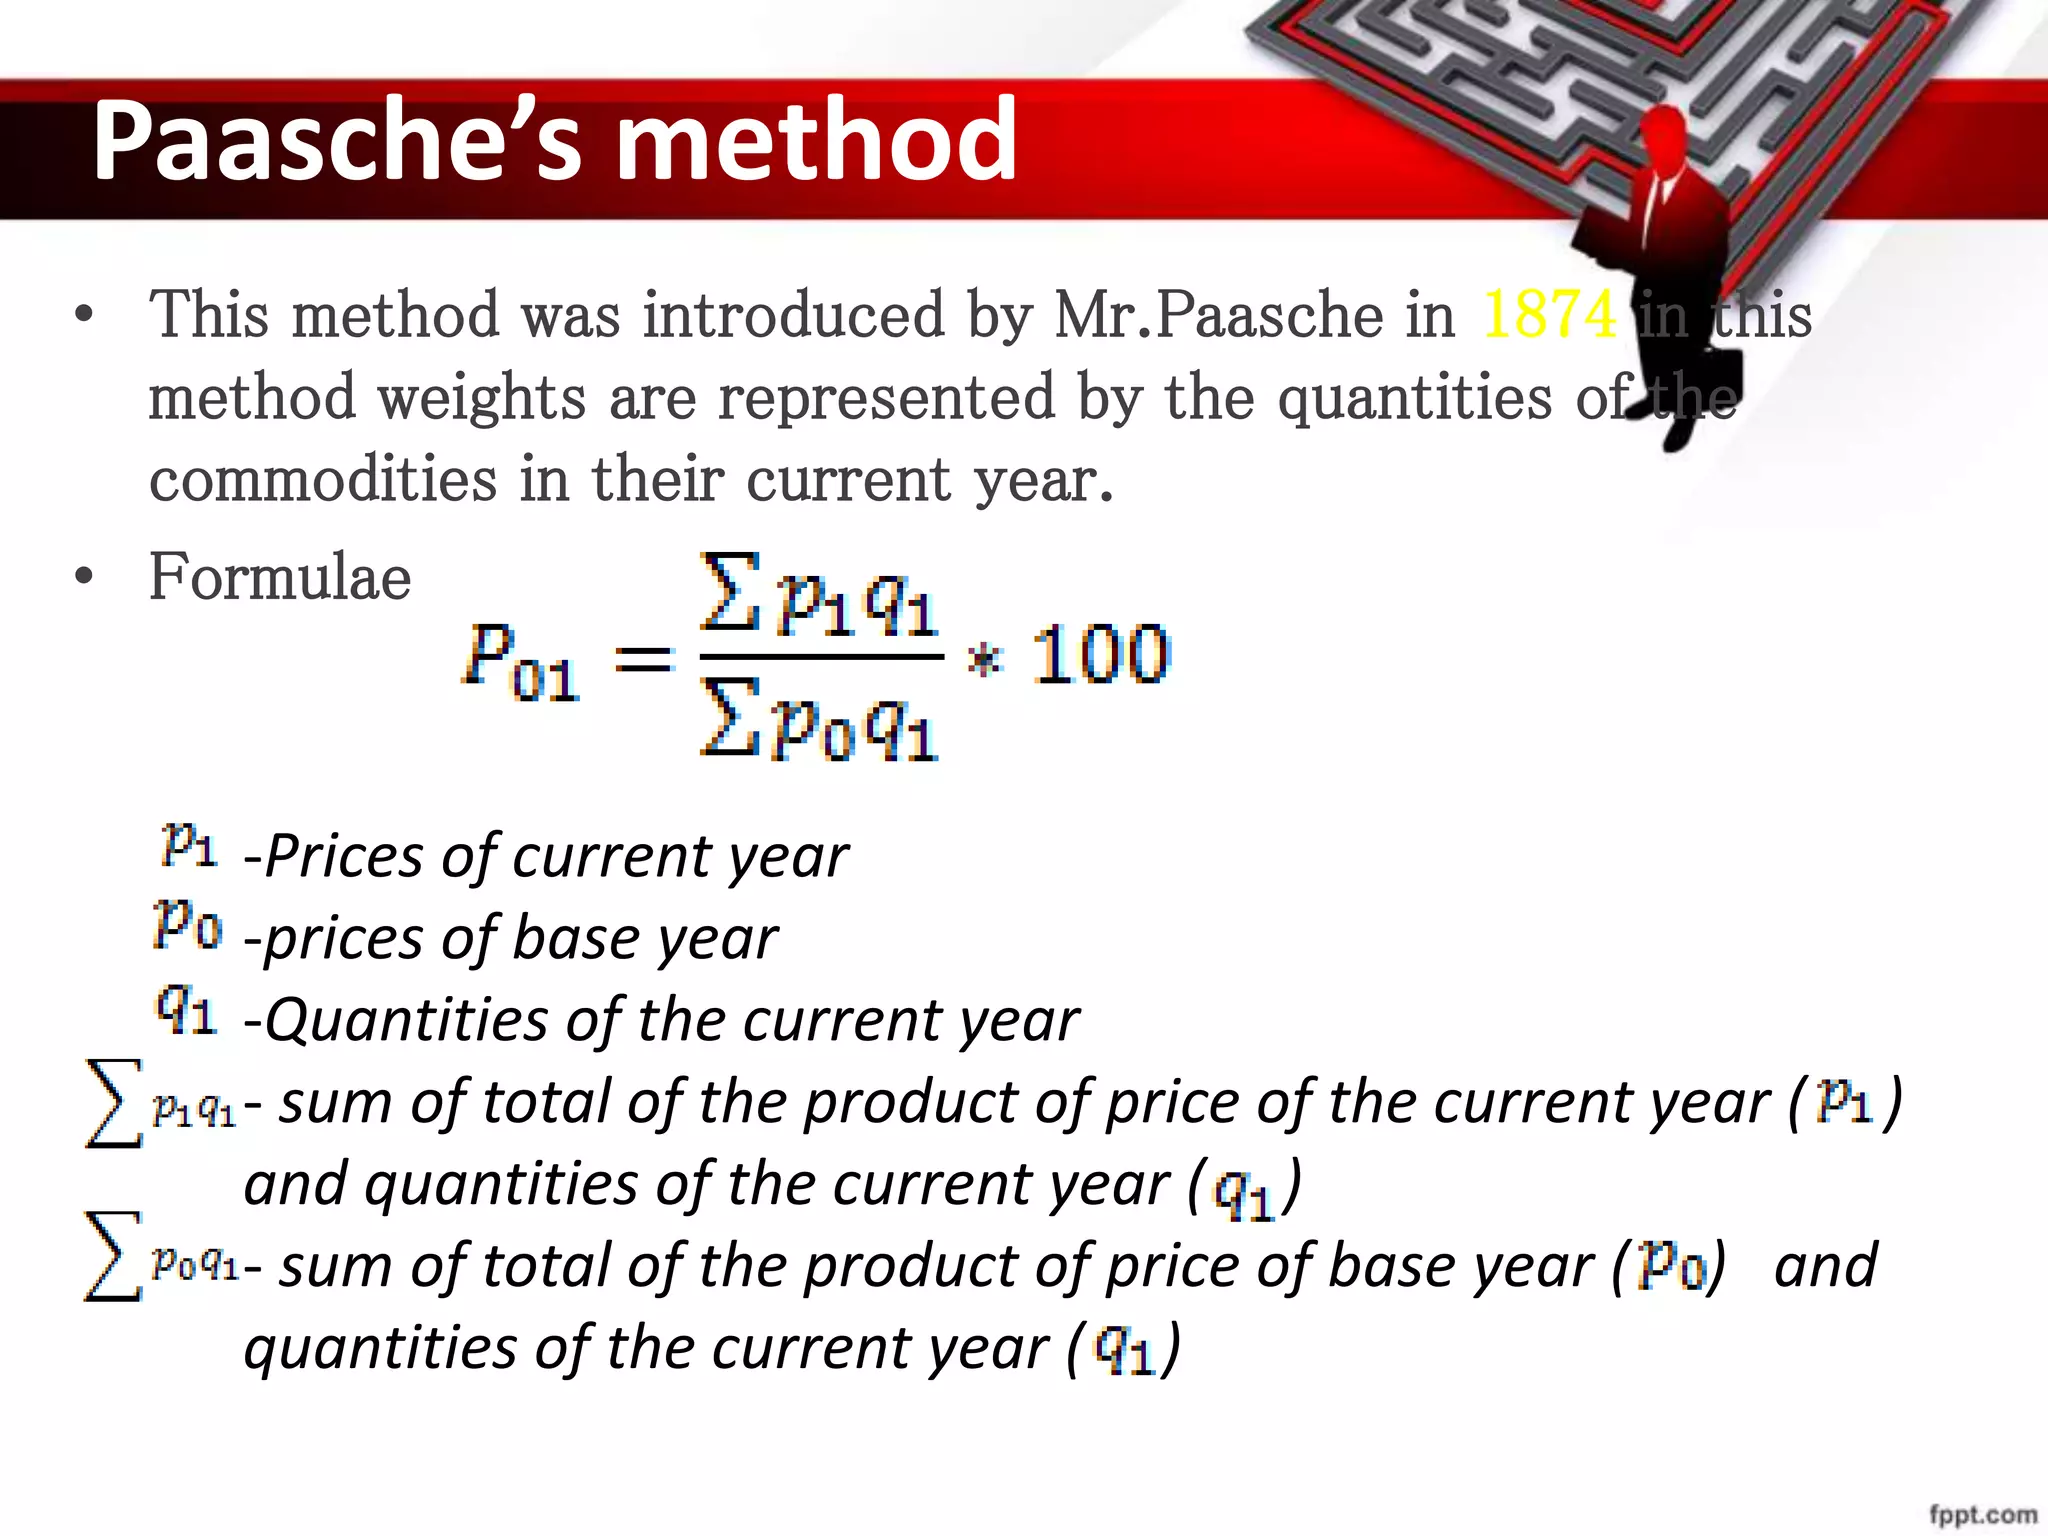
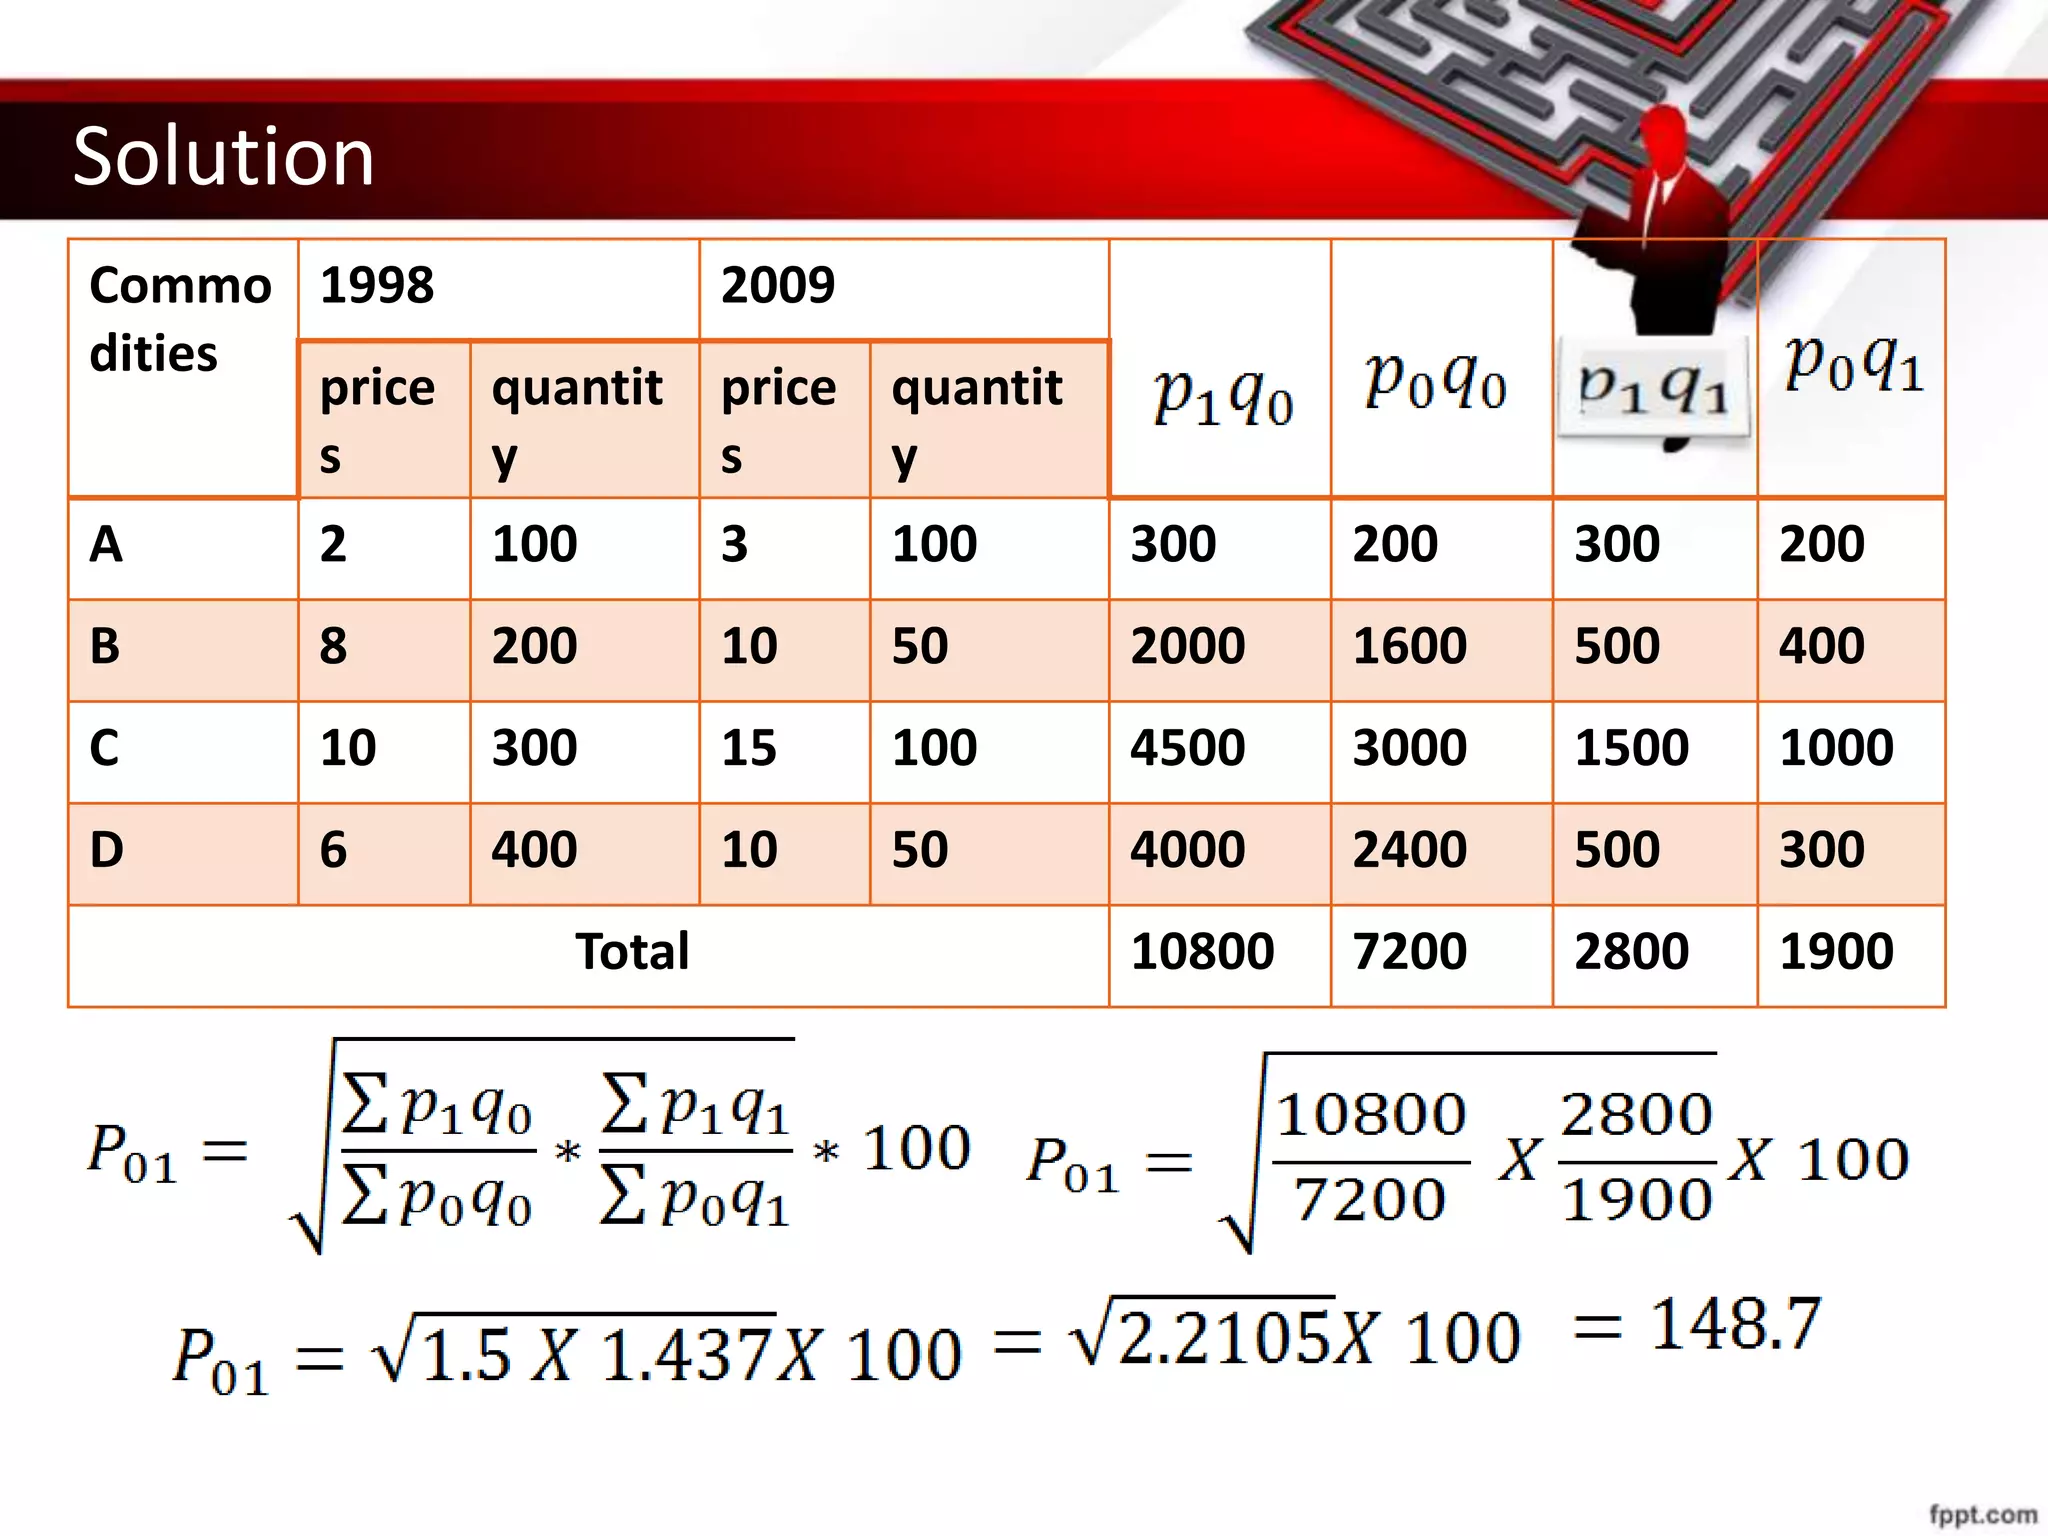
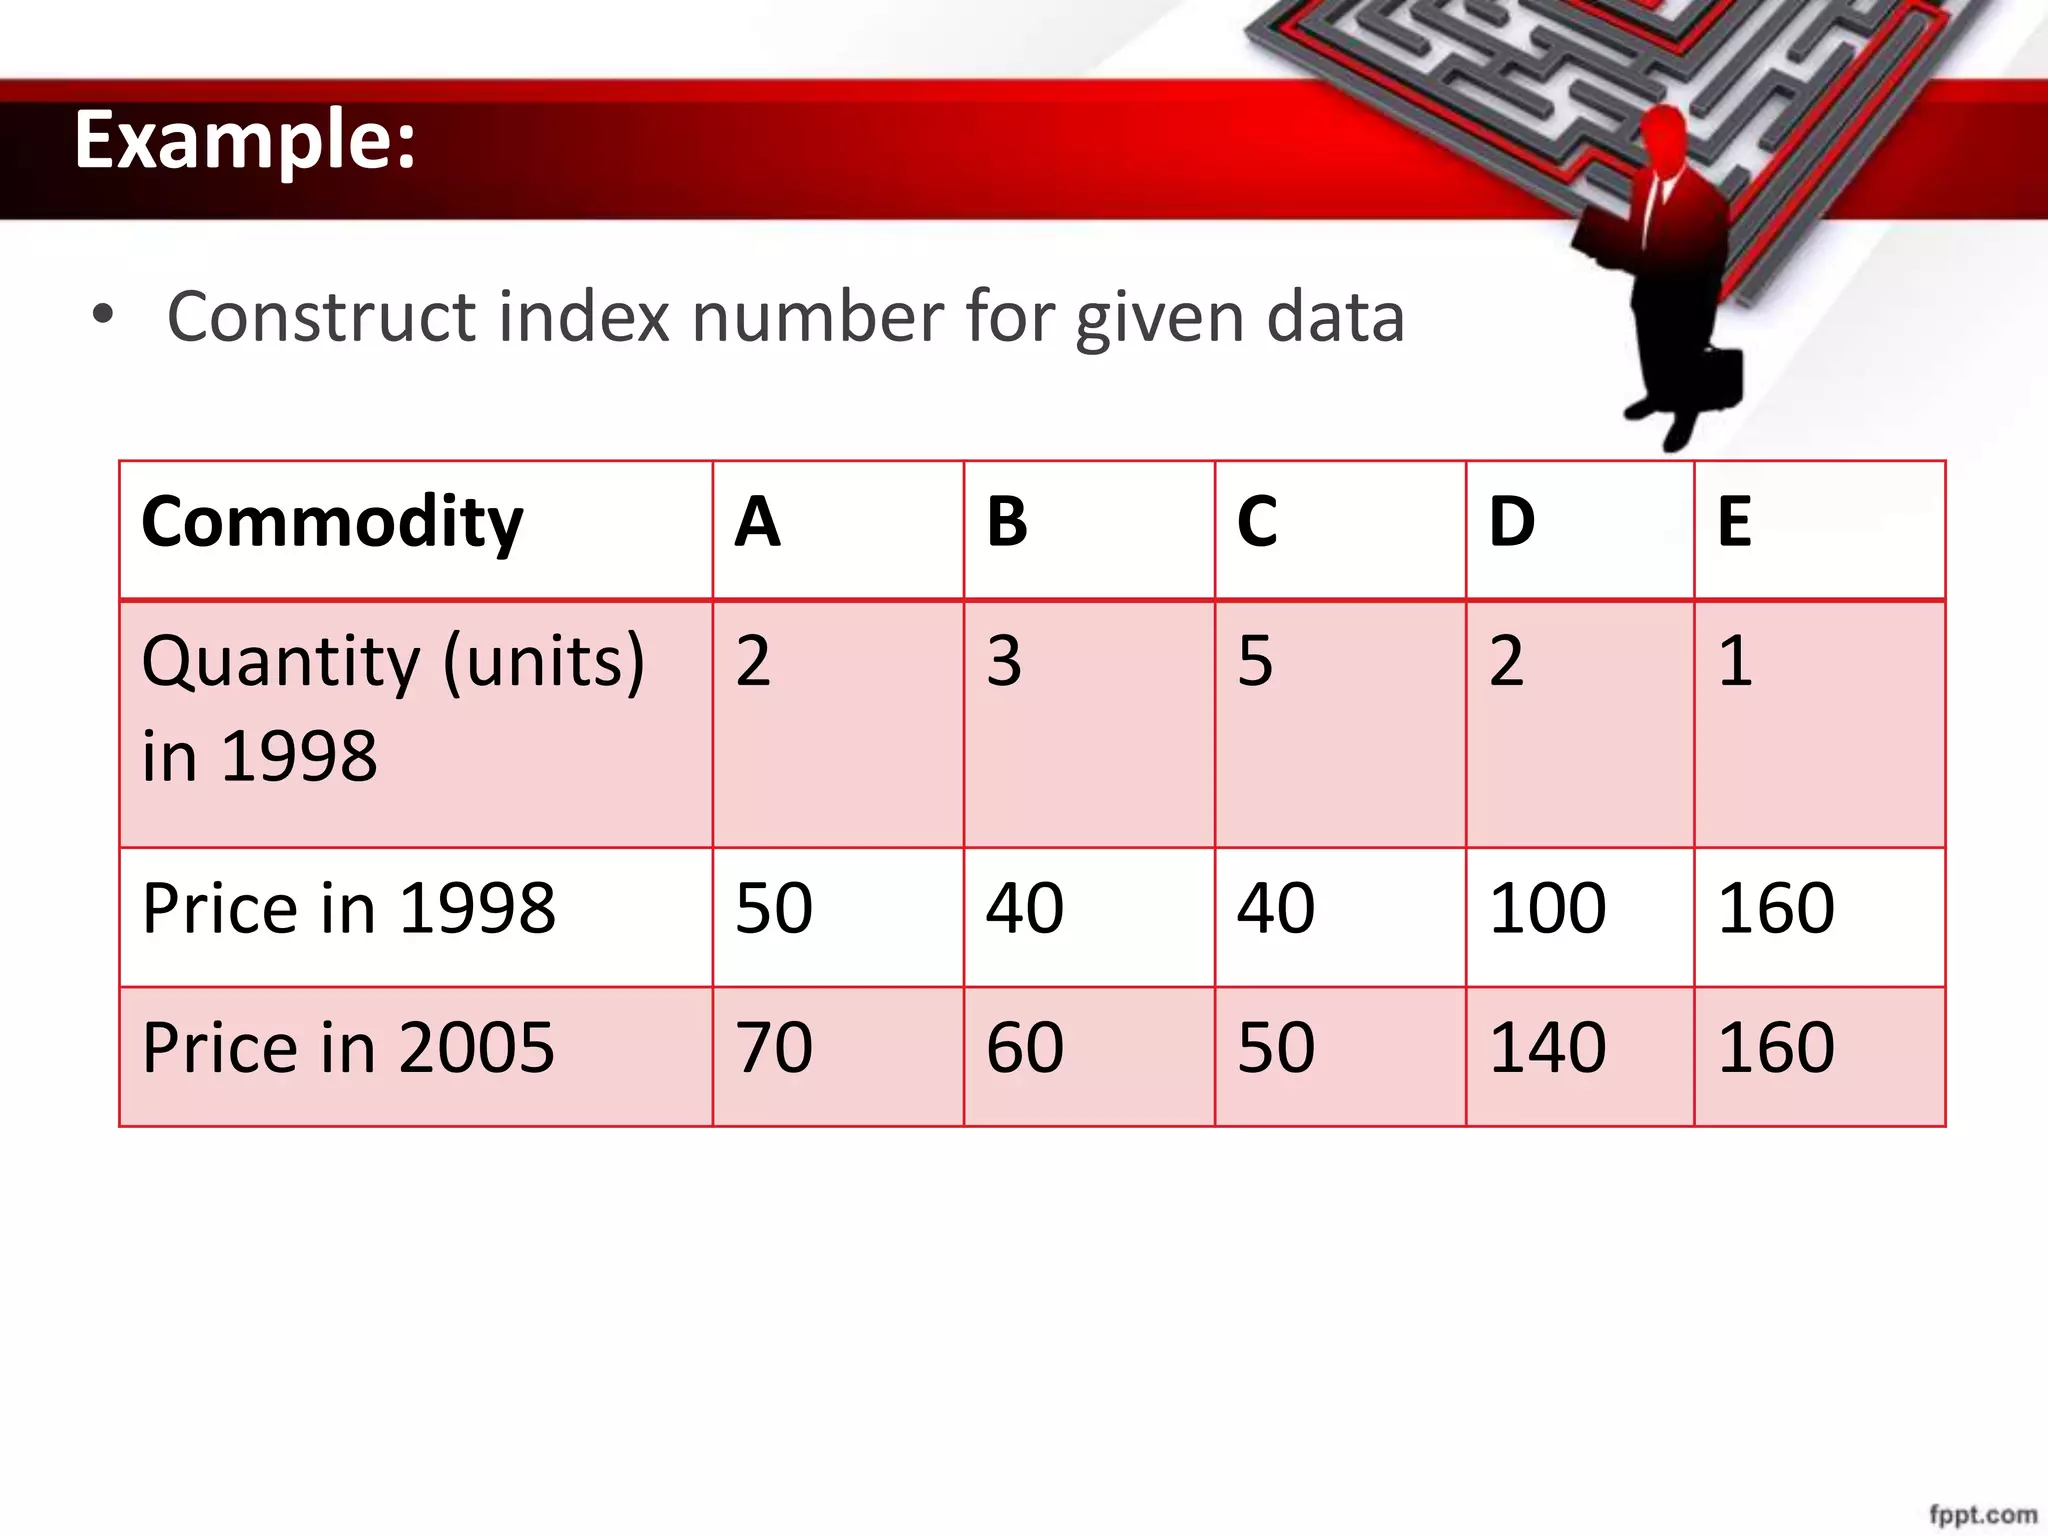
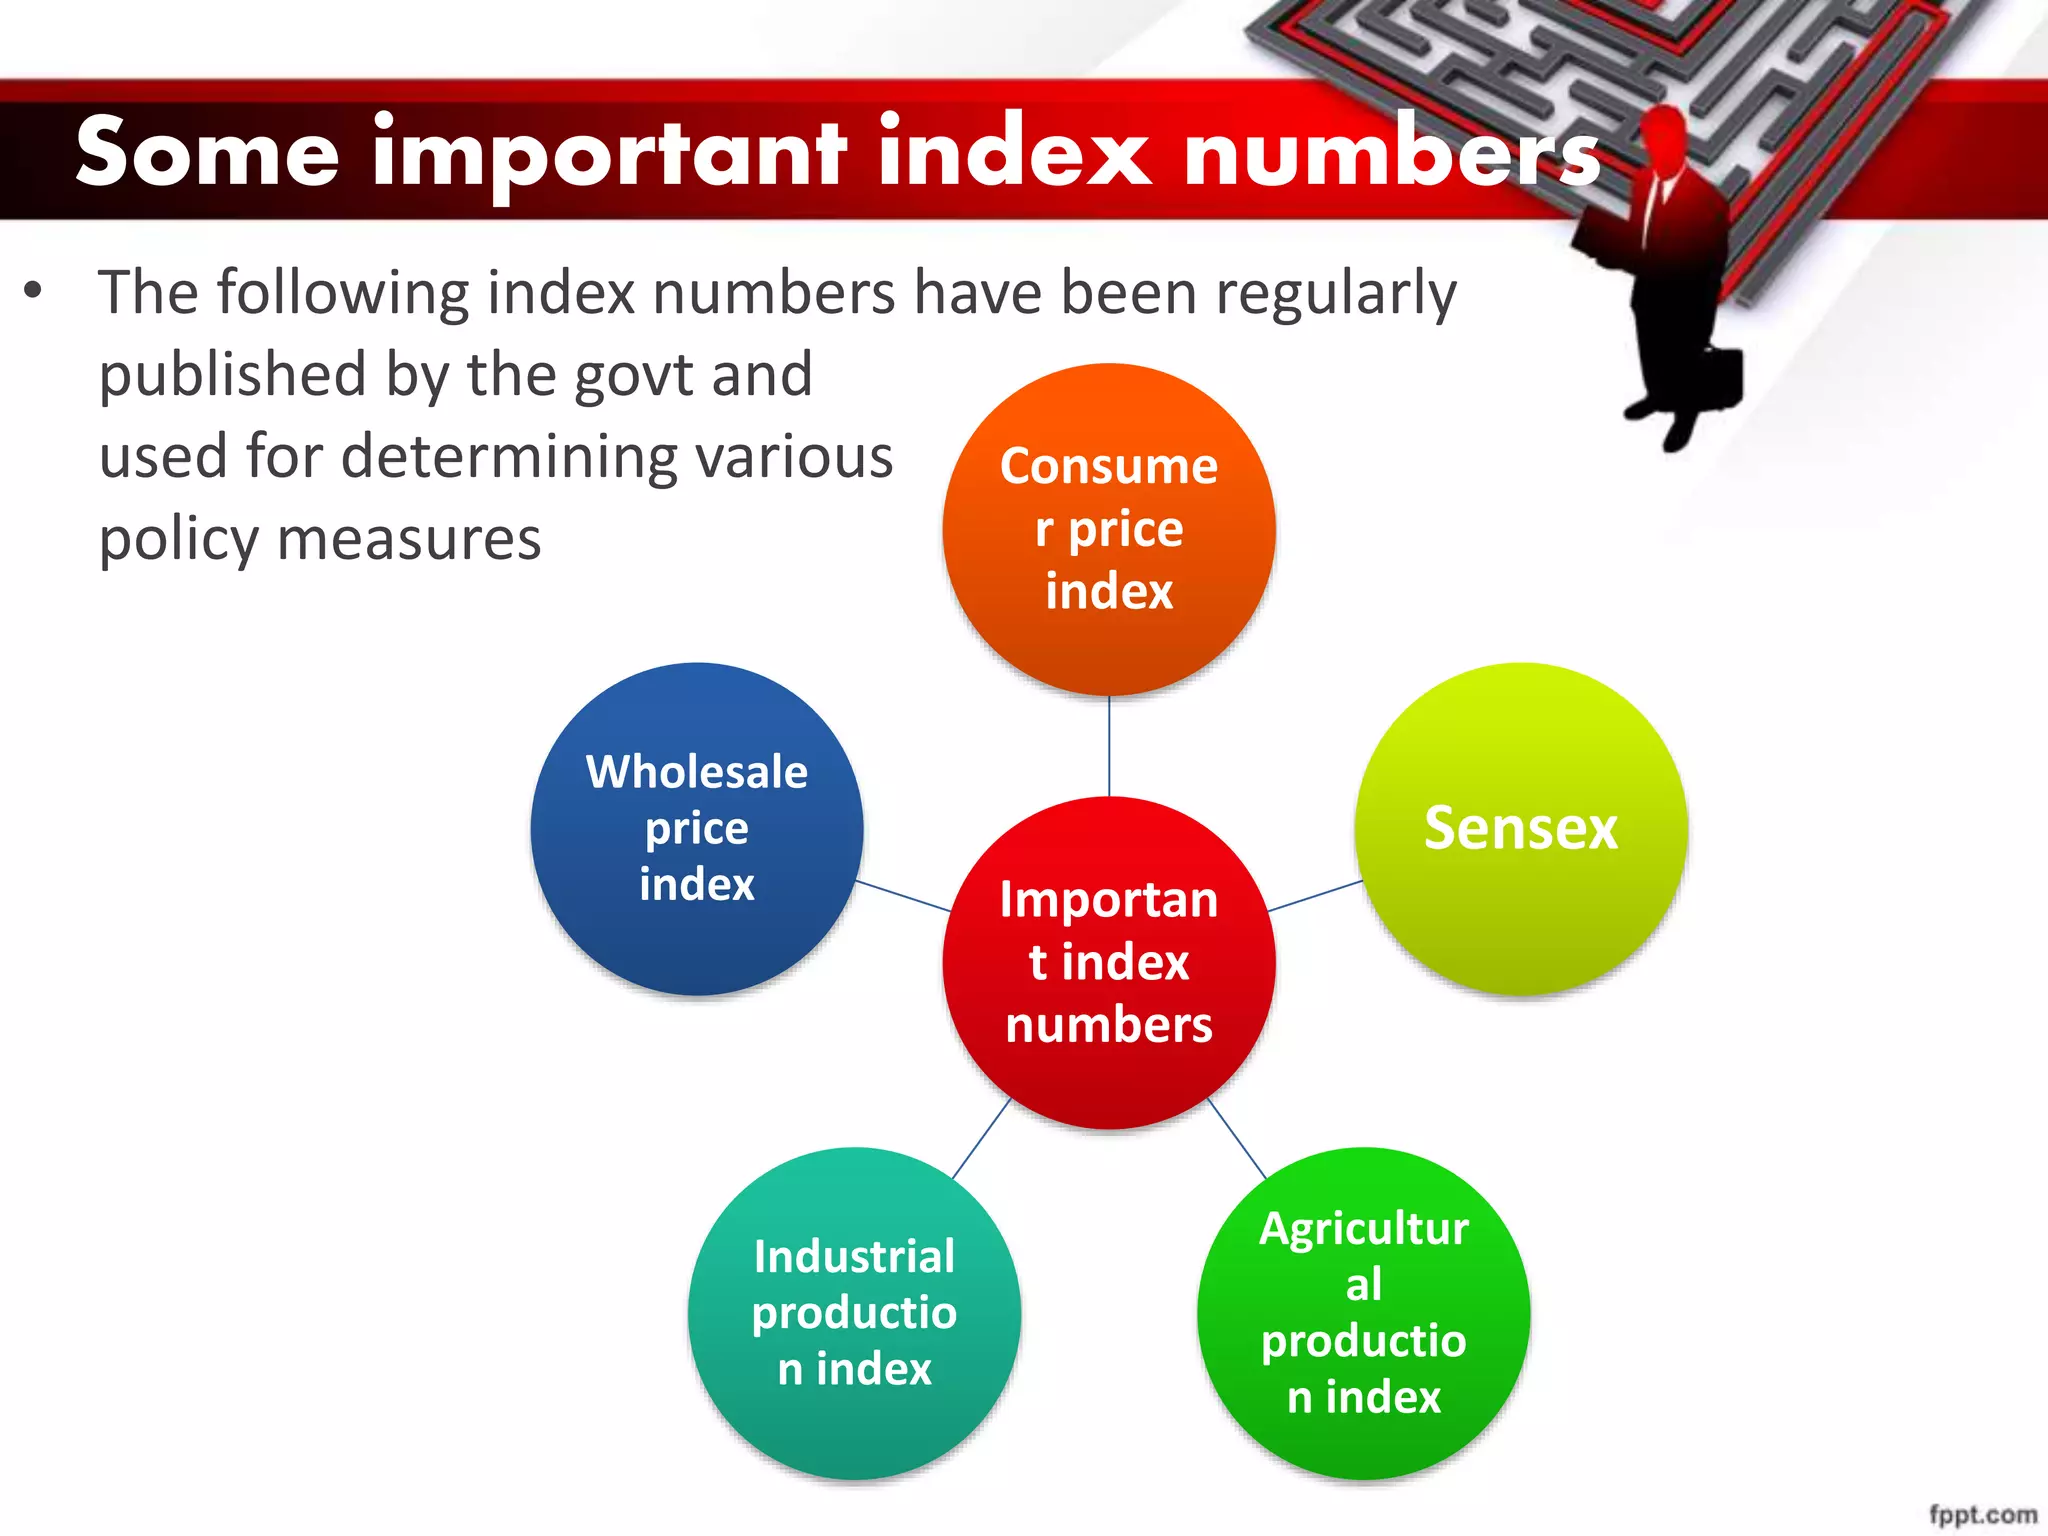
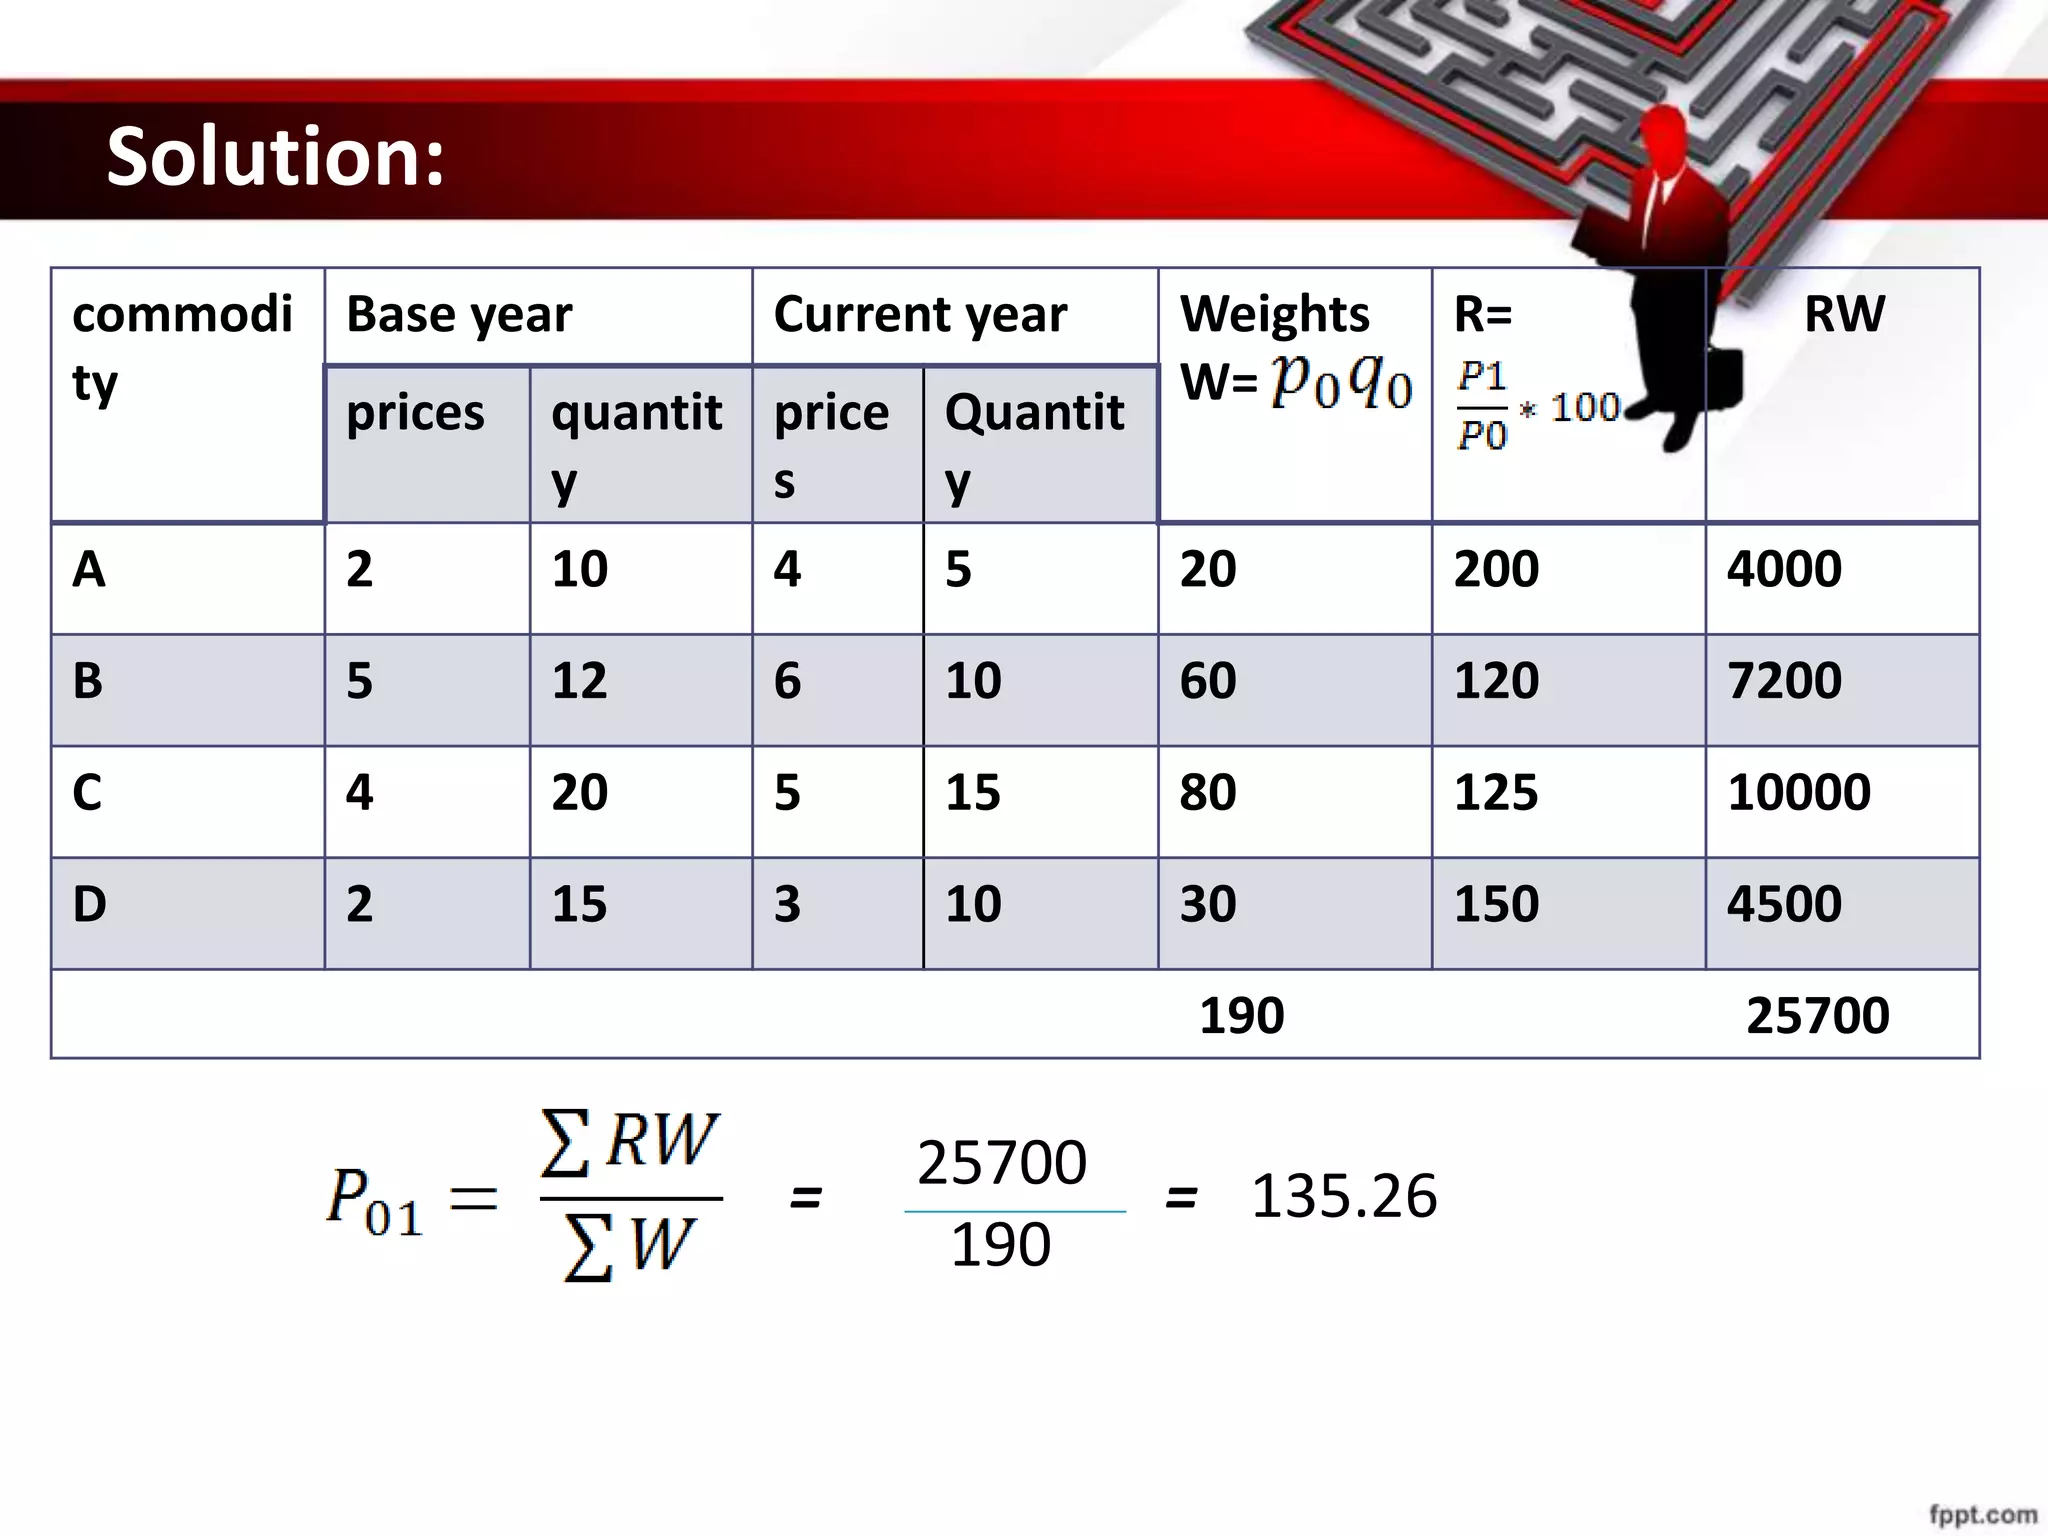
Index Numbers
By Poona jangid
11th ‘B’
Understand the
meaning of the term
index numbers
Apprecia
te its
limitatio
n
Calculate an
index number
Become
familiar
with the
use of
some
widely
used index
numbers
Content:
• Index numbers- meaning
• Features of index numbers
• Advantages of index numbers
• Problems in construction of index numbers
• Limitation of index number
• Methods of construction of index numbers
• Some important index numbers
• Uses of different types of index numbers
• Inflation and index numbers
• Conclusion
(List of formula’s used in construction of index
numbers)
Index numbers: meaning
• An index number is a statistical device for
measuring relative changes in magnitude of a
group of related variables over time
• Index numbers are expressed in terms of
percentage
• Of the two periods, the period with which the
comparison is to be made is known as the base
period.
• Index number for base period is always taken as
100.
• Therefore the study of index numbers helps us
to know percentage change in the values of
different variables over a period of time with
reference to the base year
Features or characteristics of
index numbers
• Index numbers are used for comparison of such
variables which have different units
Index numbers are
specialised averages
• Index numbers measures the relative (percentage)
changes in the variables over a period of time. They
are expressed in percentage.
Index numbers are
measures of relative
changes
• Index numbers are used to measure changes in
magnitude of certain phenomenon which are
not capable of direct measurement.
They measure changes
in composite and
complex phenomenon
• They are constructed to make comparison over different time
periods with reference some base year. Index numbers
measure changes and compare economic conditions of
different business units, different places in relation to some
base year
Basis of
comparison
Advantages of index numbers
Useful to
assess
exports
and
imports
Helpful in
formulatio
n of
policies
Helpful in
measuring
inflation
and
defiation
Helpful in
knowing the
changes in
standard of
living
Useful to
businessme
n. Important
device of
business
world
Useful to
government
in studying
changes in
trend.
Problems in construction of index numbers
• Sources of collection of data is decided this is done to
ensure the reliability of data which is to ensure that
data is reliable and comparable
Selection of
sources of
data
• We require unbiased price quotations so that adequate
accuracy can be maintained.
• To ensure uniformity two methods of quoting should be
adopted- money prices (prices quoted is per unit commodity)
and quantity prices ( prices are quoted per unit of money)
Price quotations
• Index numbers are specialised averages. We need to
select from various averaged. Median and mode can’t
be used because of their limitations.
• We need to select arithmetic mean or geometric mean.
Selection of an
average
Problems in construction of index numbers
Selection of system of weighing
• It refers to assigning relative importance to different
items included in the construction of index numbers
• Their are two types of indices weighted and. unweighted
. Weighted all commodities are given equal Importance
• Unweighted include quantity weights ( commodities are
given importance according to the amount of quantity)
and value weight ( importance is given according to
amount of expenditure (P * Q)
Selection of appropriate formula
• Selection of formulae from laspeyre’s method,
paasche’s method, fisher’s method etc
• We can’t depend on one formulae and
selection depends upon type and purpose of
index numbers
Limitations of index numbers
• Limitedcoverage- indexnumbersarebasedonsample
items.
• Qualitativechangesareignored
• Ignoreschangesin theconsumptionpattern
• Limitedapplicability
• Misleadingresults-indexnumbersmaynot beperfect
it wrongbaseyearhasbeentaken,wrongformulaeor
wrongweightageis takenetc
• Basedonaverages
Methods of constructing index
numbers
Unweighted or
simple index
numbers
Simple
aggregative
method
Simple averages
of price relative
method
Weighted index
numbers
Weighted
averages of
prices relative
method
Weighted
aggregative
method
Methods of constructing index numbers
Unweighted (simple) index numbers
• In this method all items of the series are
given equal importance. Index numbers
are constructed in two methods
1. Simple aggregative method
2. Simple average of price relative method
Simple aggregative method
• This method is also known as actual price method. It is
simple to construct.
• In this method aggregate price of commodities in
current year ( ) are divided by the aggregate price
of these commodities in the base year( ) and
expressed in percentage
symbolically
P 1 - price index of current year
-sum of prices of commodities of current year
- sum of prices of commodities of base year
Example:
• Construct index numbers for 2008 taking 2000 as the base
year
Solution -
Commodities A B C D E
Prices in 2000 16 40 35 9 2
Prices in 2008 20 60 70 18 1.50
Commodi
ties
Prices in
2000 (P0)
Prices in
2008(P1)
A 16 20
B 40 60
C 35 70
D 9 18
E 2 1.50
total 102 169.5
169.5
102
= 100X
= 166.18
Simple average of price relative method
• In this method first price relative of current year is calculated. A Price
relative is the price for current year expressed as percentageof the
period of base year.
• Symbolically
or
P1- prices of current year P0- prices of base year
N- number of commodities
R or - price relative
Example:
• Construct index numbers for following data using average of relative
price method
Commodities P Q R S T
Prices in 1998 40 28 12.5 10 30
Prices in 2004 50 35 15 20 90
Solution:
commodities Prices
in 1998
Prices in
2004
Price
relative (PR)
P 40 5 125
Q 28 35 125
R 12.5 15 120
S 10 20 200
T 30 90 300
Total 120.5 210 870
210
120.5
5
= X 100 = 174
Or
870
5
= = 174
In the construction all the
items of the series are
assigned rational weights in
an explicit manner. Weights
are assigned to various items
to reflect their relatives
importance in the series.
Weights in index numbers
are constructed by the
following methods
Weighted index numbers
Weighted aggregative method
 In this method weights are
assigned to various items.
Weighted aggregate of the
prices are calculated instead
of simple aggregates
 Various techniques are used
for assigning weights to items-
• On the basis of quantities of
the base year or
• On the basis of quantities of
current year or
• On the basis of quantities of
current and base year
Weighted
aggregativ
e method
Laspeyre’s
method
Fisher’s
method
Paasche’s
method
Laspeyre’s method
• This method was introduced by Mr. Laspeyre in 1871. in
this method weights are represented by the quantities
of the commodities in the base year.
• Formulae is
- prices of current year
- prices of base year
-Quantities of base year
- sum total of the product of prices of current year ( )
and quantities of the base year( )
- sum total of the product of prices of base year ( ) and
quantities of base year ( )
Example:
• Construct index numbers for following using Laspeyre’ method
Commodities 1997 2008
prices quantity prices quantity
A 20 4 40 6
B 50 3 60 5
C 40 5 50 10
D 20 10 40 20
com
modit
ies
1997 2008
pric
es
quantit
y
price
s
Quantit
y
A 20 4 40 6 160 80
B 50 3 60 5 180 150
C 40 5 50 10 250 200
D 20 10 40 20 400 200
Total 990 630
Solution
= 990
630 X 100
= 157.26
Paasche’s method
• This method was introduced by Mr.Paasche in.1874 in this
method weights are represented by the quantities of the
commodities in their current year.
• Formulae
-Prices of current year
-prices of base year
-Quantities of the current year
- sum of total of the product of price of the current year ( )
and quantities of the current year ( )
- sum of total of the product of price of base year ( ) and
quantities of the current year ( )
Fisher’s method-
• This method was introduced by Prof.Irving fisher. This
method combines the techniques of both Laspeyre’s
method and paasche’s method.
• In other words in fisher’s method weights are represented
by quantities of both base and current year.
• Formulae
-Prices of current year
-prices of base year
-Quantities of the current year
- Quantities of base year
L- Laspeyre’s method and
P- paasche’s method
Example:
• Construct index numbers for following
Commodities Base year 1998 Current year 2009
prices quantities prices quantities
A 2 100 3 100
B 8 200 10 50
C 10 300 15 100
D 6 400 10 50
Solution
Commo
dities
1998 2009
price
s
quantit
y
price
s
quantit
y
A 2 100 3 100 300 200 300 200
B 8 200 10 50 2000 1600 500 400
C 10 300 15 100 4500 3000 1500 1000
D 6 400 10 50 4000 2400 500 300
Total 10800 7200 2800 1900
Weighted average of price relative method
• In this method, the price relatives of current year are
calculated on the basis of base year prices. Since it is
weighted method, we need to calculate weights and find
the products of weights and price relatives and then
average is calculated.
We need to calculate weights (if not given)
W=
R or PR =
Example:
• Construct index number for given data
Commodity A B C D E
Quantity (units)
in 1998
2 3 5 2 1
Price in 1998 50 40 40 100 160
Price in 2005 70 60 50 140 160
Solution:
commodit
y
Quantity
in 1998
Price in
1998
Price in
2005
Weights
W=
R= RW
A 2 50 70 100 140 14000
B 3 40 60 120 150 18000
C 5 40 50 200 125 25000
D 2 100 140 200 140 28000
E 1 160 160 160 100 16000
780 101000
101000
780
= = 129.49
Some important index numbers
• The following index numbers have been regularly
published by the govt and
used for determining various
policy measures
Importan
t index
numbers
Consume
r price
index
Sensex
Agricultur
al
productio
n index
Industrial
productio
n index
Wholesale
price
index
Consumer price index
• Consumer price index (CPI) also known
as the cost of living index, measures the
average change in the retail prices. The CPI for
industrial workers is increasingly considered the
appropriate indicator of general inflation, which
shows the most accurate impact of price rise on
the cost of living of common people.
• The main groups of consumers for whom the
consumer price index numbers have been
calculated in India are:
1. The industrial workers
2. The urban non-manual workers and
3. The agricultural labourers
Need to prepare CPI ?
• We need to prepare CPI because
1. General index numbers fail to highlight the effect of
increase or decrease in prices of various goods on
cost of living of people
2. Different classes of consumers, consume different
commodities that too in different proportions
CPI reflects the effect of increase or decrease of
prices in the cost of living of different classes
of people in a society.
Construction of CPI
The following steps are observed to construct consumer price
index
• Selection of class of consumer- consumers should be classified
into various classes e.g., industrial labour, teachers etc
• Enquiry about the family budget- we select a sample of adequate
number representative families from the selected group and
following information is collected
(I)Commodities consumed (II)quantity of these commodities
(III)prices of these commodities
(IV)total expenditure incurred by consumers
• Information about prices- the retail prices of selected goods and
services should be gathered from the area to which these
consumers belong.
• Assigning weightage- weightage to different items must be given
according to their relative importance
Methods of construction
Their are two methods to construct CPI
Aggregative
expenditure method
• This method gives
importance to quantities of
the base year. We need to
find aggregate expenditure
of base year and current
year
• In simple word we use
Laspeyre’s method
• Formulae-
Family budget method
• This method gives
importance to price relatives
the current year price id
divided by base years and
multiplied by 100. this is
done for each commodity
Then weights are calculated
• Formulae- R=
Example:
• Construct CPI using both aggregative expenditure
and family budget method
Commodity Base year Current year
Prices Quantity Prices Quantity
A 2 10 4 5
B 5 12 6 10
C 4 20 5 15
D 2 15 3 10
Solution:
• Aggregative expenditure method
Commodity Base year Current year
Prices quantity Prices Quantity
A 2 10 4 5 40 20
B 5 12 6 10 72 60
C 4 20 5 15 100 80
D 2 15 3 10 45 30
total 257 190
257
190
= =X 100 135.26
Solution:
commodi
ty
Base year Current year Weights
W=
R= RW
prices quantit
y
price
s
Quantit
y
A 2 10 4 5 20 200 4000
B 5 12 6 10 60 120 7200
C 4 20 5 15 80 125 10000
D 2 15 3 10 30 150 4500
190 25700
25700
190
= = 135.26
Importance of CPI
• The CPI is used to determine the purchasing power of
money and real wages
• It helps to formulate govt.policy
• If the prices of certain essential commodities increase
due to shortage the govt may decided to provide
them through faire price shops or rationing
• Consumer price index also used to analyse the market
of specific commodities
Difficulties in construction of CPI
• As different sections of society have different
standards of living becomes difficult to have one CPI
for different classes of people
• Every family household has different budget set because
proportion of expenditure incurred on given basket of
goods varies from one family to other. The reasons is that
the habits, tastes and preference of consumers keep
changing
• Retail prices being used to construct CPI also fails to truly
express the results because retail prices of commodities are
not fixed they keep on changing whenever their is change in
supply and demand
• Sample of consumers selected to construct index numbers
may fail to truly represent the class if sample is not done
carefully
Whole sale price index
• The whole sale price index numbers indicates the change in
general price level . Unlike CPI, it does not have any reference
consumercategory. It does include itemspertaining to services like
barber charges, repairing etc.
• the commodityweights in WPI are determined by the estimates of the
commodity value of domestic production and value of imports
inclusive of import duty during the base year.
• It is available on weekly basis. Commodity are broadly classified into
three categories- (I) primary articles, (II)fuel, power, light &
lubricants (III) manufactured products
Uses of wholesale price index
• The index number is helpful in forecasting the demand and
supply conditions of the commodities in the economy. If
there is increase in wholesale price index, it means the
demand of commodities is more than their supply.
• It helps us to understand monetary and real value of macro
aggregates. Monetary value is based on prices of the current
year and real value is based on prices of the base year.
• The WPI is used to calculate the rate of inflation in the
country.
The weekly inflation rate is given by
= whole sale price index for tth week
= whole sale price index for(t -1)th week
Example:
• If wholesale price index for week 1 = 800 and
for week 2= 880 calculate weekly rate of
inflation
• Solution: Rate of inflation=
here t=880 and t-1=800
880-800
800
X 100 = 80
800
X 100 = 10%
Industrial production index
• The index number of industrial production measures
changes in the level of industrial changes in the
level of industrial production comprisng many
industries. It include production of public and private
sector.
• It is weighted average of quantity relatives
• Formula,
- quantity production in current year
- quantity production in base year
W- weights
Purpose of construction
• This is designed to measure the increase or decrease
min output of some industries
• It is a quantity index which measure changes in the quantity
index which measures changes in the quantity of production
• Data of industrial production are collected under the
following categories: (I) mining and quarrying industries –
coal, aluminium, petroleum etc.
(II)mechanical industries- ships, aeroplanes etc
(III)textile industries- woollen cotton silk etc.
(IV)metallurgical industries- iron and steel, rolling mills etc.
(V)miscellaneous- glass, washing powder, chemical etc.
• The data for above are collected monthly, quarterly or yearly
• We use quantity relative method for construction
Example:
• Construct index number of industrial production for
the following
Industries Mining Textiles Cement Iron and
steel
Output (base
year)
125 80 40 60
Output
(current
year)
250 120 50 180
Weights 30 40 20 10
Solution:
Industries Base year
quantity
Current
year
quantity
Weights
W
quantity relative
w
Mining 125 250 30 200 6000
Textile 80 120 40 150 6000
Cement 40 50 20 125 2500
Iron and
steel
60 180 10 300 3000
100 17500
17500
100
= = 175
Agriculture production index
• Index numbers of agricultural production
is a weighted average of quantity
relatives
• Its base period is triennium ending 1981-
82
• In 2003-04 the index number of
agricultural production was 179.5 it
means that agricultural production has
increased by 79.5% over the average of
three years 1979-80, 1980-81 and 1981-
82
• Food grains have a weight of 62.92% in
Sensex
 Sensex is an index numbers representing the
movement in share price of major companies
listed in the Bombay stock exchange.
 It is one number that represents whole share
markets.
 The movement of Sensex tells us about
prices of shares of listed companies with
Bombay stock exchange
• if the Sensex goes up it means that prices of
the stock of most of the companies under
BSE Sensex have gone up
• If Sensex goes down it means that prices of
the stock of companies under BSE have gone
Other useful index numbers
1. Human development index-
• this index measures literacy, life expectancy,
attainment of education and per capita GDP
for different countries.
• This index number measures human
development which helps to compare human
development in different countries to
determine whether the country is developed or
underdeveloped.
Producer price index
• Producer price index numbers measures price
changes from the producer’s perspective.
• It uses only basic price including taxes, trade
margins, and transport costs.
• A working group on revision of whole sale price
index (1933-34 = 100) is inter alia examining the
feasibility of switching over from WPI to a PPI in
India as in many countries.
Inflation and index numbers
• Inflation refers to general rise in price level.
Inflation is the persistent rise in prices.
• If the inflation is not controlled money will not able
to perform its function as a unit of value or medium
of exchange. Inflation lowers the value of money
that is purchasing power of money goes down.
• The WPI is widely used to measure the rate of
inflation. This index has capability to measure the
price fluctuations of all commodities in a
comprehensive way.
• Real income of wages =
present wages
present price index
X 100
Example:
• Calculate real wages if present wages are Rs.340
and current price index is Rs.250
Solution:
Real income of wages =
340
250
680
5
present wages
present price index
X
100
100=
= = 136
X
Important formula’s
• Unweighted (simple) index numbers
1. Simple aggregative method
2. Simple average of price relative method
• Weighted index numbers
o Weighted aggregative method
1. Laspeyre’s method
2. Paasche’s method
3. Fisher’s method
o Weighted average of price relative method
 Construction of CPI
I. Aggregative expenditure method
II. Family budget method
 Wholesale price index
 Industrial production index
 Real income of wages =
Important formula’s
present wages
present price index X 100
Thank you

Index numbers

  • 1.
    Index Numbers By Poonajangid 11th ‘B’
  • 2.
    Understand the meaning ofthe term index numbers Apprecia te its limitatio n Calculate an index number Become familiar with the use of some widely used index numbers
  • 3.
    Content: • Index numbers-meaning • Features of index numbers • Advantages of index numbers • Problems in construction of index numbers • Limitation of index number • Methods of construction of index numbers • Some important index numbers • Uses of different types of index numbers • Inflation and index numbers • Conclusion (List of formula’s used in construction of index numbers)
  • 4.
    Index numbers: meaning •An index number is a statistical device for measuring relative changes in magnitude of a group of related variables over time • Index numbers are expressed in terms of percentage • Of the two periods, the period with which the comparison is to be made is known as the base period. • Index number for base period is always taken as 100. • Therefore the study of index numbers helps us to know percentage change in the values of different variables over a period of time with reference to the base year
  • 5.
    Features or characteristicsof index numbers • Index numbers are used for comparison of such variables which have different units Index numbers are specialised averages • Index numbers measures the relative (percentage) changes in the variables over a period of time. They are expressed in percentage. Index numbers are measures of relative changes • Index numbers are used to measure changes in magnitude of certain phenomenon which are not capable of direct measurement. They measure changes in composite and complex phenomenon • They are constructed to make comparison over different time periods with reference some base year. Index numbers measure changes and compare economic conditions of different business units, different places in relation to some base year Basis of comparison
  • 6.
    Advantages of indexnumbers Useful to assess exports and imports Helpful in formulatio n of policies Helpful in measuring inflation and defiation Helpful in knowing the changes in standard of living Useful to businessme n. Important device of business world Useful to government in studying changes in trend.
  • 7.
    Problems in constructionof index numbers
  • 8.
    • Sources ofcollection of data is decided this is done to ensure the reliability of data which is to ensure that data is reliable and comparable Selection of sources of data • We require unbiased price quotations so that adequate accuracy can be maintained. • To ensure uniformity two methods of quoting should be adopted- money prices (prices quoted is per unit commodity) and quantity prices ( prices are quoted per unit of money) Price quotations • Index numbers are specialised averages. We need to select from various averaged. Median and mode can’t be used because of their limitations. • We need to select arithmetic mean or geometric mean. Selection of an average Problems in construction of index numbers
  • 9.
    Problems in constructionof index numbers Selection of system of weighing • It refers to assigning relative importance to different items included in the construction of index numbers • Their are two types of indices weighted and. unweighted . Weighted all commodities are given equal Importance • Unweighted include quantity weights ( commodities are given importance according to the amount of quantity) and value weight ( importance is given according to amount of expenditure (P * Q) Selection of appropriate formula • Selection of formulae from laspeyre’s method, paasche’s method, fisher’s method etc • We can’t depend on one formulae and selection depends upon type and purpose of index numbers
  • 10.
    Limitations of indexnumbers • Limitedcoverage- indexnumbersarebasedonsample items. • Qualitativechangesareignored • Ignoreschangesin theconsumptionpattern • Limitedapplicability • Misleadingresults-indexnumbersmaynot beperfect it wrongbaseyearhasbeentaken,wrongformulaeor wrongweightageis takenetc • Basedonaverages
  • 11.
    Methods of constructingindex numbers Unweighted or simple index numbers Simple aggregative method Simple averages of price relative method Weighted index numbers Weighted averages of prices relative method Weighted aggregative method Methods of constructing index numbers
  • 12.
    Unweighted (simple) indexnumbers • In this method all items of the series are given equal importance. Index numbers are constructed in two methods 1. Simple aggregative method 2. Simple average of price relative method
  • 13.
    Simple aggregative method •This method is also known as actual price method. It is simple to construct. • In this method aggregate price of commodities in current year ( ) are divided by the aggregate price of these commodities in the base year( ) and expressed in percentage symbolically P 1 - price index of current year -sum of prices of commodities of current year - sum of prices of commodities of base year
  • 14.
    Example: • Construct indexnumbers for 2008 taking 2000 as the base year Solution - Commodities A B C D E Prices in 2000 16 40 35 9 2 Prices in 2008 20 60 70 18 1.50 Commodi ties Prices in 2000 (P0) Prices in 2008(P1) A 16 20 B 40 60 C 35 70 D 9 18 E 2 1.50 total 102 169.5 169.5 102 = 100X = 166.18
  • 15.
    Simple average ofprice relative method • In this method first price relative of current year is calculated. A Price relative is the price for current year expressed as percentageof the period of base year. • Symbolically or P1- prices of current year P0- prices of base year N- number of commodities R or - price relative
  • 16.
    Example: • Construct indexnumbers for following data using average of relative price method Commodities P Q R S T Prices in 1998 40 28 12.5 10 30 Prices in 2004 50 35 15 20 90 Solution: commodities Prices in 1998 Prices in 2004 Price relative (PR) P 40 5 125 Q 28 35 125 R 12.5 15 120 S 10 20 200 T 30 90 300 Total 120.5 210 870 210 120.5 5 = X 100 = 174 Or 870 5 = = 174
  • 17.
    In the constructionall the items of the series are assigned rational weights in an explicit manner. Weights are assigned to various items to reflect their relatives importance in the series. Weights in index numbers are constructed by the following methods Weighted index numbers
  • 18.
    Weighted aggregative method In this method weights are assigned to various items. Weighted aggregate of the prices are calculated instead of simple aggregates  Various techniques are used for assigning weights to items- • On the basis of quantities of the base year or • On the basis of quantities of current year or • On the basis of quantities of current and base year Weighted aggregativ e method Laspeyre’s method Fisher’s method Paasche’s method
  • 19.
    Laspeyre’s method • Thismethod was introduced by Mr. Laspeyre in 1871. in this method weights are represented by the quantities of the commodities in the base year. • Formulae is - prices of current year - prices of base year -Quantities of base year - sum total of the product of prices of current year ( ) and quantities of the base year( ) - sum total of the product of prices of base year ( ) and quantities of base year ( )
  • 20.
    Example: • Construct indexnumbers for following using Laspeyre’ method Commodities 1997 2008 prices quantity prices quantity A 20 4 40 6 B 50 3 60 5 C 40 5 50 10 D 20 10 40 20
  • 21.
    com modit ies 1997 2008 pric es quantit y price s Quantit y A 204 40 6 160 80 B 50 3 60 5 180 150 C 40 5 50 10 250 200 D 20 10 40 20 400 200 Total 990 630 Solution = 990 630 X 100 = 157.26
  • 22.
    Paasche’s method • Thismethod was introduced by Mr.Paasche in.1874 in this method weights are represented by the quantities of the commodities in their current year. • Formulae -Prices of current year -prices of base year -Quantities of the current year - sum of total of the product of price of the current year ( ) and quantities of the current year ( ) - sum of total of the product of price of base year ( ) and quantities of the current year ( )
  • 23.
    Fisher’s method- • Thismethod was introduced by Prof.Irving fisher. This method combines the techniques of both Laspeyre’s method and paasche’s method. • In other words in fisher’s method weights are represented by quantities of both base and current year. • Formulae -Prices of current year -prices of base year -Quantities of the current year - Quantities of base year L- Laspeyre’s method and P- paasche’s method
  • 24.
    Example: • Construct indexnumbers for following Commodities Base year 1998 Current year 2009 prices quantities prices quantities A 2 100 3 100 B 8 200 10 50 C 10 300 15 100 D 6 400 10 50
  • 25.
    Solution Commo dities 1998 2009 price s quantit y price s quantit y A 2100 3 100 300 200 300 200 B 8 200 10 50 2000 1600 500 400 C 10 300 15 100 4500 3000 1500 1000 D 6 400 10 50 4000 2400 500 300 Total 10800 7200 2800 1900
  • 26.
    Weighted average ofprice relative method • In this method, the price relatives of current year are calculated on the basis of base year prices. Since it is weighted method, we need to calculate weights and find the products of weights and price relatives and then average is calculated. We need to calculate weights (if not given) W= R or PR =
  • 27.
    Example: • Construct indexnumber for given data Commodity A B C D E Quantity (units) in 1998 2 3 5 2 1 Price in 1998 50 40 40 100 160 Price in 2005 70 60 50 140 160
  • 28.
    Solution: commodit y Quantity in 1998 Price in 1998 Pricein 2005 Weights W= R= RW A 2 50 70 100 140 14000 B 3 40 60 120 150 18000 C 5 40 50 200 125 25000 D 2 100 140 200 140 28000 E 1 160 160 160 100 16000 780 101000 101000 780 = = 129.49
  • 29.
    Some important indexnumbers • The following index numbers have been regularly published by the govt and used for determining various policy measures Importan t index numbers Consume r price index Sensex Agricultur al productio n index Industrial productio n index Wholesale price index
  • 30.
    Consumer price index •Consumer price index (CPI) also known as the cost of living index, measures the average change in the retail prices. The CPI for industrial workers is increasingly considered the appropriate indicator of general inflation, which shows the most accurate impact of price rise on the cost of living of common people. • The main groups of consumers for whom the consumer price index numbers have been calculated in India are: 1. The industrial workers 2. The urban non-manual workers and 3. The agricultural labourers
  • 31.
    Need to prepareCPI ? • We need to prepare CPI because 1. General index numbers fail to highlight the effect of increase or decrease in prices of various goods on cost of living of people 2. Different classes of consumers, consume different commodities that too in different proportions CPI reflects the effect of increase or decrease of prices in the cost of living of different classes of people in a society.
  • 32.
    Construction of CPI Thefollowing steps are observed to construct consumer price index • Selection of class of consumer- consumers should be classified into various classes e.g., industrial labour, teachers etc • Enquiry about the family budget- we select a sample of adequate number representative families from the selected group and following information is collected (I)Commodities consumed (II)quantity of these commodities (III)prices of these commodities (IV)total expenditure incurred by consumers • Information about prices- the retail prices of selected goods and services should be gathered from the area to which these consumers belong. • Assigning weightage- weightage to different items must be given according to their relative importance
  • 33.
    Methods of construction Theirare two methods to construct CPI Aggregative expenditure method • This method gives importance to quantities of the base year. We need to find aggregate expenditure of base year and current year • In simple word we use Laspeyre’s method • Formulae- Family budget method • This method gives importance to price relatives the current year price id divided by base years and multiplied by 100. this is done for each commodity Then weights are calculated • Formulae- R=
  • 34.
    Example: • Construct CPIusing both aggregative expenditure and family budget method Commodity Base year Current year Prices Quantity Prices Quantity A 2 10 4 5 B 5 12 6 10 C 4 20 5 15 D 2 15 3 10
  • 35.
    Solution: • Aggregative expendituremethod Commodity Base year Current year Prices quantity Prices Quantity A 2 10 4 5 40 20 B 5 12 6 10 72 60 C 4 20 5 15 100 80 D 2 15 3 10 45 30 total 257 190 257 190 = =X 100 135.26
  • 36.
    Solution: commodi ty Base year Currentyear Weights W= R= RW prices quantit y price s Quantit y A 2 10 4 5 20 200 4000 B 5 12 6 10 60 120 7200 C 4 20 5 15 80 125 10000 D 2 15 3 10 30 150 4500 190 25700 25700 190 = = 135.26
  • 37.
    Importance of CPI •The CPI is used to determine the purchasing power of money and real wages • It helps to formulate govt.policy • If the prices of certain essential commodities increase due to shortage the govt may decided to provide them through faire price shops or rationing • Consumer price index also used to analyse the market of specific commodities
  • 38.
    Difficulties in constructionof CPI • As different sections of society have different standards of living becomes difficult to have one CPI for different classes of people • Every family household has different budget set because proportion of expenditure incurred on given basket of goods varies from one family to other. The reasons is that the habits, tastes and preference of consumers keep changing • Retail prices being used to construct CPI also fails to truly express the results because retail prices of commodities are not fixed they keep on changing whenever their is change in supply and demand • Sample of consumers selected to construct index numbers may fail to truly represent the class if sample is not done carefully
  • 39.
    Whole sale priceindex • The whole sale price index numbers indicates the change in general price level . Unlike CPI, it does not have any reference consumercategory. It does include itemspertaining to services like barber charges, repairing etc. • the commodityweights in WPI are determined by the estimates of the commodity value of domestic production and value of imports inclusive of import duty during the base year. • It is available on weekly basis. Commodity are broadly classified into three categories- (I) primary articles, (II)fuel, power, light & lubricants (III) manufactured products
  • 40.
    Uses of wholesaleprice index • The index number is helpful in forecasting the demand and supply conditions of the commodities in the economy. If there is increase in wholesale price index, it means the demand of commodities is more than their supply. • It helps us to understand monetary and real value of macro aggregates. Monetary value is based on prices of the current year and real value is based on prices of the base year. • The WPI is used to calculate the rate of inflation in the country. The weekly inflation rate is given by = whole sale price index for tth week = whole sale price index for(t -1)th week
  • 41.
    Example: • If wholesaleprice index for week 1 = 800 and for week 2= 880 calculate weekly rate of inflation • Solution: Rate of inflation= here t=880 and t-1=800 880-800 800 X 100 = 80 800 X 100 = 10%
  • 42.
    Industrial production index •The index number of industrial production measures changes in the level of industrial changes in the level of industrial production comprisng many industries. It include production of public and private sector. • It is weighted average of quantity relatives • Formula, - quantity production in current year - quantity production in base year W- weights
  • 43.
    Purpose of construction •This is designed to measure the increase or decrease min output of some industries • It is a quantity index which measure changes in the quantity index which measures changes in the quantity of production • Data of industrial production are collected under the following categories: (I) mining and quarrying industries – coal, aluminium, petroleum etc. (II)mechanical industries- ships, aeroplanes etc (III)textile industries- woollen cotton silk etc. (IV)metallurgical industries- iron and steel, rolling mills etc. (V)miscellaneous- glass, washing powder, chemical etc. • The data for above are collected monthly, quarterly or yearly • We use quantity relative method for construction
  • 44.
    Example: • Construct indexnumber of industrial production for the following Industries Mining Textiles Cement Iron and steel Output (base year) 125 80 40 60 Output (current year) 250 120 50 180 Weights 30 40 20 10
  • 45.
    Solution: Industries Base year quantity Current year quantity Weights W quantityrelative w Mining 125 250 30 200 6000 Textile 80 120 40 150 6000 Cement 40 50 20 125 2500 Iron and steel 60 180 10 300 3000 100 17500 17500 100 = = 175
  • 46.
    Agriculture production index •Index numbers of agricultural production is a weighted average of quantity relatives • Its base period is triennium ending 1981- 82 • In 2003-04 the index number of agricultural production was 179.5 it means that agricultural production has increased by 79.5% over the average of three years 1979-80, 1980-81 and 1981- 82 • Food grains have a weight of 62.92% in
  • 47.
    Sensex  Sensex isan index numbers representing the movement in share price of major companies listed in the Bombay stock exchange.  It is one number that represents whole share markets.  The movement of Sensex tells us about prices of shares of listed companies with Bombay stock exchange • if the Sensex goes up it means that prices of the stock of most of the companies under BSE Sensex have gone up • If Sensex goes down it means that prices of the stock of companies under BSE have gone
  • 48.
    Other useful indexnumbers 1. Human development index- • this index measures literacy, life expectancy, attainment of education and per capita GDP for different countries. • This index number measures human development which helps to compare human development in different countries to determine whether the country is developed or underdeveloped.
  • 49.
    Producer price index •Producer price index numbers measures price changes from the producer’s perspective. • It uses only basic price including taxes, trade margins, and transport costs. • A working group on revision of whole sale price index (1933-34 = 100) is inter alia examining the feasibility of switching over from WPI to a PPI in India as in many countries.
  • 50.
    Inflation and indexnumbers • Inflation refers to general rise in price level. Inflation is the persistent rise in prices. • If the inflation is not controlled money will not able to perform its function as a unit of value or medium of exchange. Inflation lowers the value of money that is purchasing power of money goes down. • The WPI is widely used to measure the rate of inflation. This index has capability to measure the price fluctuations of all commodities in a comprehensive way. • Real income of wages = present wages present price index X 100
  • 51.
    Example: • Calculate realwages if present wages are Rs.340 and current price index is Rs.250 Solution: Real income of wages = 340 250 680 5 present wages present price index X 100 100= = = 136 X
  • 52.
    Important formula’s • Unweighted(simple) index numbers 1. Simple aggregative method 2. Simple average of price relative method • Weighted index numbers o Weighted aggregative method 1. Laspeyre’s method 2. Paasche’s method
  • 53.
    3. Fisher’s method oWeighted average of price relative method  Construction of CPI I. Aggregative expenditure method II. Family budget method  Wholesale price index  Industrial production index  Real income of wages = Important formula’s present wages present price index X 100
  • 54.