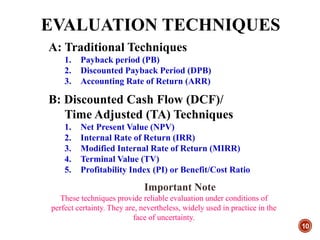
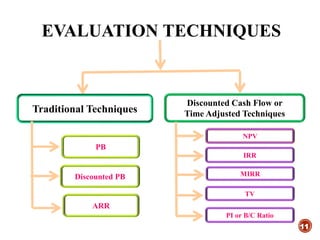
Downloaded 1,314 times

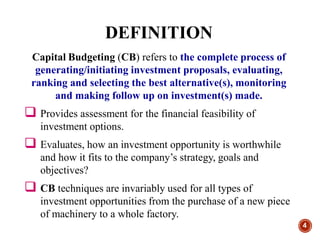
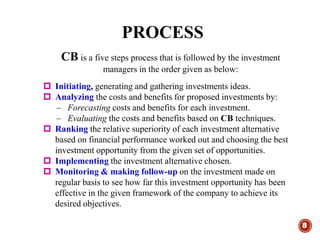
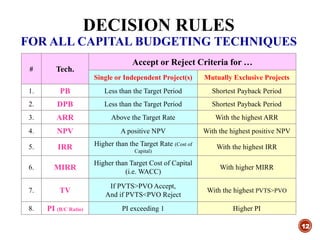
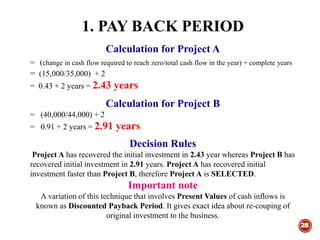
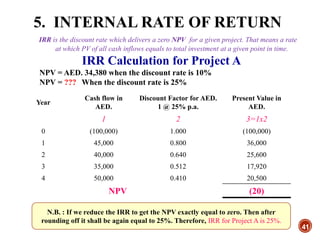
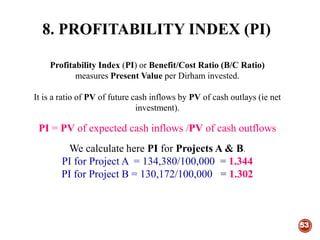
![CALCULATING IRR WITH EXCEL
FOR PROJECT A
43
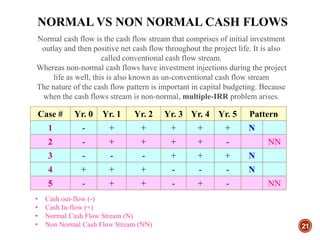
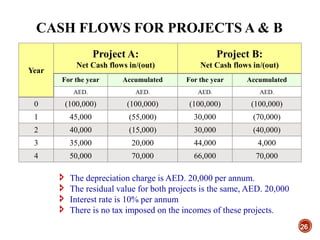
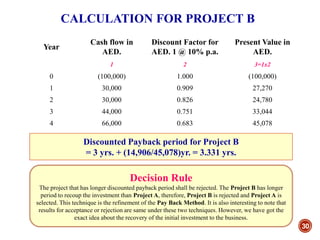
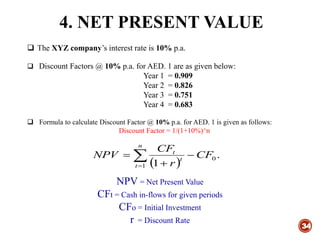
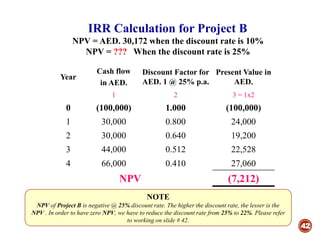
Year Cash flow in AED.
0 (100,000)
1 45,000
2 40,000
3 35,000
4 50,000
IRR for Project A = IRR(values, [guess])
This formula produces an IRR for Project A of 25%.
Tip
Select any cell where you want to see the result. Write =IRR(values, [guess]).
In the place of values give range of cells as given in the above table including
investment at Y0.](https://image.slidesharecdn.com/capitalbudgeting-150523153723-lva1-app6892/85/Capital-Budgeting-43-320.jpg)
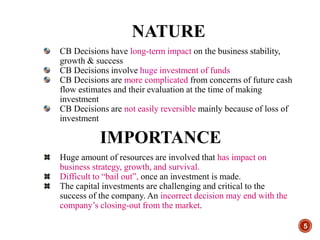
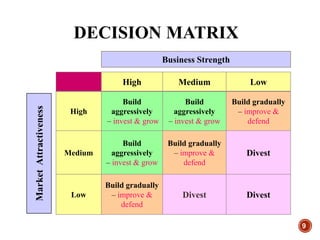
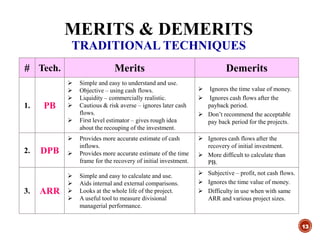
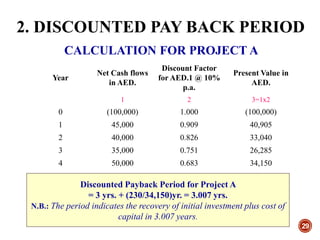
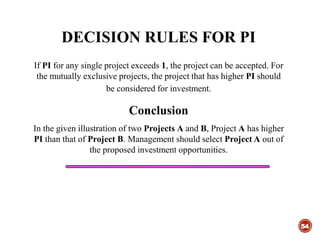
![44
CALCULATING IRR WITH EXCEL
FOR PROJECT B
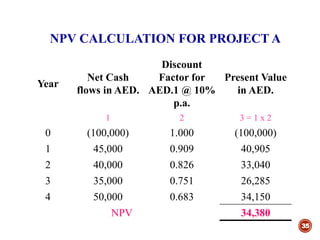
Year Cash flow AED.
0 (100,000)
1 30,000
2 30,000
3 44,000
4 66,000
IRR for Project A =IRR(values, [guess])
This formula produces an IRR for Project A of 21.42%.
TIP
Calculating IRR with EXCEL is easier than from the interpolation formula,
as given here-in-above. So it is advised to calculate IRR with EXCEL.](https://image.slidesharecdn.com/capitalbudgeting-150523153723-lva1-app6892/85/Capital-Budgeting-44-320.jpg)


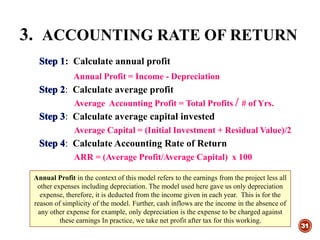
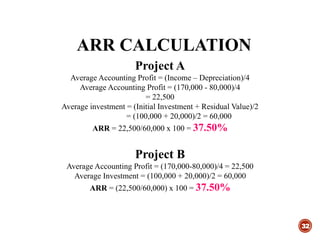
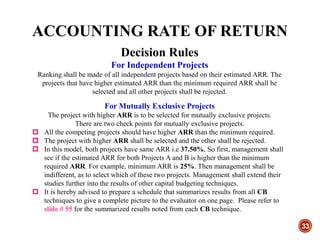
The document discusses capital budgeting, detailing its objectives, processes, and techniques for evaluating investment proposals. It emphasizes the significance of cash flow analysis over accounting profit and presents various decision-making techniques such as NPV, IRR, and payback period, while also addressing issues around capital rationing and the impact of non-financial factors. The document outlines a structured approach to selecting investment opportunities that align with a company's strategic goals and financial performance.


![5) capital_budgeting_(1)_-(2)[1].ppt.pdf](https://cdn.slidesharecdn.com/ss_thumbnails/5capitalbudgeting121-250323135834-146732f6-thumbnail.jpg?width=640&height=640&fit=bounds)


