Download as PDF, PPTX


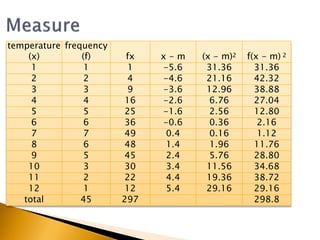


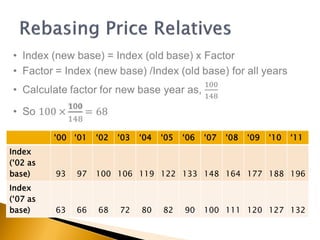


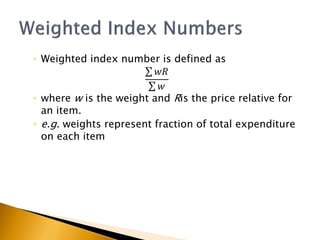


The document provides an overview of fundamental management statistics, covering data types (nominal, ordinal, interval, and ratio) and essential summary statistics (mode, median, mean, etc.). It teaches students how to calculate important index numbers and use them for percentage changes and data deflation. Additionally, it illustrates how to analyze and interpret different data types through various examples and calculations.