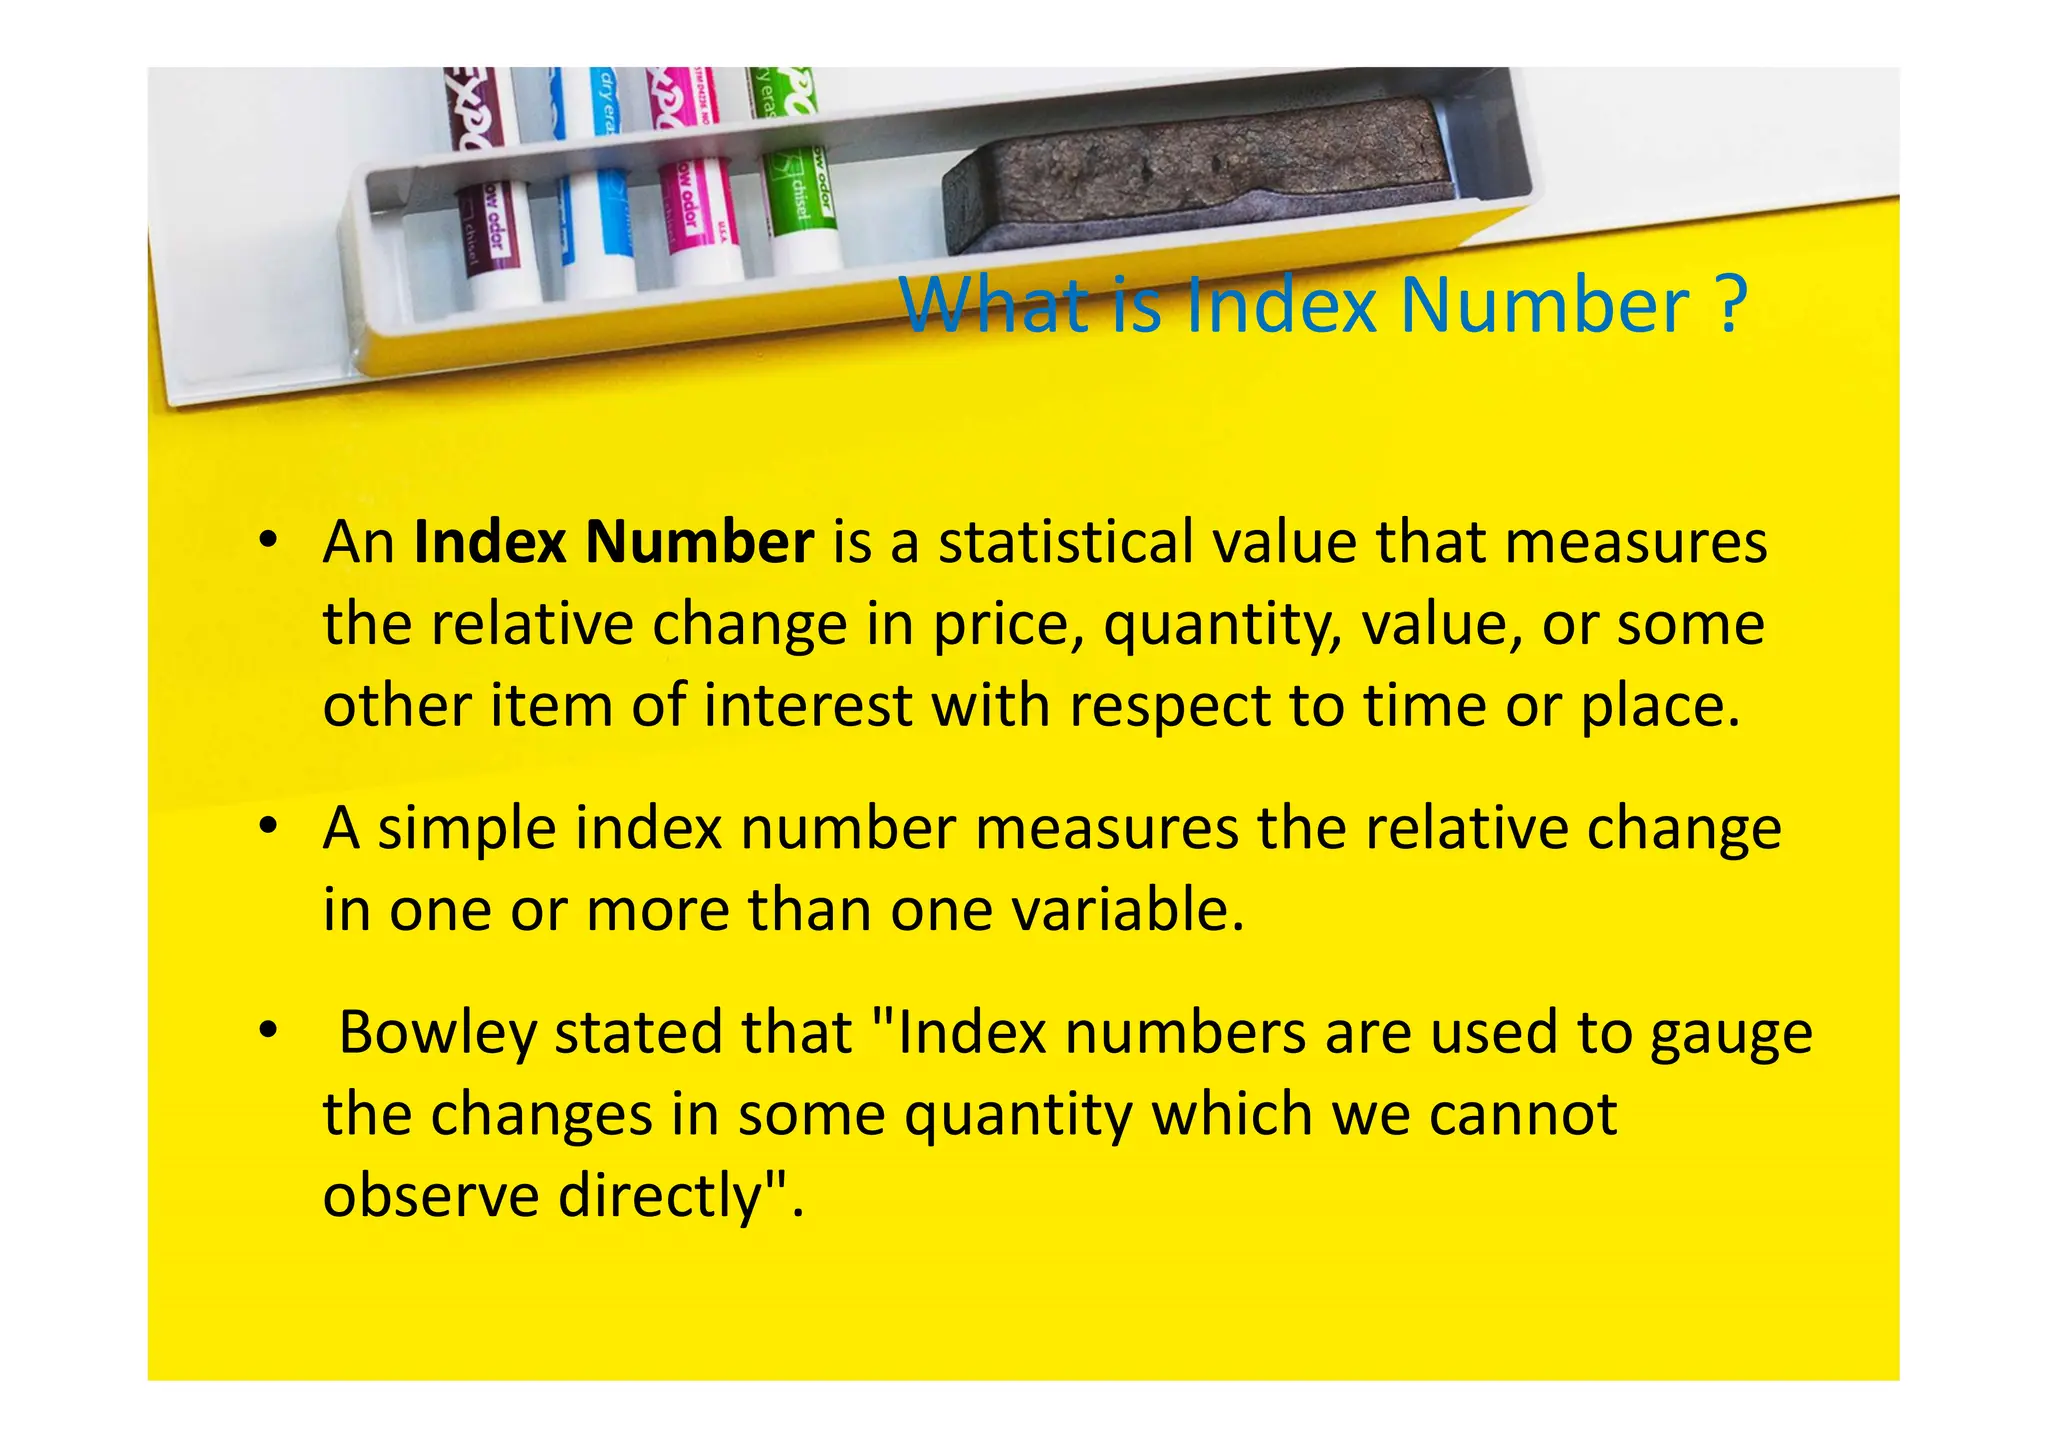
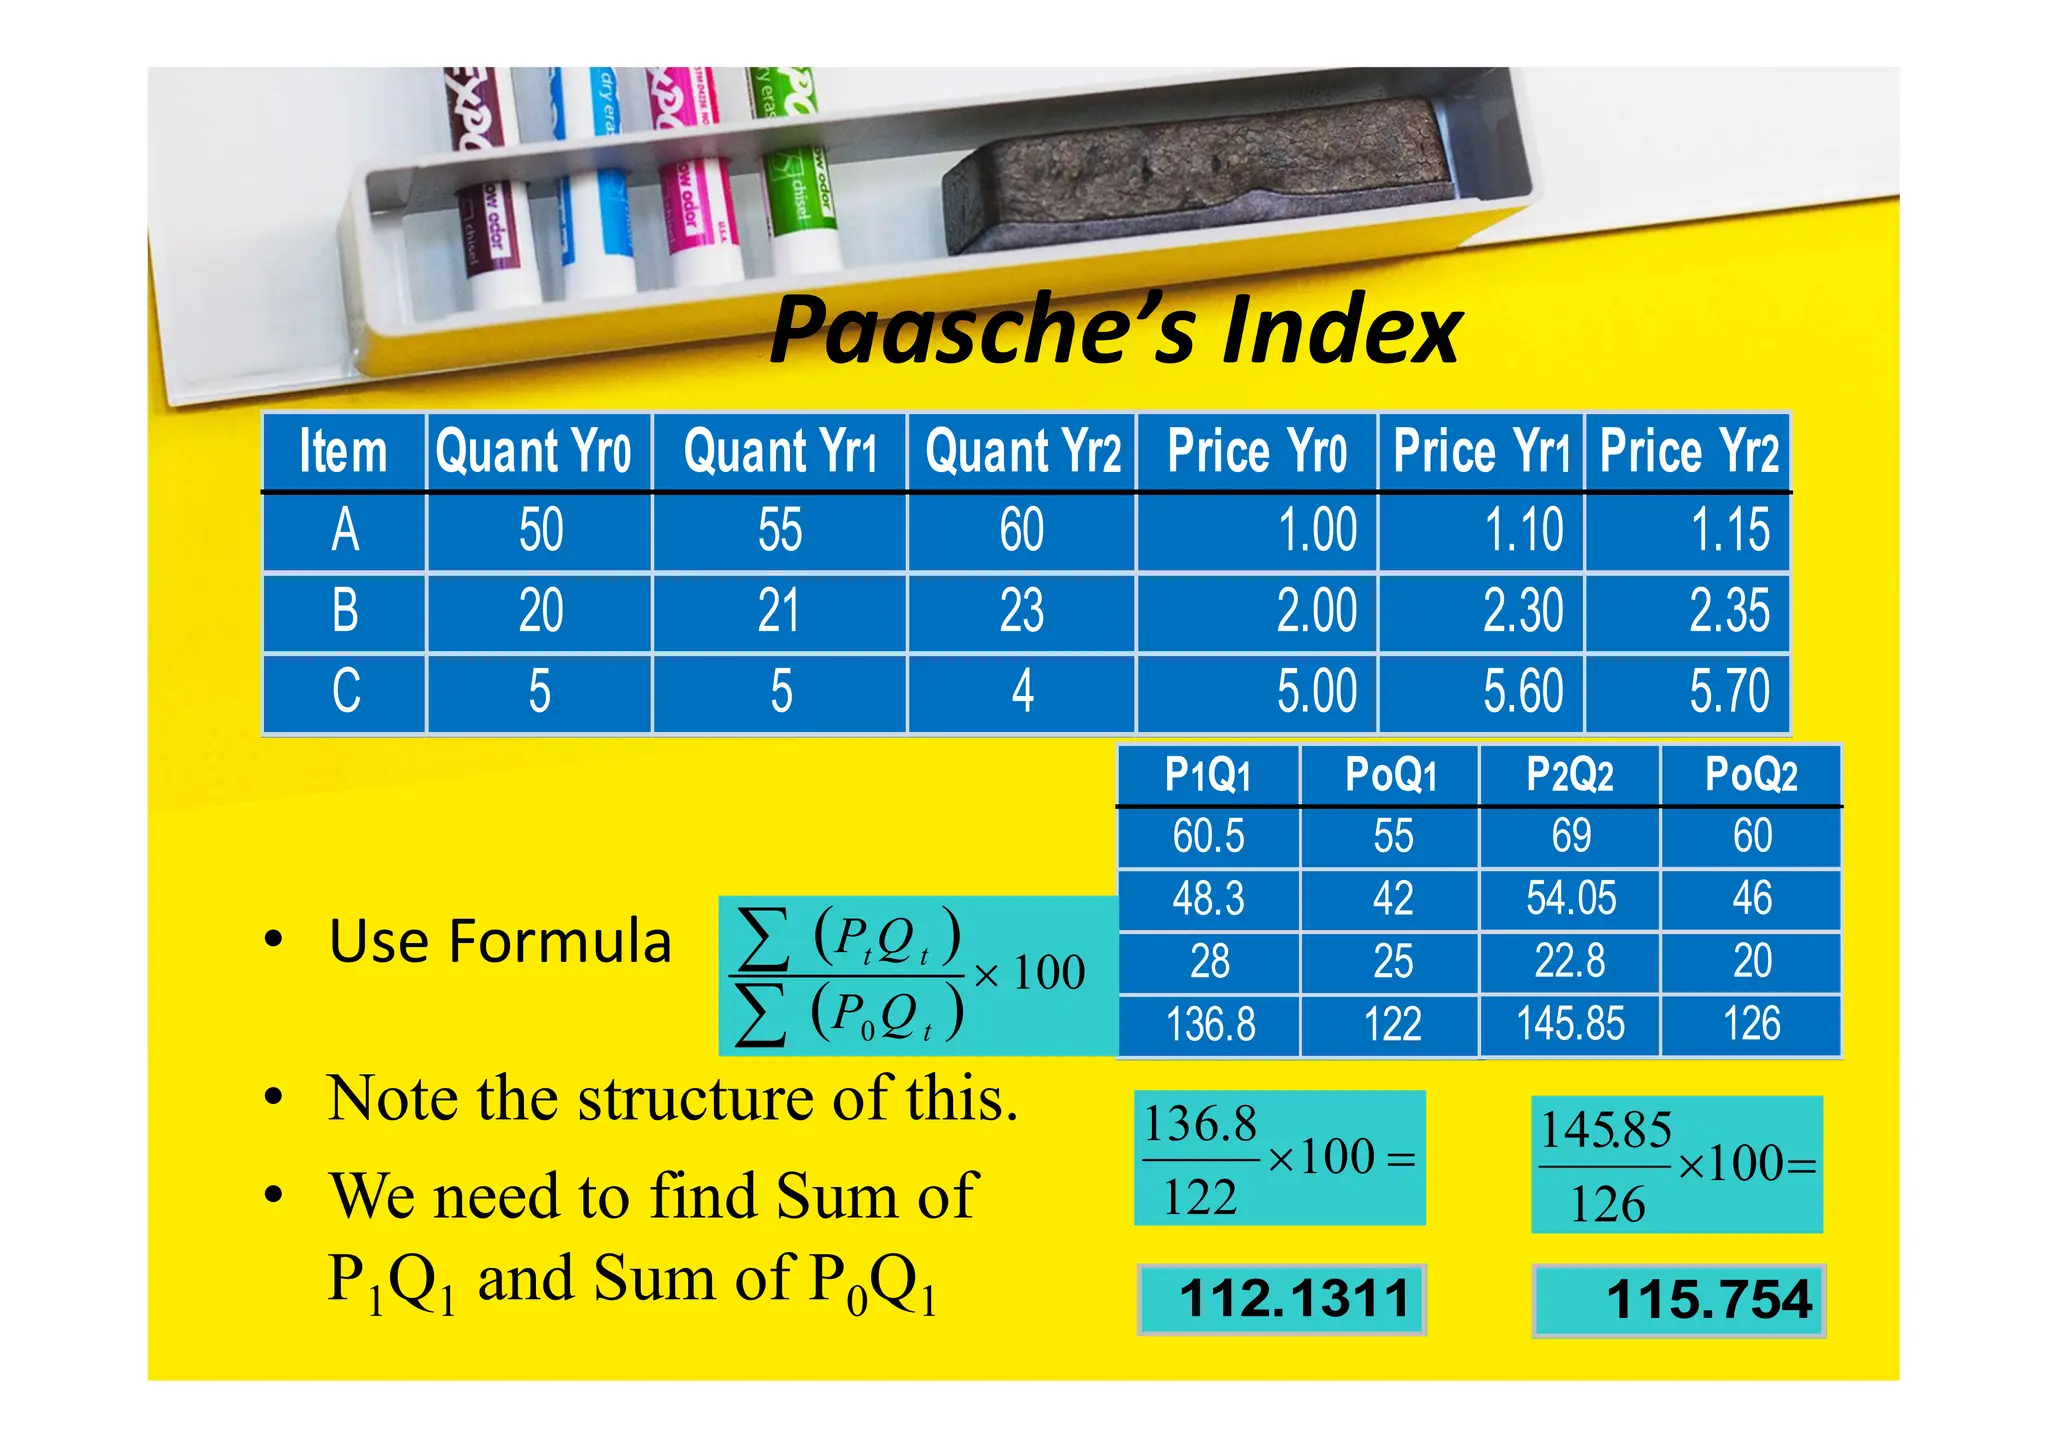
Index Numbers
Dr. ViVek Tyagi
STaTiSTicS DeparTmenT
n.a.S. college, meeruT
Index Numbers
• What is Index Number ?
• Definitions used for all Index Numbers
• Why Convert Data to indices ?
• Types of Index Number
• Some Important Price indices
What is Index Number ?
• An Index Number is a statistical value that measures
the relative change in price, quantity, value, or some
other item of interest with respect to time or place.
• A simple index number measures the relative change
in one or more than one variable.
• Bowley stated that "Index numbers are used to gauge
the changes in some quantity which we cannot
observe directly".
Definition
• “Index numbers are quantitative measures of
growth of prices, production, inventory and other
quantities of economic interest.”
• “Index number indicate the the level of certain
phenomenon at a given time or place in comparison
with the level of the same phenomenon at some
other standard time or place
Characteristics Of Index Numbers
• Index numbers are specialised averages.
• Index numbers measure the change in the level of a
phenomenon.
• Index numbers measure the effect of changes over a period of
time.
• Index numbers are Economic Barometers.
• Index numbers are sign and guide posts of Business.
• Index number are the ratio of the current value to a base value.
Terms used for all Index Numbers
 Current period :- The period for which you wish
to find the Index Number.
 Base period :- The period with which you wish to
compare prices of the current period.
 Price :- Price of the commodity or items you want
to compare.
 Quantity :- Quantity of the commodity or items
you want to compare.
• An index is a convenient way to express a change in a
diverse group of items.
• Converting data to indices also makes it easier to assess
the trend in a series composed of exceptionally large
numbers.
Why Convert Data to Indices?
• Many times we have to combine several items and develop
an index to compare the cost of this aggregation of items in
two different time period
 For example, we might be interested in an index for items that relate to the
expense of operating and maintaining an automobile. The items in the index
might include tires, oil changes, and gasoline prices
 Or we might be interested in a college student index. This index might include
the cost of books, tuition, hostel, meals, and entertainment.
• There are several ways we can combine the items to
determine the index.
Types of Index Number
• Price Index
Unweighted indices
Simple Aggregate Index
Simple Average of the Relative Prices
Weighted indices
Laspeyres Price Index
Paasche Price Index
Fisher’s Price Index
• Quantity Index
• Value Index
• Special Purpose Index Consumer Price Index (CPI)
Price Index
 Price Relative :- The price relative of an item is defined
as:
Where:
pt = price in current period
po = price in base period
 Price Relative Index provides a ratio that indicates the
change in price of an item from one period to another.
o
t
p
p

Relative
Price
Simple Price Index
 Simple Price Index is a common method of expressing this
change as a percentage:
Where:
pt = price in current period
po = price in base period
100
Index
Price
Simple 

o
t
p
p
Simple Price Index
• The simple price index finds the percentage change in the price
of an item from one period to another.
• An index number is always referenced back to a base year
which is always given a value of 100.
• Subsequent figures (the next years) are then scaled in relation
to the base year, so an index gives the change since the base
year.
Suppose we have the price of an item for each
year over a four year period:
Year Price
1 2.00
2 2.20
3 2.40
4 2.90
WHAT IS THE INCREASE EACH YEAR?
We could choose Year 1 as the base year.
Year Price Calculation Index
1 2.00 (2.00 * 100/ 2) 100
2 2.20 (2.20 * 100/ 2) 110
3 2.40 (2.40 * 100/ 2) 120
4 2.90 (2.90 * 100/ 2) 145
Unweighted indices
Simple Aggregate Price Index :- In most cases we are interested in the
prices of a “basket of goods”, and not just one item. We therefore need an aggregate
index.
1. Add up column of prices
2. Use
Item Price Yr0 Price Yr1 Price Yr2
A 1.00 1.10 1.15
B 2.00 2.30 2.35
C 5.00 5.60 5.70
8.00 9.00 9.20
100 112.5 115
100



o
t
P
P
100
8
9

Interpretation
• A price index of 113 would indicate an increase of 13%
relative to the base year.
• A price index of 75 would indicate a decrease of 25%
relative to the base year.
Simple Aggregate Index
Disadvantages:
 An item with a relatively large price can dominate the index.
 If prices are quoted for different quantities, the simple aggregate index
will yield a different answer. This makes it possible to manipulate the
value of the index.
 Does not take into account the quantity of each item sold.
Unweighted Indices (Average of Relative Prices)
• The Average of Relative Prices is the average of
the individual simple price indices of all items.
 It does not take into account the quantity of each item sold.
 It is a vast improvement on the simple aggregate index.
Average of Relative Prices
Where:
k = number of items
pt = price in current period
po = price in base period
k
p
p
k
o
t
 










100
indexes
price
simple
the
of
sum
Prices
Relative
of
Average
Example
1. Find PR’s for each item.
2. Add up columns.
3. Find the average
Item Price Yr0 Price Yr1 Price Yr2
A 1.00 1.10 1.15
B 2.00 2.30 2.35
C 5.00 5.60 5.70
PR Yr0 PR Yr1 PR Yr2
100 110 115
100 115 117.5
100 112 114
300 337 346.5
100 112.33 115.5
The indices we have discussed either dealt with
a single item or assumed that all items are of
equal importance.
This is obviously not true!
We need an index which can deal with a “basket
of goods” and take account of the relative
importance of the items in the basket.
Weighted Index Numbers
• Use of a weighted index allows greater importance to be
attached to some items.
• Generally we use Quantities consumed as weights.
• Price Index uses Price x weight(Quantity) i.e. total cost or
expenditure of that item.
• Most commonly used:
 Base-Weighted Index – Use base year quantities (Laspeyres).
 Current-Weighted Index – Use current year quantities (Paasche).
Base-Weighted Price Index (Laspeyres’s Index)
• Known as the Average of Weighted Relative Prices.
• The weights used are the quantities of each item bought in
the base period.
• This is given by:
100
X
x weights
prices
year
Base
x weights
prices
year
Current
Where:
qo = quantity bought in base period
pt = price in current period
po = price in base period
100
Index
s
Laspeyres’
0
0
0




q
p
q
pt
Laspeyres’s Index
1. Multiply each price by the
quantity in Year 0.
2. Add up each column.
3. Use the given formula
Item Quant Yr0 Price Yr0 Price Yr1 Price Yr2
A 50 1.00 1.10 1.15
B 20 2.00 2.30 2.35
C 5 5.00 5.60 5.70
PoQo P1Qo P2Qo
50 55 57.5
40 46 47
25 28 28.5
115 129 133
100 112.2 115.7
 
 
100
0
0
0



Q
P
Q
Pt
Disadvantage with Laspeyres
• Laspeyres’s Index assumes that the same amount of each
item is bought every year.
• If I bought 35 kg of oranges in base year, the index
assumes I bought the same amount every year, when in
reality if the price went up, one might buy less.
Current-Weighted Price Index (Paasche’s Index)
• Paasche Index uses consumption in the current period.
• Measures the change in the cost of purchasing items in
terms of quantities relating to the current period.
• Paasche and Laspeyres will generally not yield the same
result.
Where:
qt = quantity bought in current period
pt = price in current period
po = price in base period
100
Index
s
Paasche’
0




t
t
t
q
p
q
p
Paasche’s Index
• Note the structure of this.
• We need to find Sum of
P1Q1 and Sum of P0Q1
• Use Formula
Item Quant Yr0 Quant Yr1 Quant Yr2 Price Yr0 Price Yr1 Price Yr2
A 50 55 60 1.00 1.10 1.15
B 20 21 23 2.00 2.30 2.35
C 5 5 4 5.00 5.60 5.70
P1Q1 PoQ1
60.5 55
48.3 42
28 25
136.8 122
P2Q2 PoQ2
69 60
54.05 46
22.8 20
145.85 126
 
 
100
0



t
t
t
Q
P
Q
P

100
122
8
.
136

100
126
85
.
145
112.1311 115.754
Laspeyres versus Paasche Index
Lasperyres’s Index
 The Laspeyres Index measures the
ratio of expenditures on base year
quantities in the current year to
expenditures on those quantities in
the base year.
 The Laspeyres’s Index is usually
larger than the Paasche’s Index.
Paasche’s Index
 The Paasche index measures the ratio
of expenditures on current year
quantities in the current year to
expenditures on those quantities in
the base year.
 With the Paasche index it is difficult
to make year-to-year comparisons
since every year a new set of weights
is used.
Laspeyres versus Paasche Index
Lasperyres’s Index
 Since the Laspeyres index uses base
period weights, it may overestimate
the rise in the cost of living,
because people may have reduced
their consumption of items that
have become costly.
 Laspeyres’s Index tends to
overweight goods whose prices
have increased.
Paasche’s Index
 Since the Paasche index uses current
period weights, it may underestimate
the rise in the cost of living, because
people may have increased their
consumption of items.
 Paasche’s Index, on the other hand,
tends to overweight goods whose
prices have gone down.
Fisher’s Ideal Index
• Fisher’s Ideal Index was developed in an attempt to
offset these shortcomings.
• It is the geometric mean of the Laspeyres and Paasche
indices.
• It is given below:
Index)
s
Paasche'
Index
s
Laspeyres
Index
s
Fisher 
 '
(
'
Where:
qt = quantity bought in current period
qo = quantity bought in base period
pt = price in current period
po = price in base period
100
'
0
0
0







q
p
q
p
q
p
q
p
Index
s
Fisher
t
0
t
t
t
Quantity indices
• An index that measures changes in quantity levels over
time is called a quantity index.
• Probably the best known quantity index is the Index of
Industrial Production.
• A weighted aggregate quantity index is computed in much
the same way as a weighted aggregate price index.
• A weighted aggregate quantity index for period t is given by
100
_
0




t
t
t
w
Q
w
Q
Index
Quantity
Value Index
• A value index measures changes in both the price and
quantities involved.
• A value index, such as the index of department store
sales, needs the original base-year prices, the original
base-year quantities, the present-year prices, and the
present year quantities for its construction.
• Its formula is given as:
100


year
base
the
in
value
Total
year
current
the
in
value
Total
Index
Value
Where:
qt = quantity bought in current period
qo = quantity bought in base period
pt = price in current period
po = price in base period
100
0




q
p
q
p
Index
Value
0
t
t
Special Purpose Index:- Consumer Price Index (CPI)
• It is also known as ‘Cost-of-Living’ Index.
• It is a general indicator of the rate of price change for
consumer goods and services.
• The CPI measures price change over time and does not
provide comparisons between relative price levels at a
particular date.
Special Purpose Index:- Consumer Price Index (CPI)
• The CPI does not provide any basis for measuring
relative price levels between the different cities.
• It allows consumers to determine the effect of
price increases on their Purchasing Power.
• It is a yardstick for revising wages, pensions,
alimony payments, etc. It computes Real Income.
Consumer Price Index (CPI) is given by:
100
CPI
0




w
p
w
pt
CPI Uses - Formulas
100
CPI
1
Money
Of
Power
Purchasing 

100


CPI
Income
Money
Income
Real
Price indices: Other Considerations
• Selection of Items
 When the class of items is very large, a representative
group (usually not a random sample) must be used.
 The group of items in the aggregate index must be
periodically reviewed and revised if it is not
representative of the class of items in mind.
• Selection of a Base Period
 As a rule, the base period should not be too far from
the current period.
 The base period for most indices is adjusted
periodically to a more recent period of time.
Price indices: Other Considerations
• Quality Changes
 A basic assumption of price indices is that the prices
are identified for the same items each period.
 Is a product that has undergone a major quality
change the same product it was?
 A substantial quality improvement also may cause an
increase in the price of a product.
THank you
For any query
WHaTSapp me
aT THe giVen no.
9837787952

Index Number and it's types explained in

  • 1.
    Index Numbers Dr. ViVekTyagi STaTiSTicS DeparTmenT n.a.S. college, meeruT
  • 2.
    Index Numbers • Whatis Index Number ? • Definitions used for all Index Numbers • Why Convert Data to indices ? • Types of Index Number • Some Important Price indices
  • 3.
    What is IndexNumber ? • An Index Number is a statistical value that measures the relative change in price, quantity, value, or some other item of interest with respect to time or place. • A simple index number measures the relative change in one or more than one variable. • Bowley stated that "Index numbers are used to gauge the changes in some quantity which we cannot observe directly".
  • 4.
    Definition • “Index numbersare quantitative measures of growth of prices, production, inventory and other quantities of economic interest.” • “Index number indicate the the level of certain phenomenon at a given time or place in comparison with the level of the same phenomenon at some other standard time or place
  • 5.
    Characteristics Of IndexNumbers • Index numbers are specialised averages. • Index numbers measure the change in the level of a phenomenon. • Index numbers measure the effect of changes over a period of time. • Index numbers are Economic Barometers. • Index numbers are sign and guide posts of Business. • Index number are the ratio of the current value to a base value.
  • 6.
    Terms used forall Index Numbers  Current period :- The period for which you wish to find the Index Number.  Base period :- The period with which you wish to compare prices of the current period.  Price :- Price of the commodity or items you want to compare.  Quantity :- Quantity of the commodity or items you want to compare.
  • 7.
    • An indexis a convenient way to express a change in a diverse group of items. • Converting data to indices also makes it easier to assess the trend in a series composed of exceptionally large numbers.
  • 8.
    Why Convert Datato Indices? • Many times we have to combine several items and develop an index to compare the cost of this aggregation of items in two different time period  For example, we might be interested in an index for items that relate to the expense of operating and maintaining an automobile. The items in the index might include tires, oil changes, and gasoline prices  Or we might be interested in a college student index. This index might include the cost of books, tuition, hostel, meals, and entertainment. • There are several ways we can combine the items to determine the index.
  • 9.
    Types of IndexNumber • Price Index Unweighted indices Simple Aggregate Index Simple Average of the Relative Prices Weighted indices Laspeyres Price Index Paasche Price Index Fisher’s Price Index • Quantity Index • Value Index • Special Purpose Index Consumer Price Index (CPI)
  • 11.
    Price Index  PriceRelative :- The price relative of an item is defined as: Where: pt = price in current period po = price in base period  Price Relative Index provides a ratio that indicates the change in price of an item from one period to another. o t p p  Relative Price
  • 12.
    Simple Price Index Simple Price Index is a common method of expressing this change as a percentage: Where: pt = price in current period po = price in base period 100 Index Price Simple   o t p p
  • 13.
    Simple Price Index •The simple price index finds the percentage change in the price of an item from one period to another. • An index number is always referenced back to a base year which is always given a value of 100. • Subsequent figures (the next years) are then scaled in relation to the base year, so an index gives the change since the base year.
  • 14.
    Suppose we havethe price of an item for each year over a four year period: Year Price 1 2.00 2 2.20 3 2.40 4 2.90
  • 15.
    WHAT IS THEINCREASE EACH YEAR? We could choose Year 1 as the base year. Year Price Calculation Index 1 2.00 (2.00 * 100/ 2) 100 2 2.20 (2.20 * 100/ 2) 110 3 2.40 (2.40 * 100/ 2) 120 4 2.90 (2.90 * 100/ 2) 145
  • 16.
    Unweighted indices Simple AggregatePrice Index :- In most cases we are interested in the prices of a “basket of goods”, and not just one item. We therefore need an aggregate index. 1. Add up column of prices 2. Use Item Price Yr0 Price Yr1 Price Yr2 A 1.00 1.10 1.15 B 2.00 2.30 2.35 C 5.00 5.60 5.70 8.00 9.00 9.20 100 112.5 115 100    o t P P 100 8 9 
  • 17.
    Interpretation • A priceindex of 113 would indicate an increase of 13% relative to the base year. • A price index of 75 would indicate a decrease of 25% relative to the base year.
  • 18.
    Simple Aggregate Index Disadvantages: An item with a relatively large price can dominate the index.  If prices are quoted for different quantities, the simple aggregate index will yield a different answer. This makes it possible to manipulate the value of the index.  Does not take into account the quantity of each item sold.
  • 19.
    Unweighted Indices (Averageof Relative Prices) • The Average of Relative Prices is the average of the individual simple price indices of all items.  It does not take into account the quantity of each item sold.  It is a vast improvement on the simple aggregate index.
  • 20.
    Average of RelativePrices Where: k = number of items pt = price in current period po = price in base period k p p k o t             100 indexes price simple the of sum Prices Relative of Average
  • 21.
    Example 1. Find PR’sfor each item. 2. Add up columns. 3. Find the average Item Price Yr0 Price Yr1 Price Yr2 A 1.00 1.10 1.15 B 2.00 2.30 2.35 C 5.00 5.60 5.70 PR Yr0 PR Yr1 PR Yr2 100 110 115 100 115 117.5 100 112 114 300 337 346.5 100 112.33 115.5
  • 22.
    The indices wehave discussed either dealt with a single item or assumed that all items are of equal importance. This is obviously not true! We need an index which can deal with a “basket of goods” and take account of the relative importance of the items in the basket.
  • 23.
    Weighted Index Numbers •Use of a weighted index allows greater importance to be attached to some items. • Generally we use Quantities consumed as weights. • Price Index uses Price x weight(Quantity) i.e. total cost or expenditure of that item. • Most commonly used:  Base-Weighted Index – Use base year quantities (Laspeyres).  Current-Weighted Index – Use current year quantities (Paasche).
  • 24.
    Base-Weighted Price Index(Laspeyres’s Index) • Known as the Average of Weighted Relative Prices. • The weights used are the quantities of each item bought in the base period. • This is given by: 100 X x weights prices year Base x weights prices year Current
  • 25.
    Where: qo = quantitybought in base period pt = price in current period po = price in base period 100 Index s Laspeyres’ 0 0 0     q p q pt
  • 26.
    Laspeyres’s Index 1. Multiplyeach price by the quantity in Year 0. 2. Add up each column. 3. Use the given formula Item Quant Yr0 Price Yr0 Price Yr1 Price Yr2 A 50 1.00 1.10 1.15 B 20 2.00 2.30 2.35 C 5 5.00 5.60 5.70 PoQo P1Qo P2Qo 50 55 57.5 40 46 47 25 28 28.5 115 129 133 100 112.2 115.7     100 0 0 0    Q P Q Pt
  • 27.
    Disadvantage with Laspeyres •Laspeyres’s Index assumes that the same amount of each item is bought every year. • If I bought 35 kg of oranges in base year, the index assumes I bought the same amount every year, when in reality if the price went up, one might buy less.
  • 28.
    Current-Weighted Price Index(Paasche’s Index) • Paasche Index uses consumption in the current period. • Measures the change in the cost of purchasing items in terms of quantities relating to the current period. • Paasche and Laspeyres will generally not yield the same result.
  • 29.
    Where: qt = quantitybought in current period pt = price in current period po = price in base period 100 Index s Paasche’ 0     t t t q p q p
  • 30.
    Paasche’s Index • Notethe structure of this. • We need to find Sum of P1Q1 and Sum of P0Q1 • Use Formula Item Quant Yr0 Quant Yr1 Quant Yr2 Price Yr0 Price Yr1 Price Yr2 A 50 55 60 1.00 1.10 1.15 B 20 21 23 2.00 2.30 2.35 C 5 5 4 5.00 5.60 5.70 P1Q1 PoQ1 60.5 55 48.3 42 28 25 136.8 122 P2Q2 PoQ2 69 60 54.05 46 22.8 20 145.85 126     100 0    t t t Q P Q P  100 122 8 . 136  100 126 85 . 145 112.1311 115.754
  • 31.
    Laspeyres versus PaascheIndex Lasperyres’s Index  The Laspeyres Index measures the ratio of expenditures on base year quantities in the current year to expenditures on those quantities in the base year.  The Laspeyres’s Index is usually larger than the Paasche’s Index. Paasche’s Index  The Paasche index measures the ratio of expenditures on current year quantities in the current year to expenditures on those quantities in the base year.  With the Paasche index it is difficult to make year-to-year comparisons since every year a new set of weights is used.
  • 32.
    Laspeyres versus PaascheIndex Lasperyres’s Index  Since the Laspeyres index uses base period weights, it may overestimate the rise in the cost of living, because people may have reduced their consumption of items that have become costly.  Laspeyres’s Index tends to overweight goods whose prices have increased. Paasche’s Index  Since the Paasche index uses current period weights, it may underestimate the rise in the cost of living, because people may have increased their consumption of items.  Paasche’s Index, on the other hand, tends to overweight goods whose prices have gone down.
  • 33.
    Fisher’s Ideal Index •Fisher’s Ideal Index was developed in an attempt to offset these shortcomings. • It is the geometric mean of the Laspeyres and Paasche indices. • It is given below: Index) s Paasche' Index s Laspeyres Index s Fisher   ' ( '
  • 34.
    Where: qt = quantitybought in current period qo = quantity bought in base period pt = price in current period po = price in base period 100 ' 0 0 0        q p q p q p q p Index s Fisher t 0 t t t
  • 35.
    Quantity indices • Anindex that measures changes in quantity levels over time is called a quantity index. • Probably the best known quantity index is the Index of Industrial Production. • A weighted aggregate quantity index is computed in much the same way as a weighted aggregate price index. • A weighted aggregate quantity index for period t is given by 100 _ 0     t t t w Q w Q Index Quantity
  • 36.
    Value Index • Avalue index measures changes in both the price and quantities involved. • A value index, such as the index of department store sales, needs the original base-year prices, the original base-year quantities, the present-year prices, and the present year quantities for its construction. • Its formula is given as: 100   year base the in value Total year current the in value Total Index Value
  • 37.
    Where: qt = quantitybought in current period qo = quantity bought in base period pt = price in current period po = price in base period 100 0     q p q p Index Value 0 t t
  • 38.
    Special Purpose Index:-Consumer Price Index (CPI) • It is also known as ‘Cost-of-Living’ Index. • It is a general indicator of the rate of price change for consumer goods and services. • The CPI measures price change over time and does not provide comparisons between relative price levels at a particular date.
  • 39.
    Special Purpose Index:-Consumer Price Index (CPI) • The CPI does not provide any basis for measuring relative price levels between the different cities. • It allows consumers to determine the effect of price increases on their Purchasing Power. • It is a yardstick for revising wages, pensions, alimony payments, etc. It computes Real Income.
  • 40.
    Consumer Price Index(CPI) is given by: 100 CPI 0     w p w pt
  • 41.
    CPI Uses -Formulas 100 CPI 1 Money Of Power Purchasing   100   CPI Income Money Income Real
  • 42.
    Price indices: OtherConsiderations • Selection of Items  When the class of items is very large, a representative group (usually not a random sample) must be used.  The group of items in the aggregate index must be periodically reviewed and revised if it is not representative of the class of items in mind. • Selection of a Base Period  As a rule, the base period should not be too far from the current period.  The base period for most indices is adjusted periodically to a more recent period of time.
  • 43.
    Price indices: OtherConsiderations • Quality Changes  A basic assumption of price indices is that the prices are identified for the same items each period.  Is a product that has undergone a major quality change the same product it was?  A substantial quality improvement also may cause an increase in the price of a product.
  • 44.
    THank you For anyquery WHaTSapp me aT THe giVen no. 9837787952