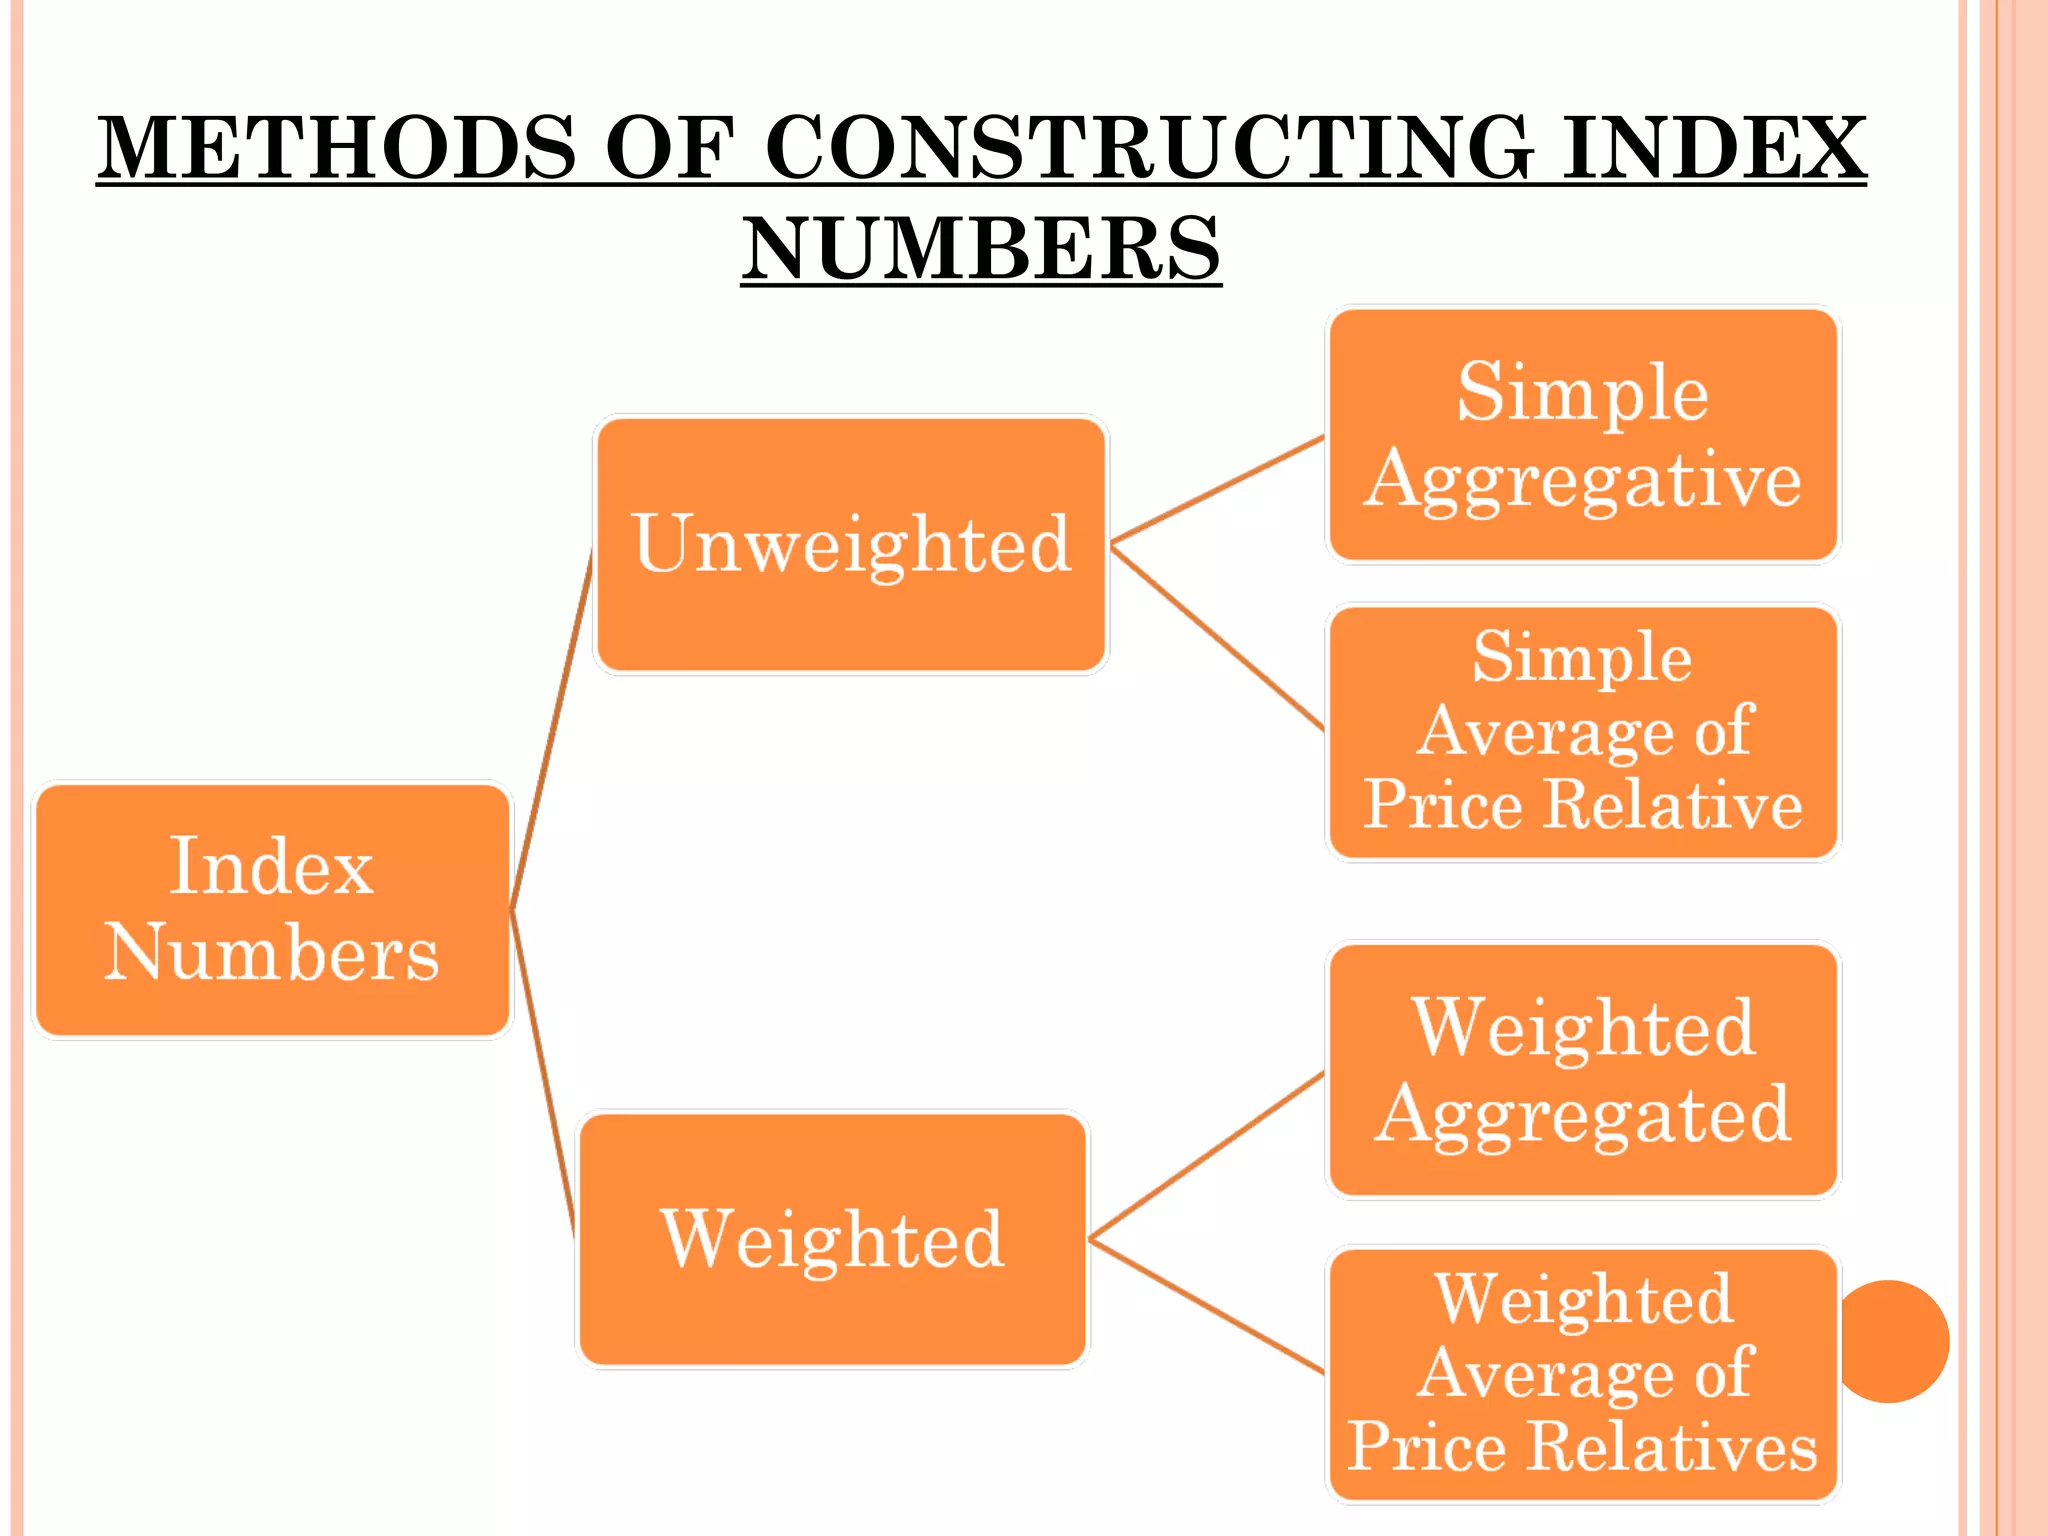
This document discusses various types of index numbers used to measure changes in economic variables over time. It defines index numbers and describes their key characteristics and uses. It also covers different classification and construction methods of index numbers, including simple, weighted, value and chain index numbers. Examples are provided to illustrate the calculation of Laspeyres, Paasche, Fisher ideal and chain index numbers.
INTRODUCTION An indexnumber measures the relative change in price, quantity, value, or some other item of interest from one time period to another. A simple index number measures the relative change in one or more than one variable.
DEFINITION “ Indexnumbers are quantitative measures of growth of prices, production, inventory and other quantities of economic interest .” -Ronold
6.
CHARACTERISTICS OF INDEXNUMBERS Index numbers are specialised averages. Index numbers measure the change in the level of a phenomenon. Index numbers measure the effect of changes over a period of time.
7.
USES OF INDEXNUMBERS To framing suitable policies. They reveal trends and tendencies. Index numbers are very useful in deflating.
8.
PROBLEMS RELATED TOINDEX NUMBERS Choice of the base period. Choice of an average. Choice of index. Selection of commodities. Data collection.
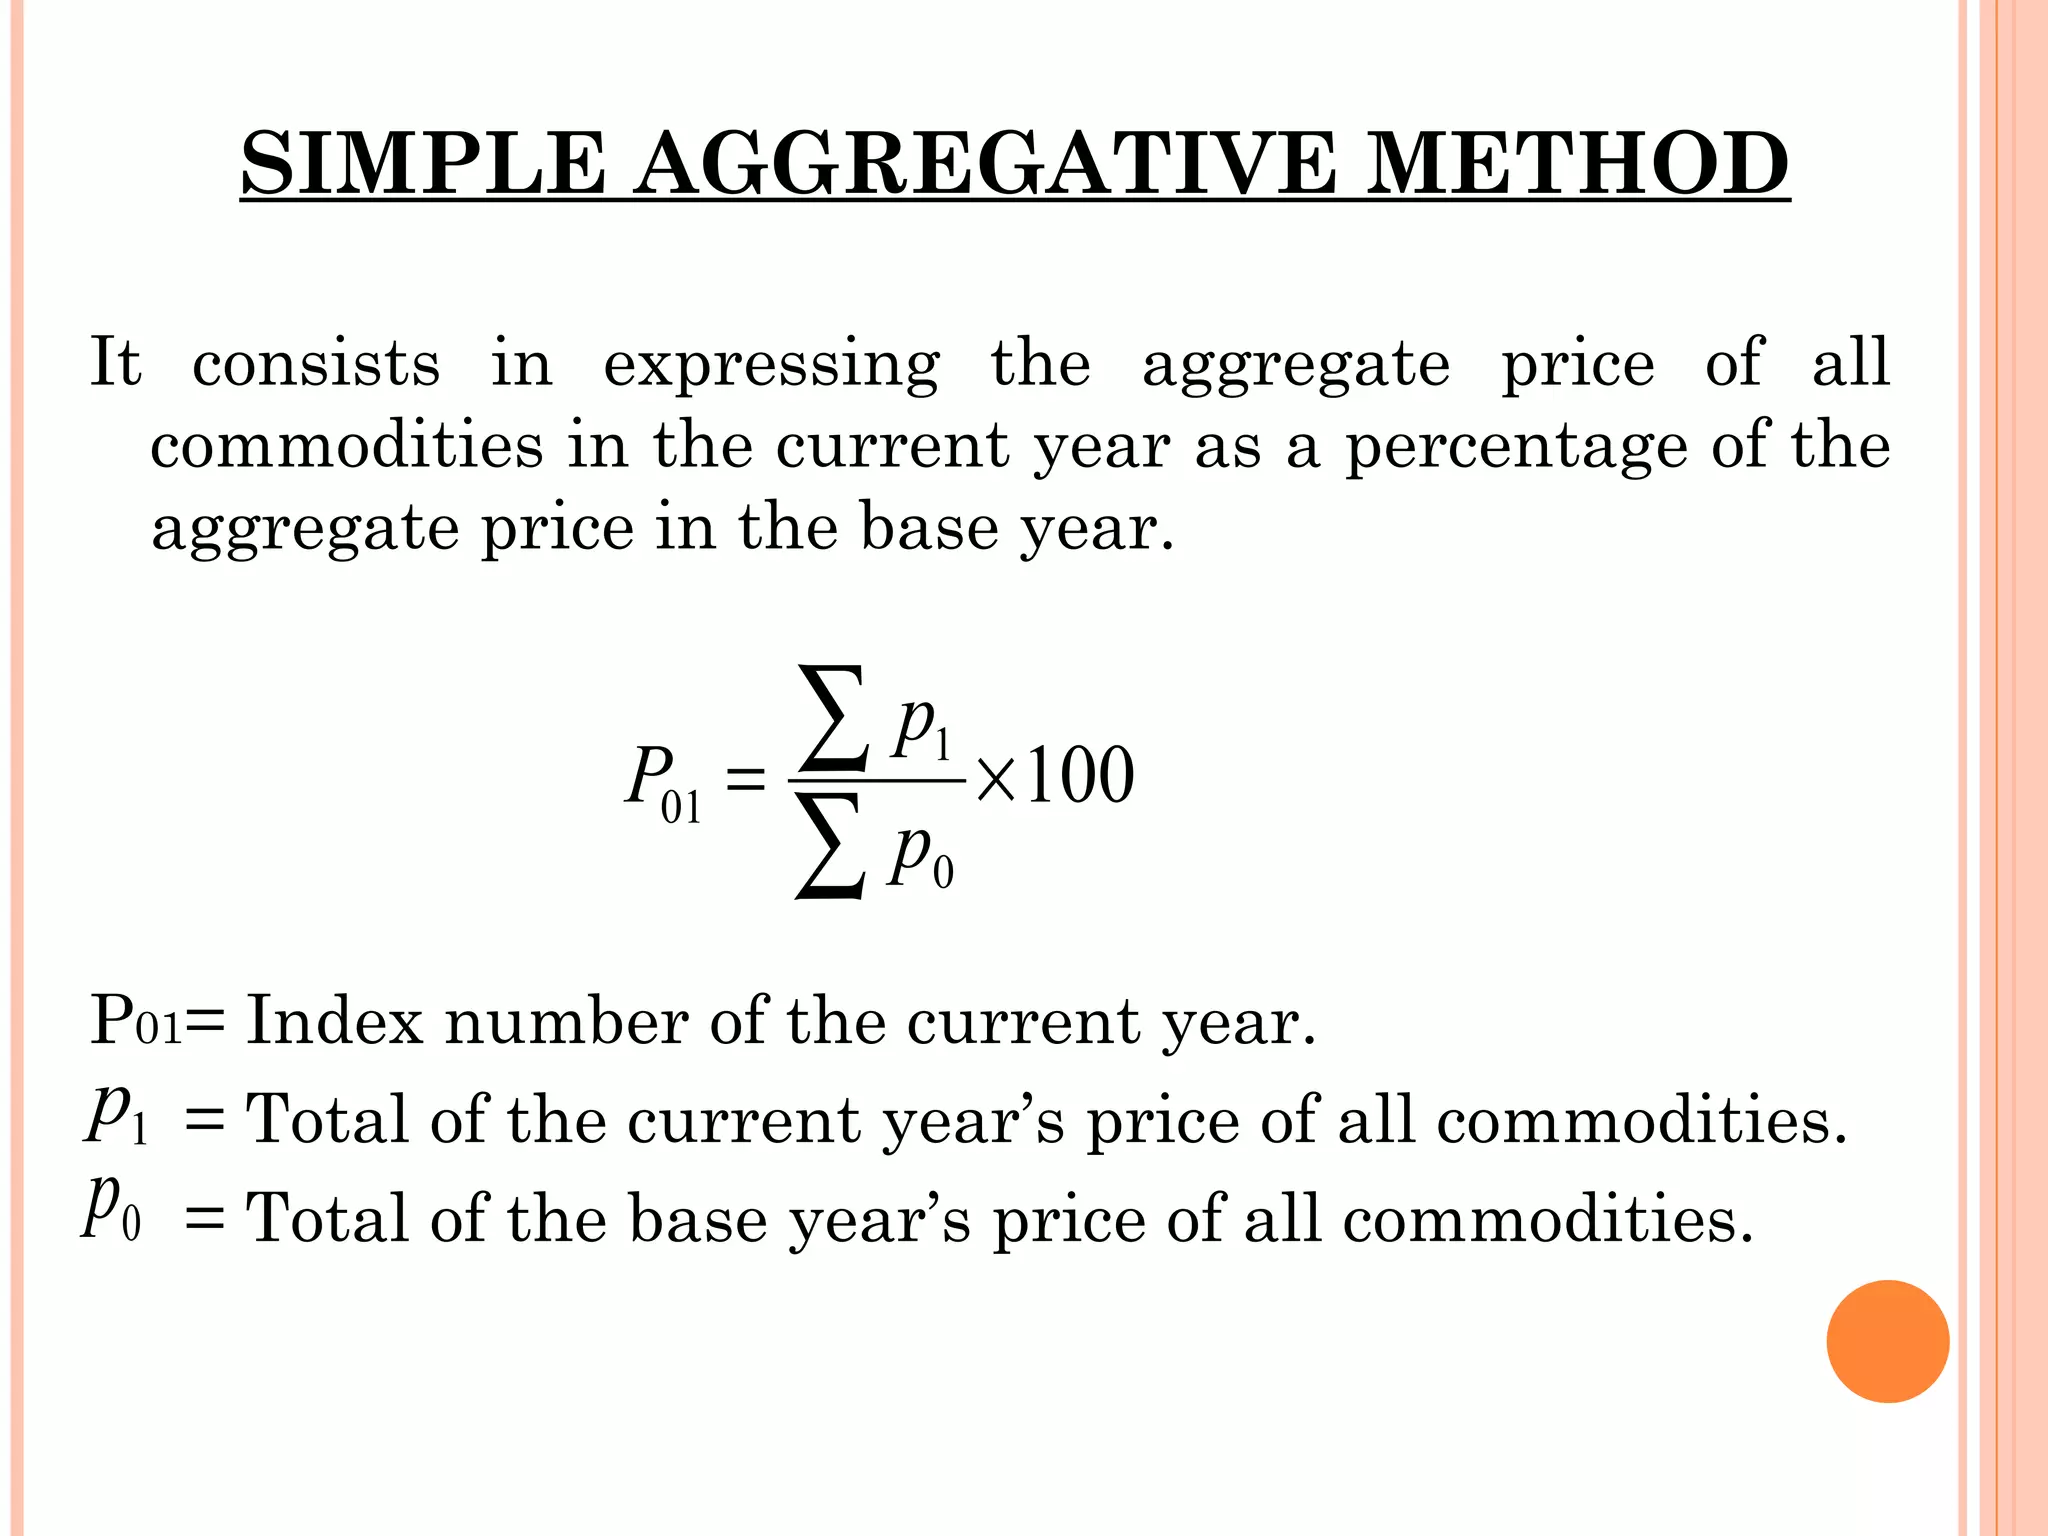
SIMPLE AGGREGATIVE METHODIt consists in expressing the aggregate price of all commodities in the current year as a percentage of the aggregate price in the base year. P 01 = Index number of the current year. = Total of the current year’s price of all commodities. = Total of the base year’s price of all commodities.
12.
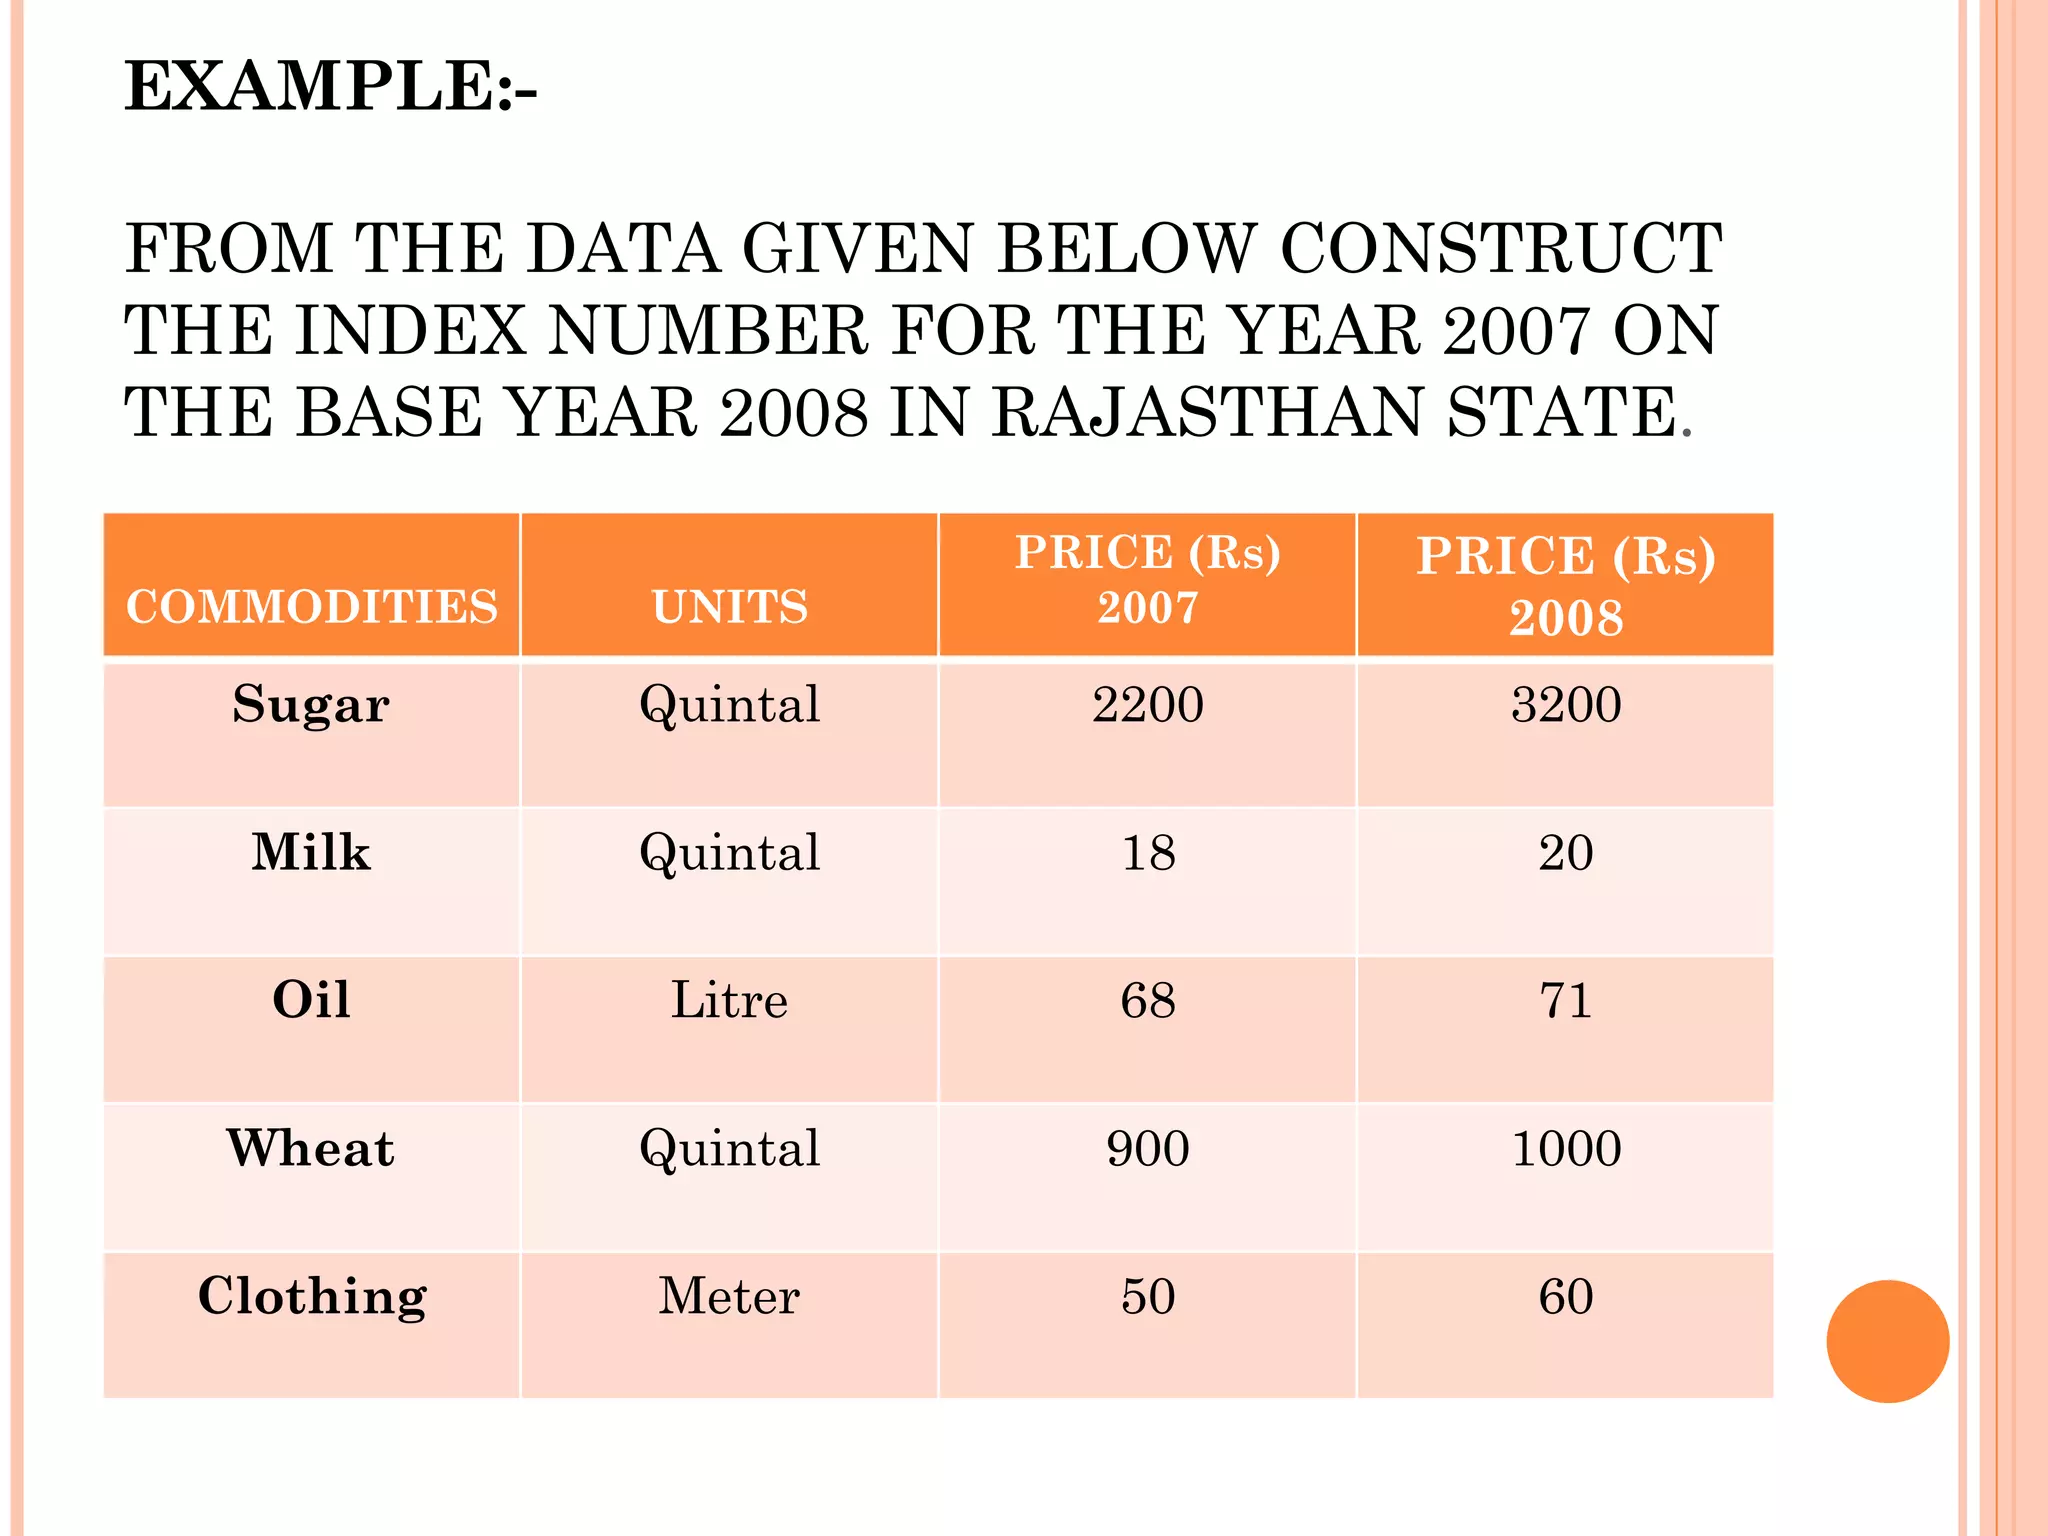
EXAMPLE:- FROM THEDATA GIVEN BELOW CONSTRUCT THE INDEX NUMBER FOR THE YEAR 2007 ON THE BASE YEAR 2008 IN RAJASTHAN STATE . COMMODITIES UNITS PRICE (Rs) 2007 PRICE (Rs) 2008 Sugar Quintal 2200 3200 Milk Quintal 18 20 Oil Litre 68 71 Wheat Quintal 900 1000 Clothing Meter 50 60
13.
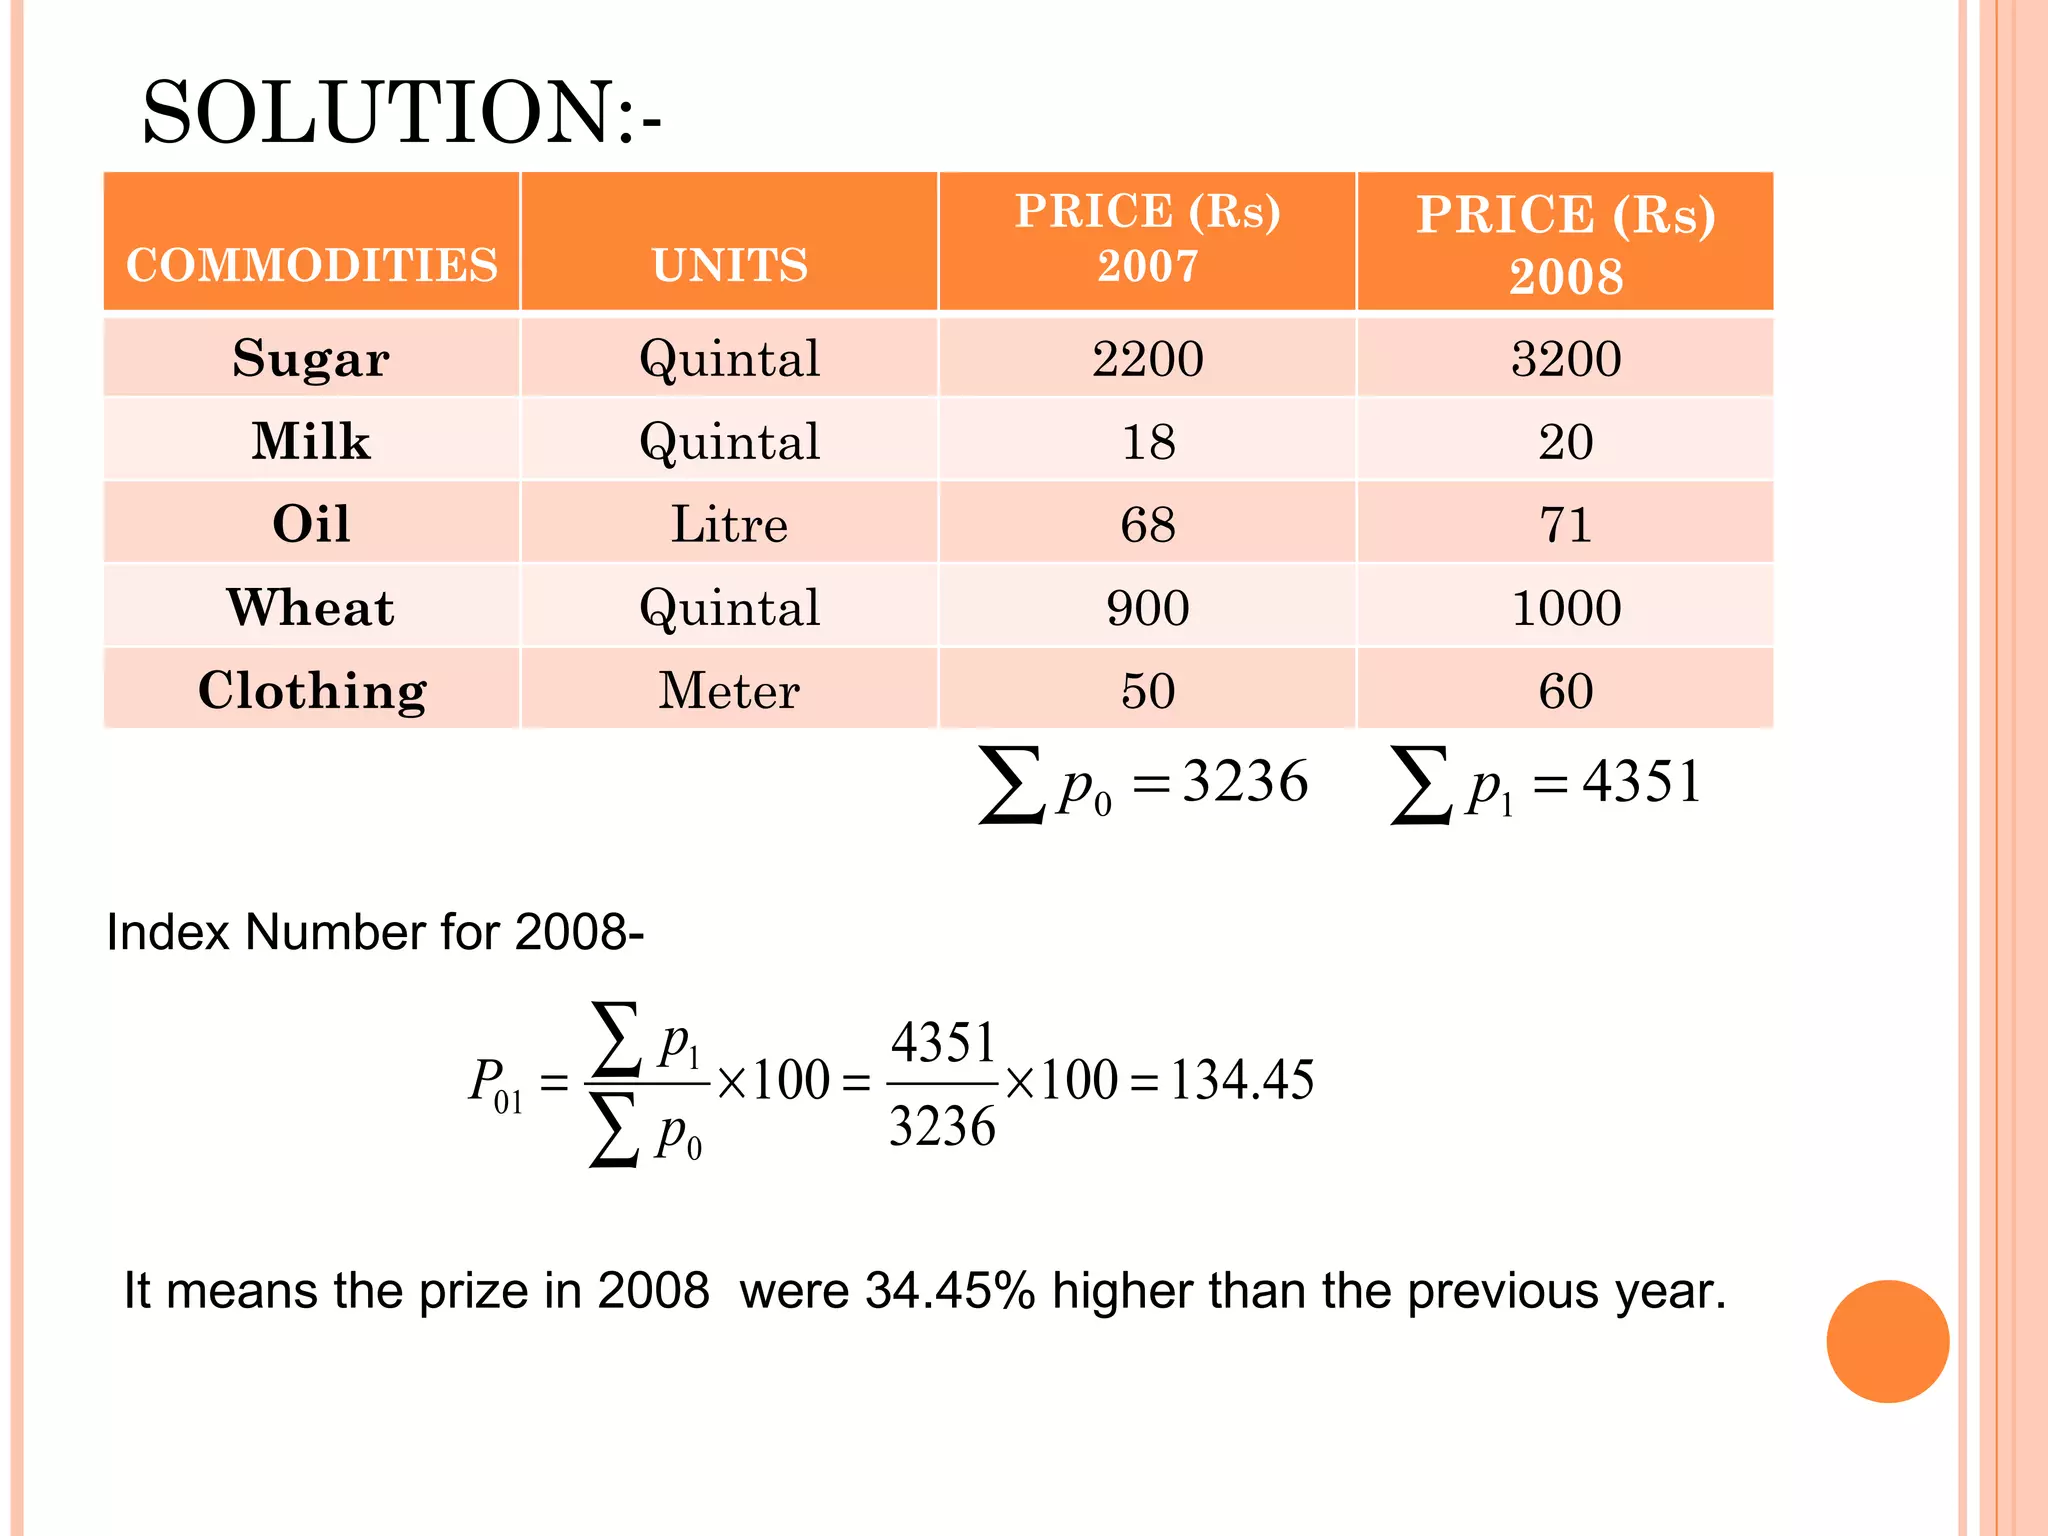
SOLUTION:- Index Numberfor 2008- It means the prize in 2008 were 34.45% higher than the previous year. COMMODITIES UNITS PRICE (Rs) 2007 PRICE (Rs) 2008 Sugar Quintal 2200 3200 Milk Quintal 18 20 Oil Litre 68 71 Wheat Quintal 900 1000 Clothing Meter 50 60
14.
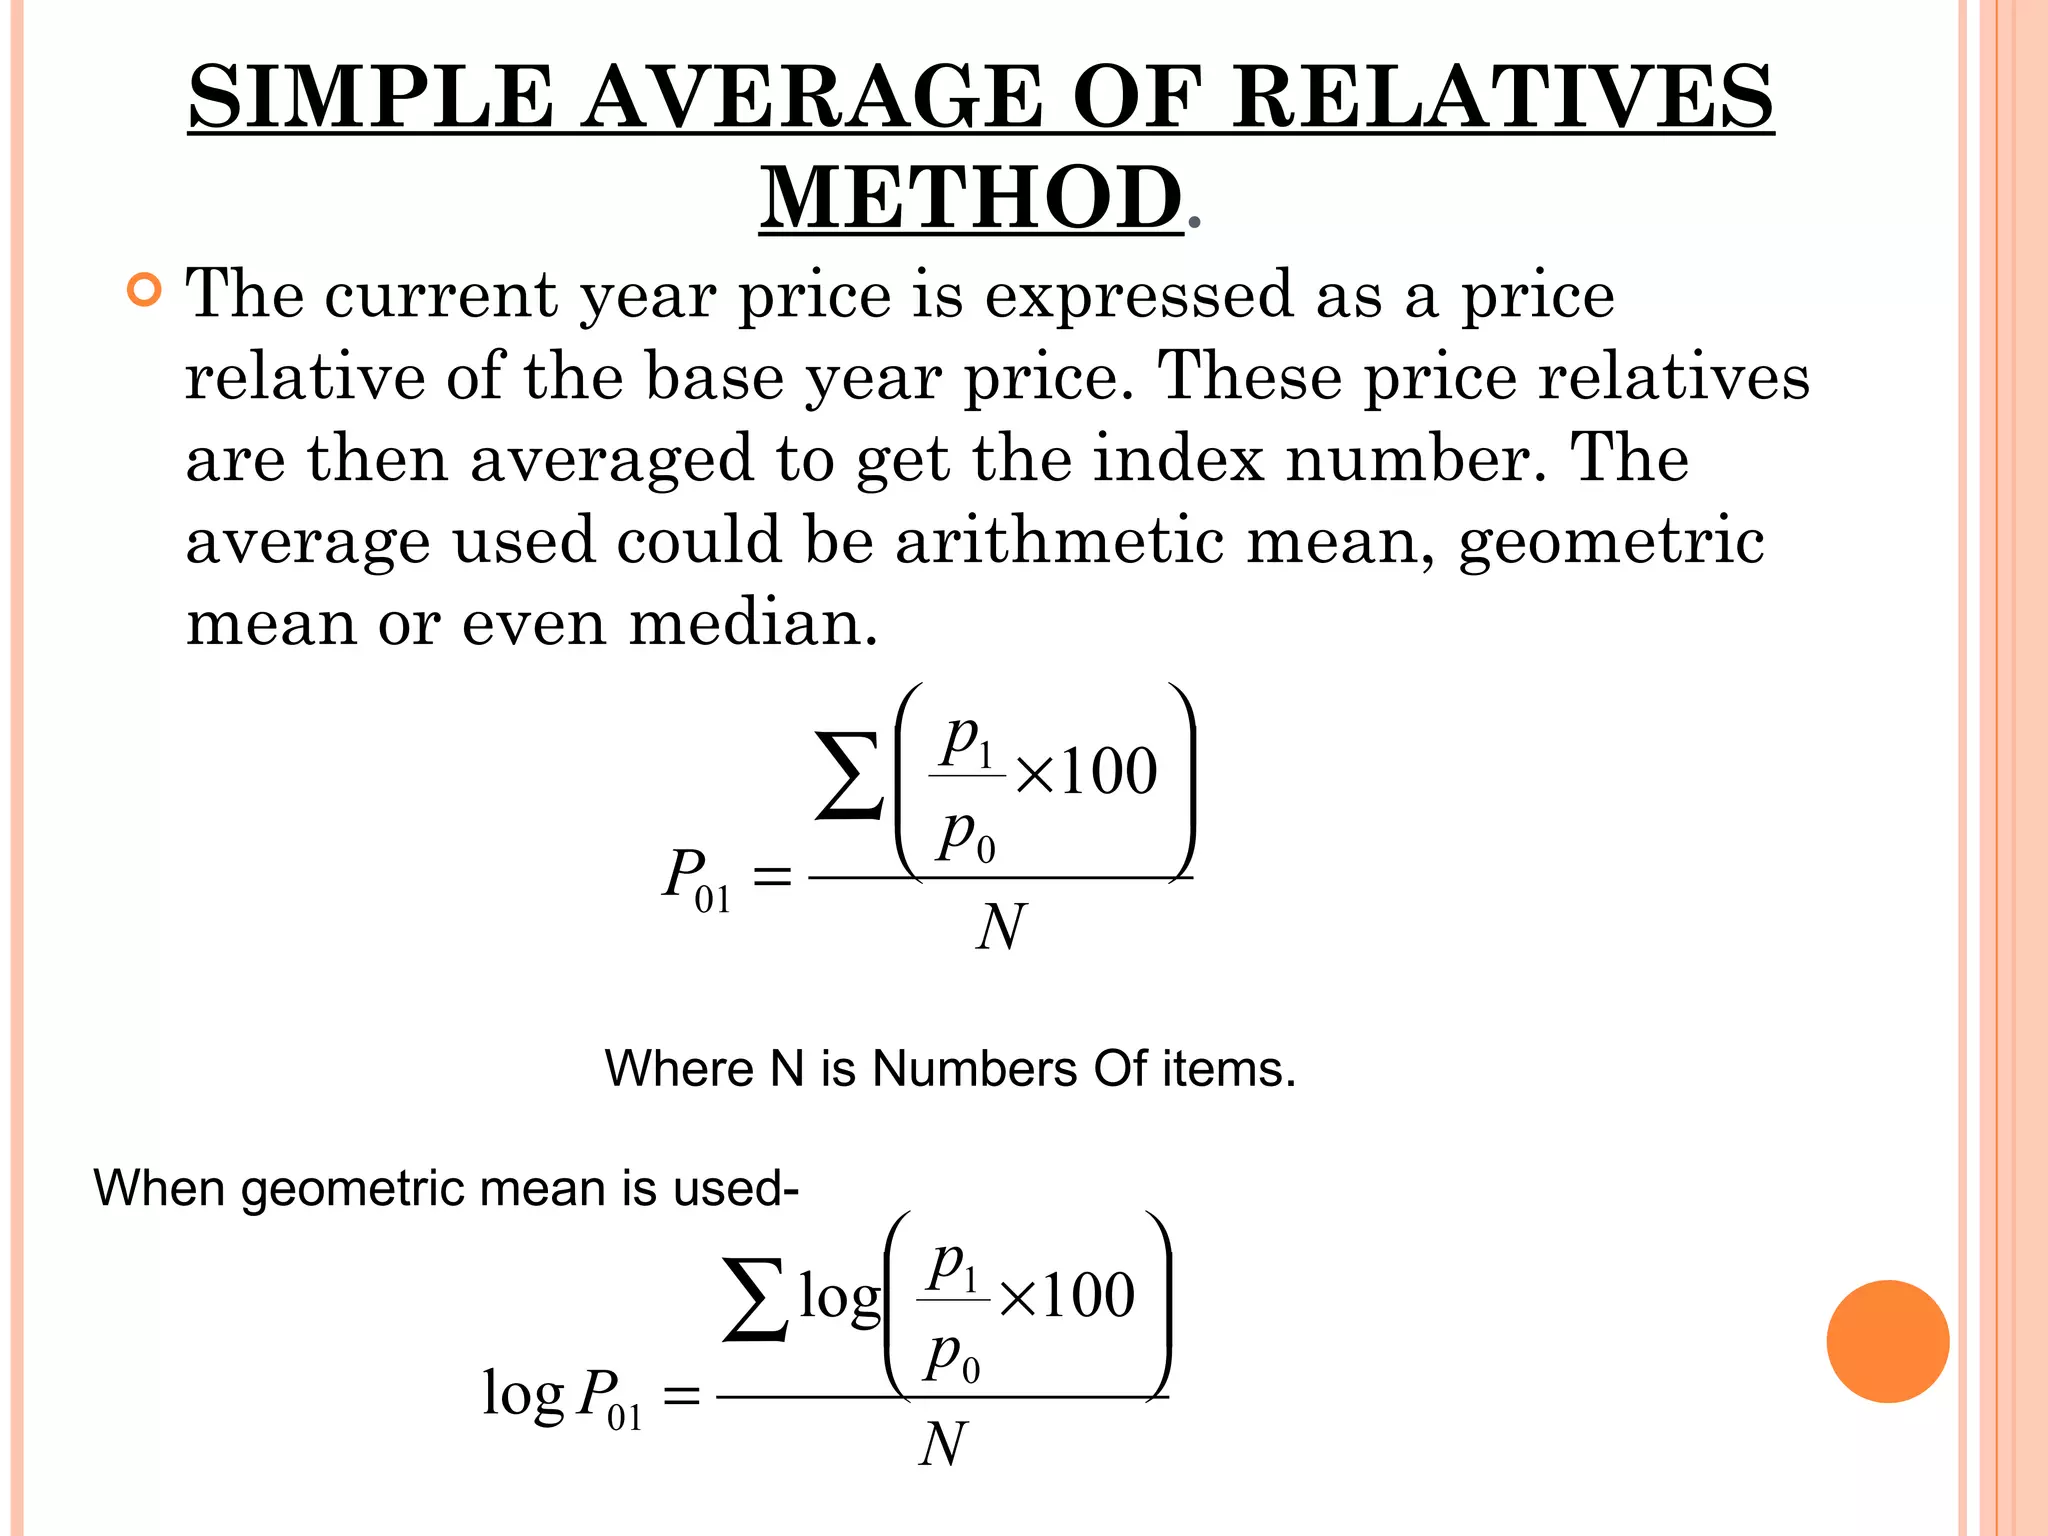
SIMPLE AVERAGE OFRELATIVES METHOD . The current year price is expressed as a price relative of the base year price. These price relatives are then averaged to get the index number. The average used could be arithmetic mean, geometric mean or even median. Where N is Numbers Of items. When geometric mean is used-
15.
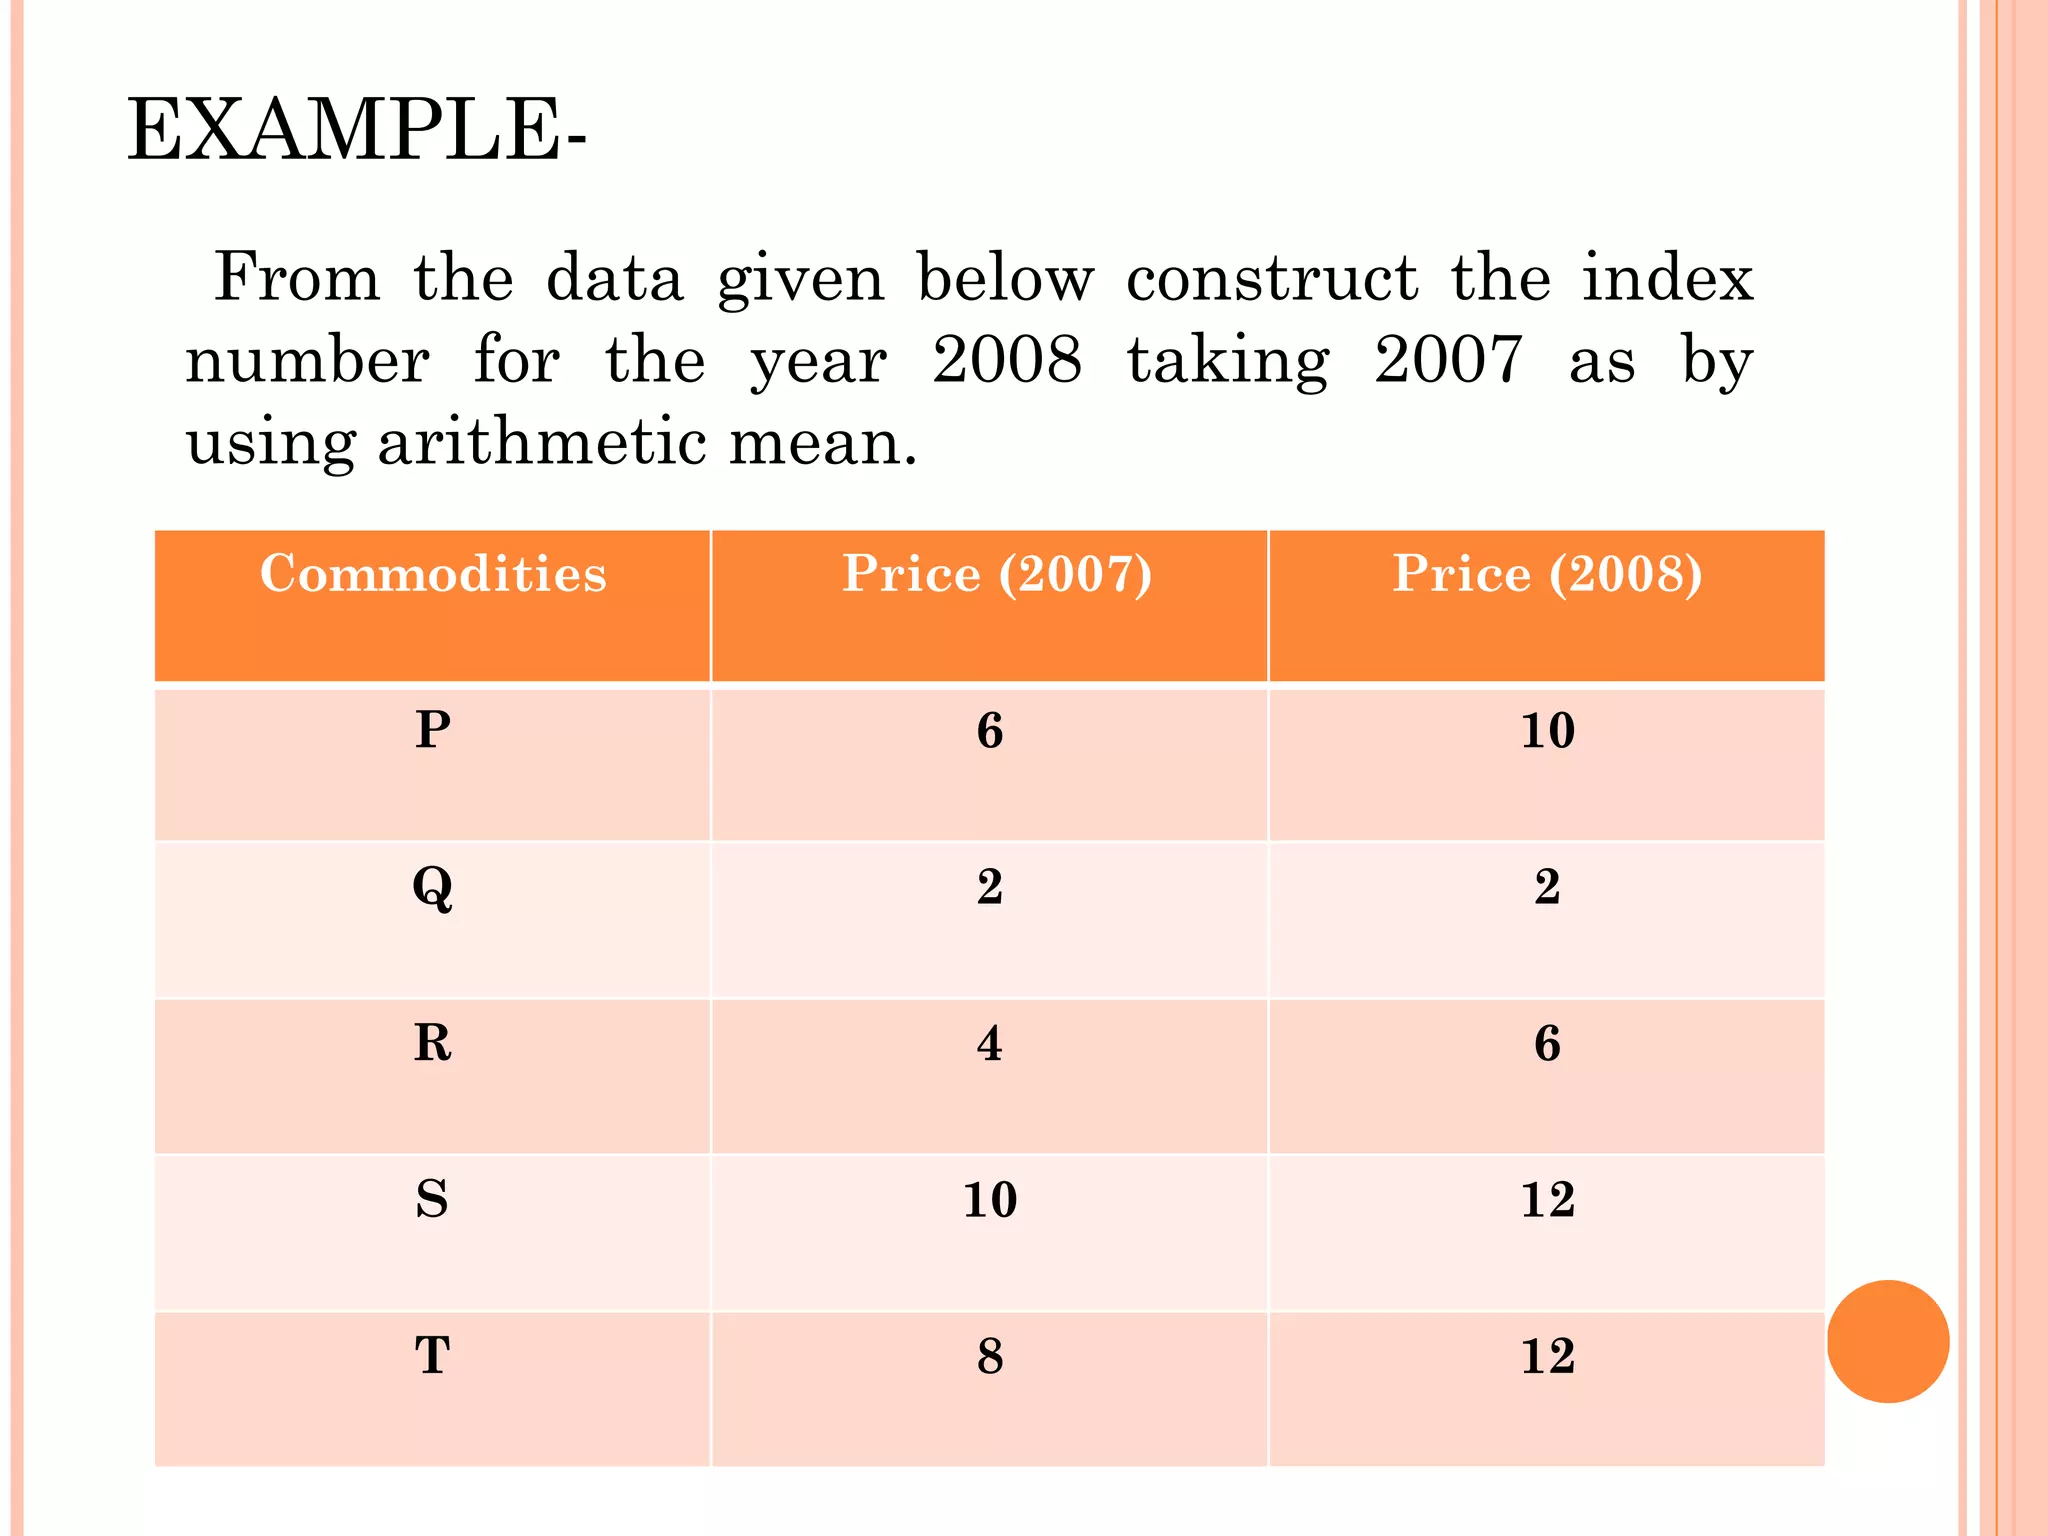
EXAMPLE- From thedata given below construct the index number for the year 2008 taking 2007 as by using arithmetic mean. Commodities Price (2007) Price (2008) P 6 10 Q 2 2 R 4 6 S 10 12 T 8 12
16.
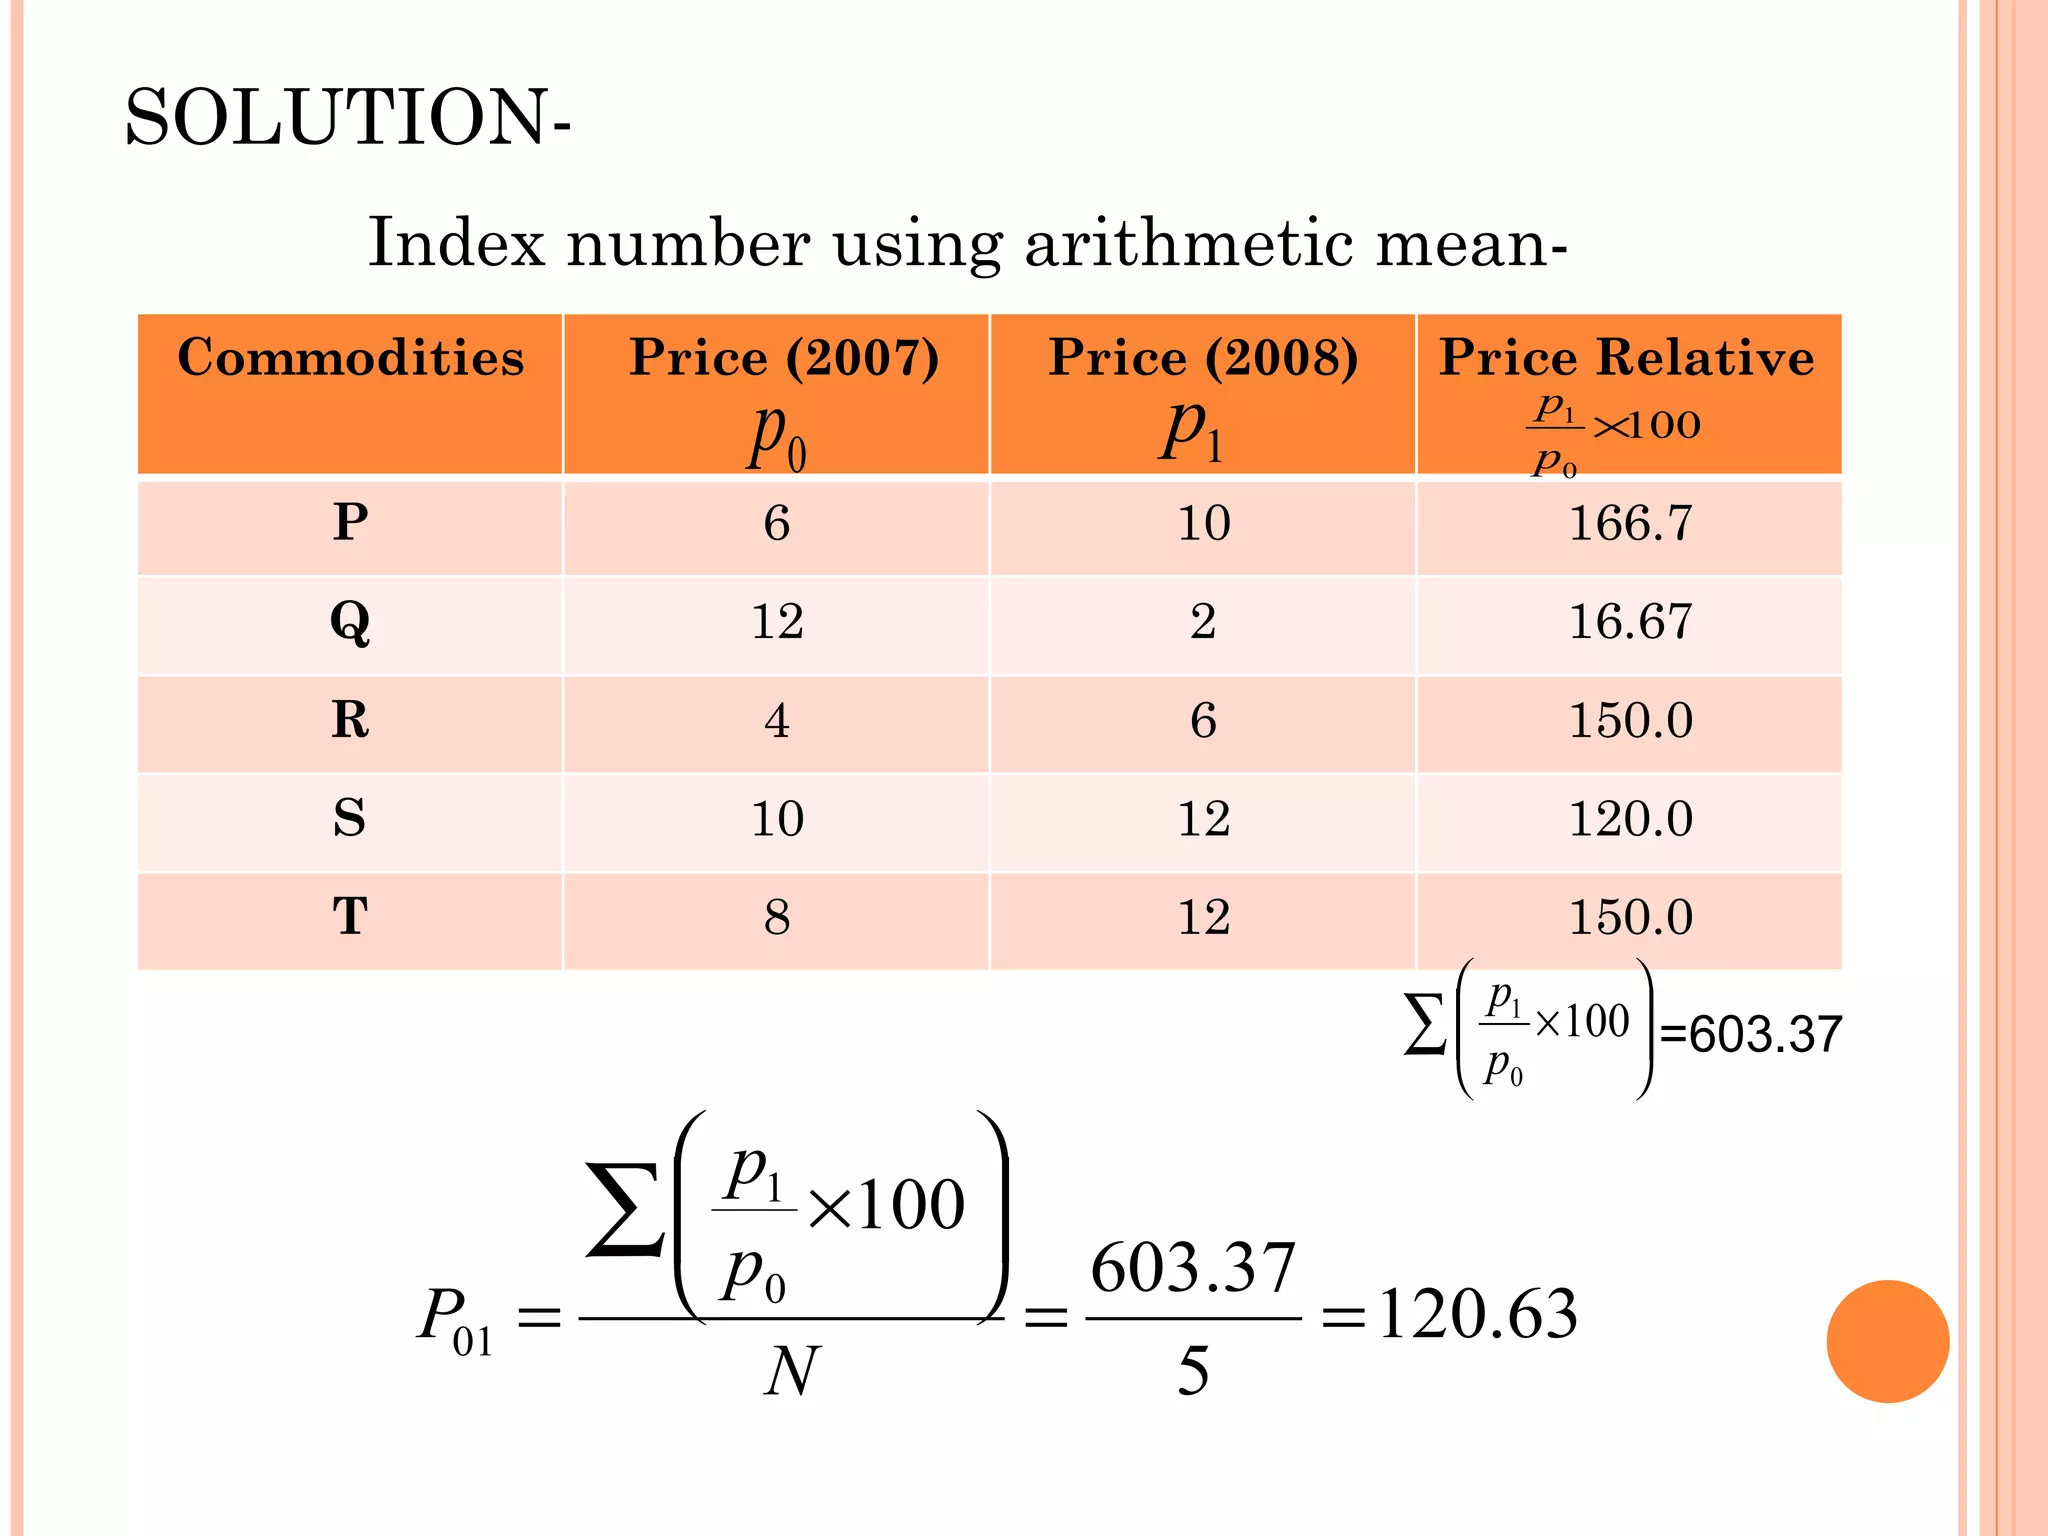
SOLUTION- Index numberusing arithmetic mean- =603.37 Commodities Price (2007) Price (2008) Price Relative P 6 10 166.7 Q 12 2 16.67 R 4 6 150.0 S 10 12 120.0 T 8 12 150.0
17.
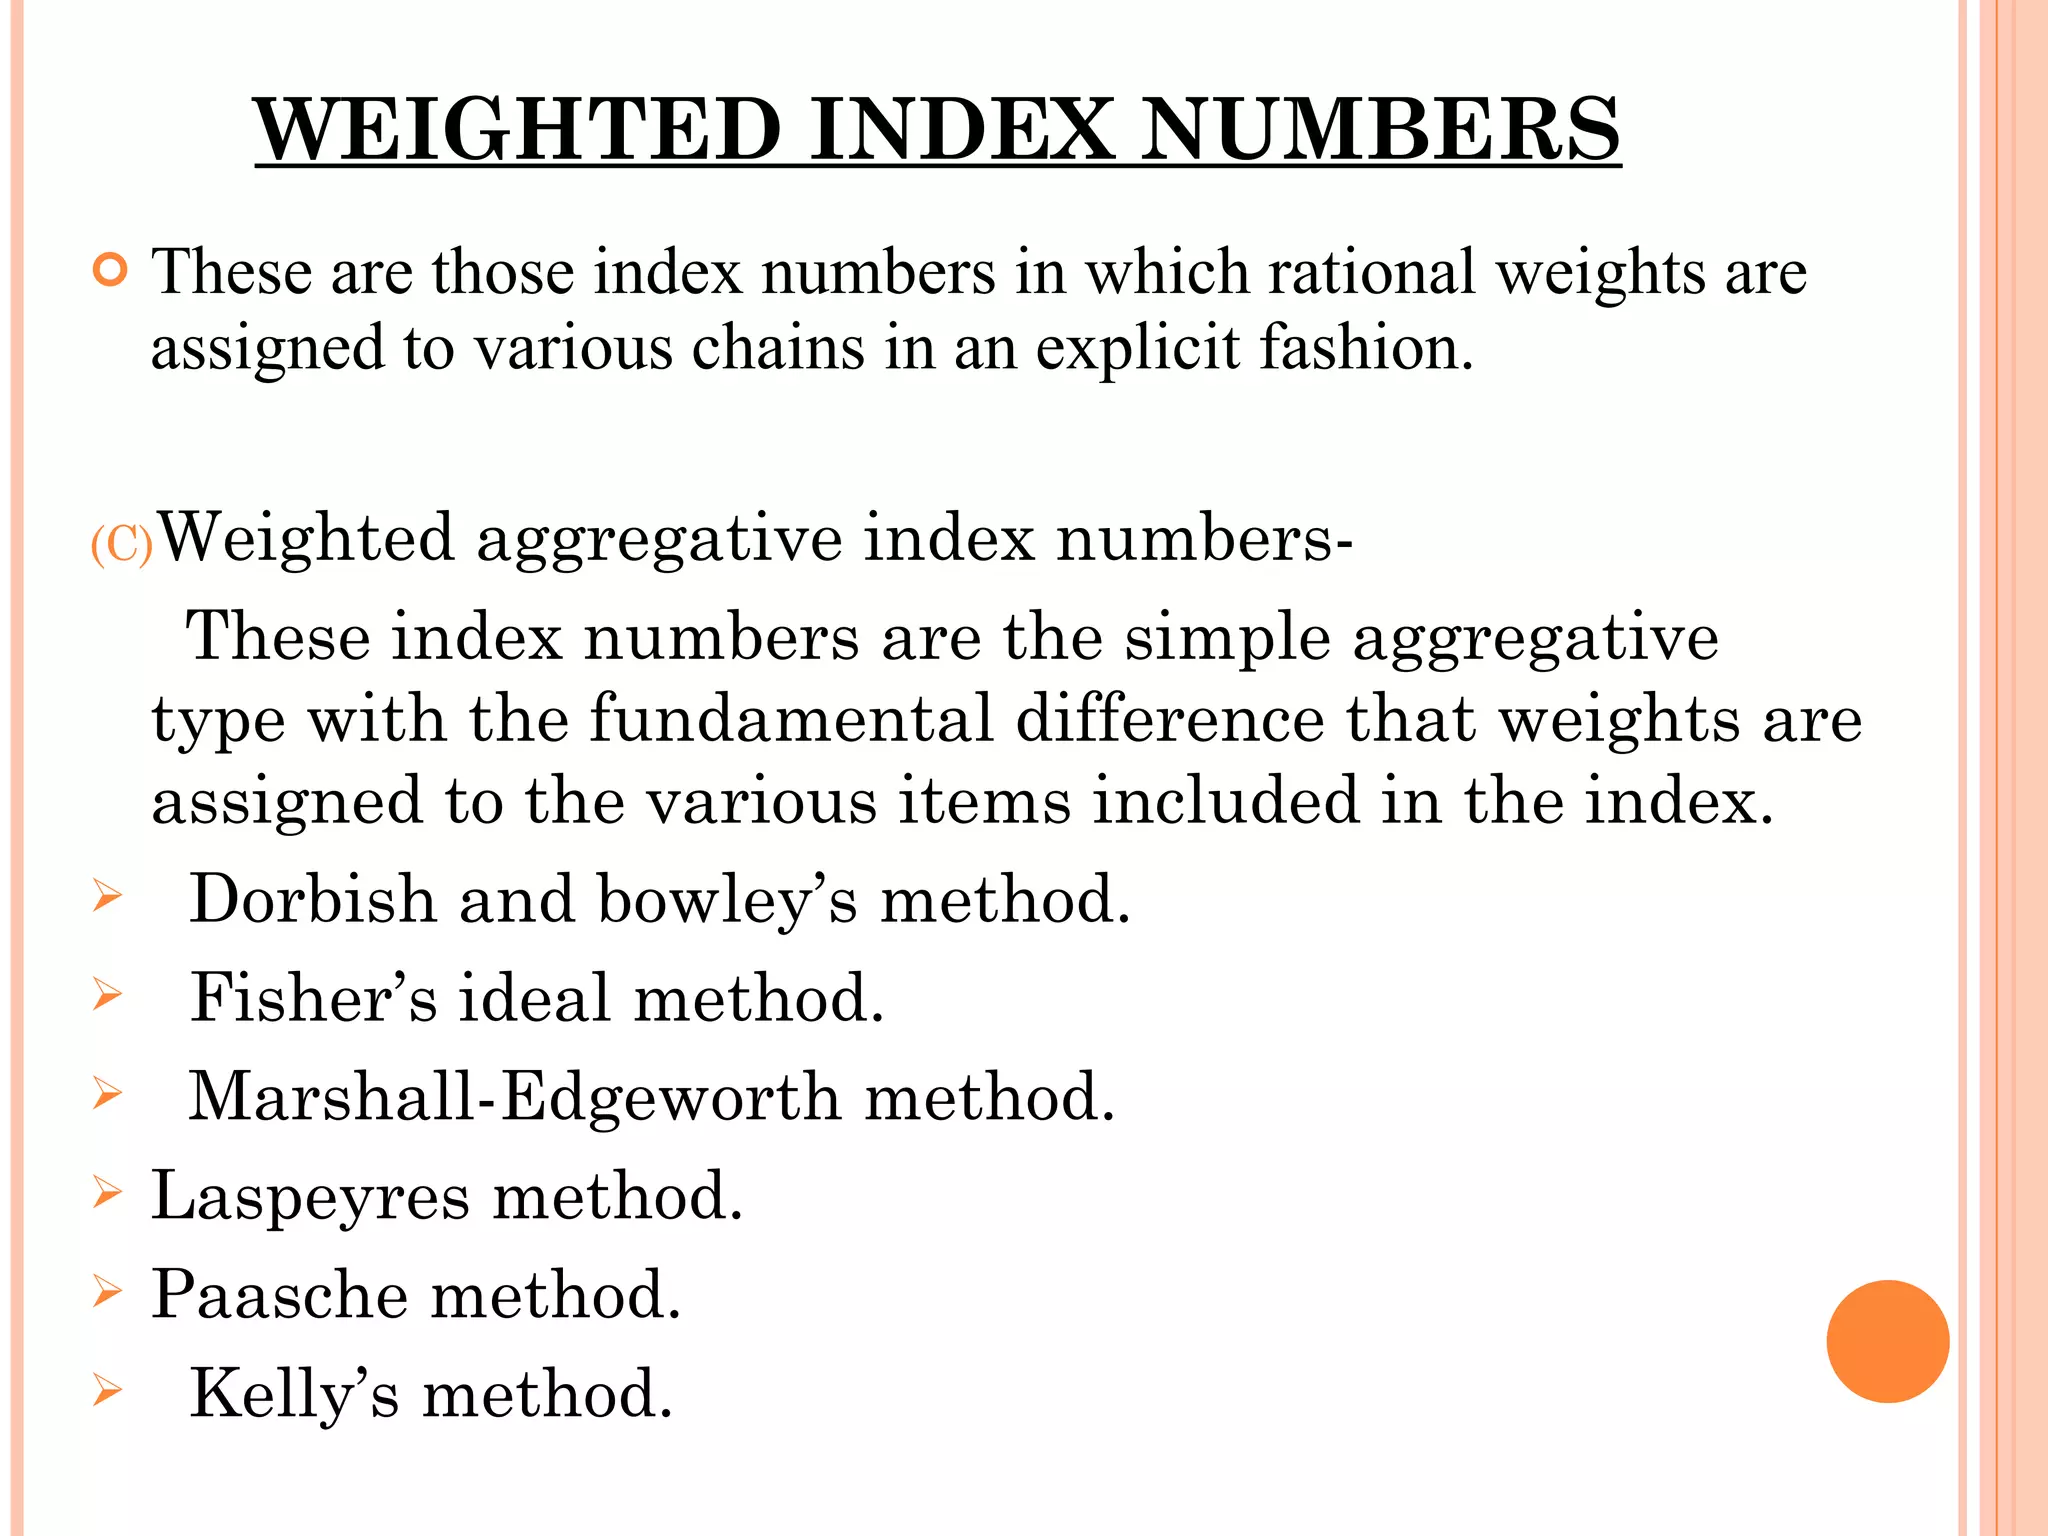
WEIGHTED INDEX NUMBERSThese are those index numbers in which rational weights are assigned to various chains in an explicit fashion. Weighted aggregative index numbers- These index numbers are the simple aggregative type with the fundamental difference that weights are assigned to the various items included in the index. Dorbish and bowley’s method. Fisher’s ideal method. Marshall-Edgeworth method. Laspeyres method. Paasche method. Kelly’s method.
18.
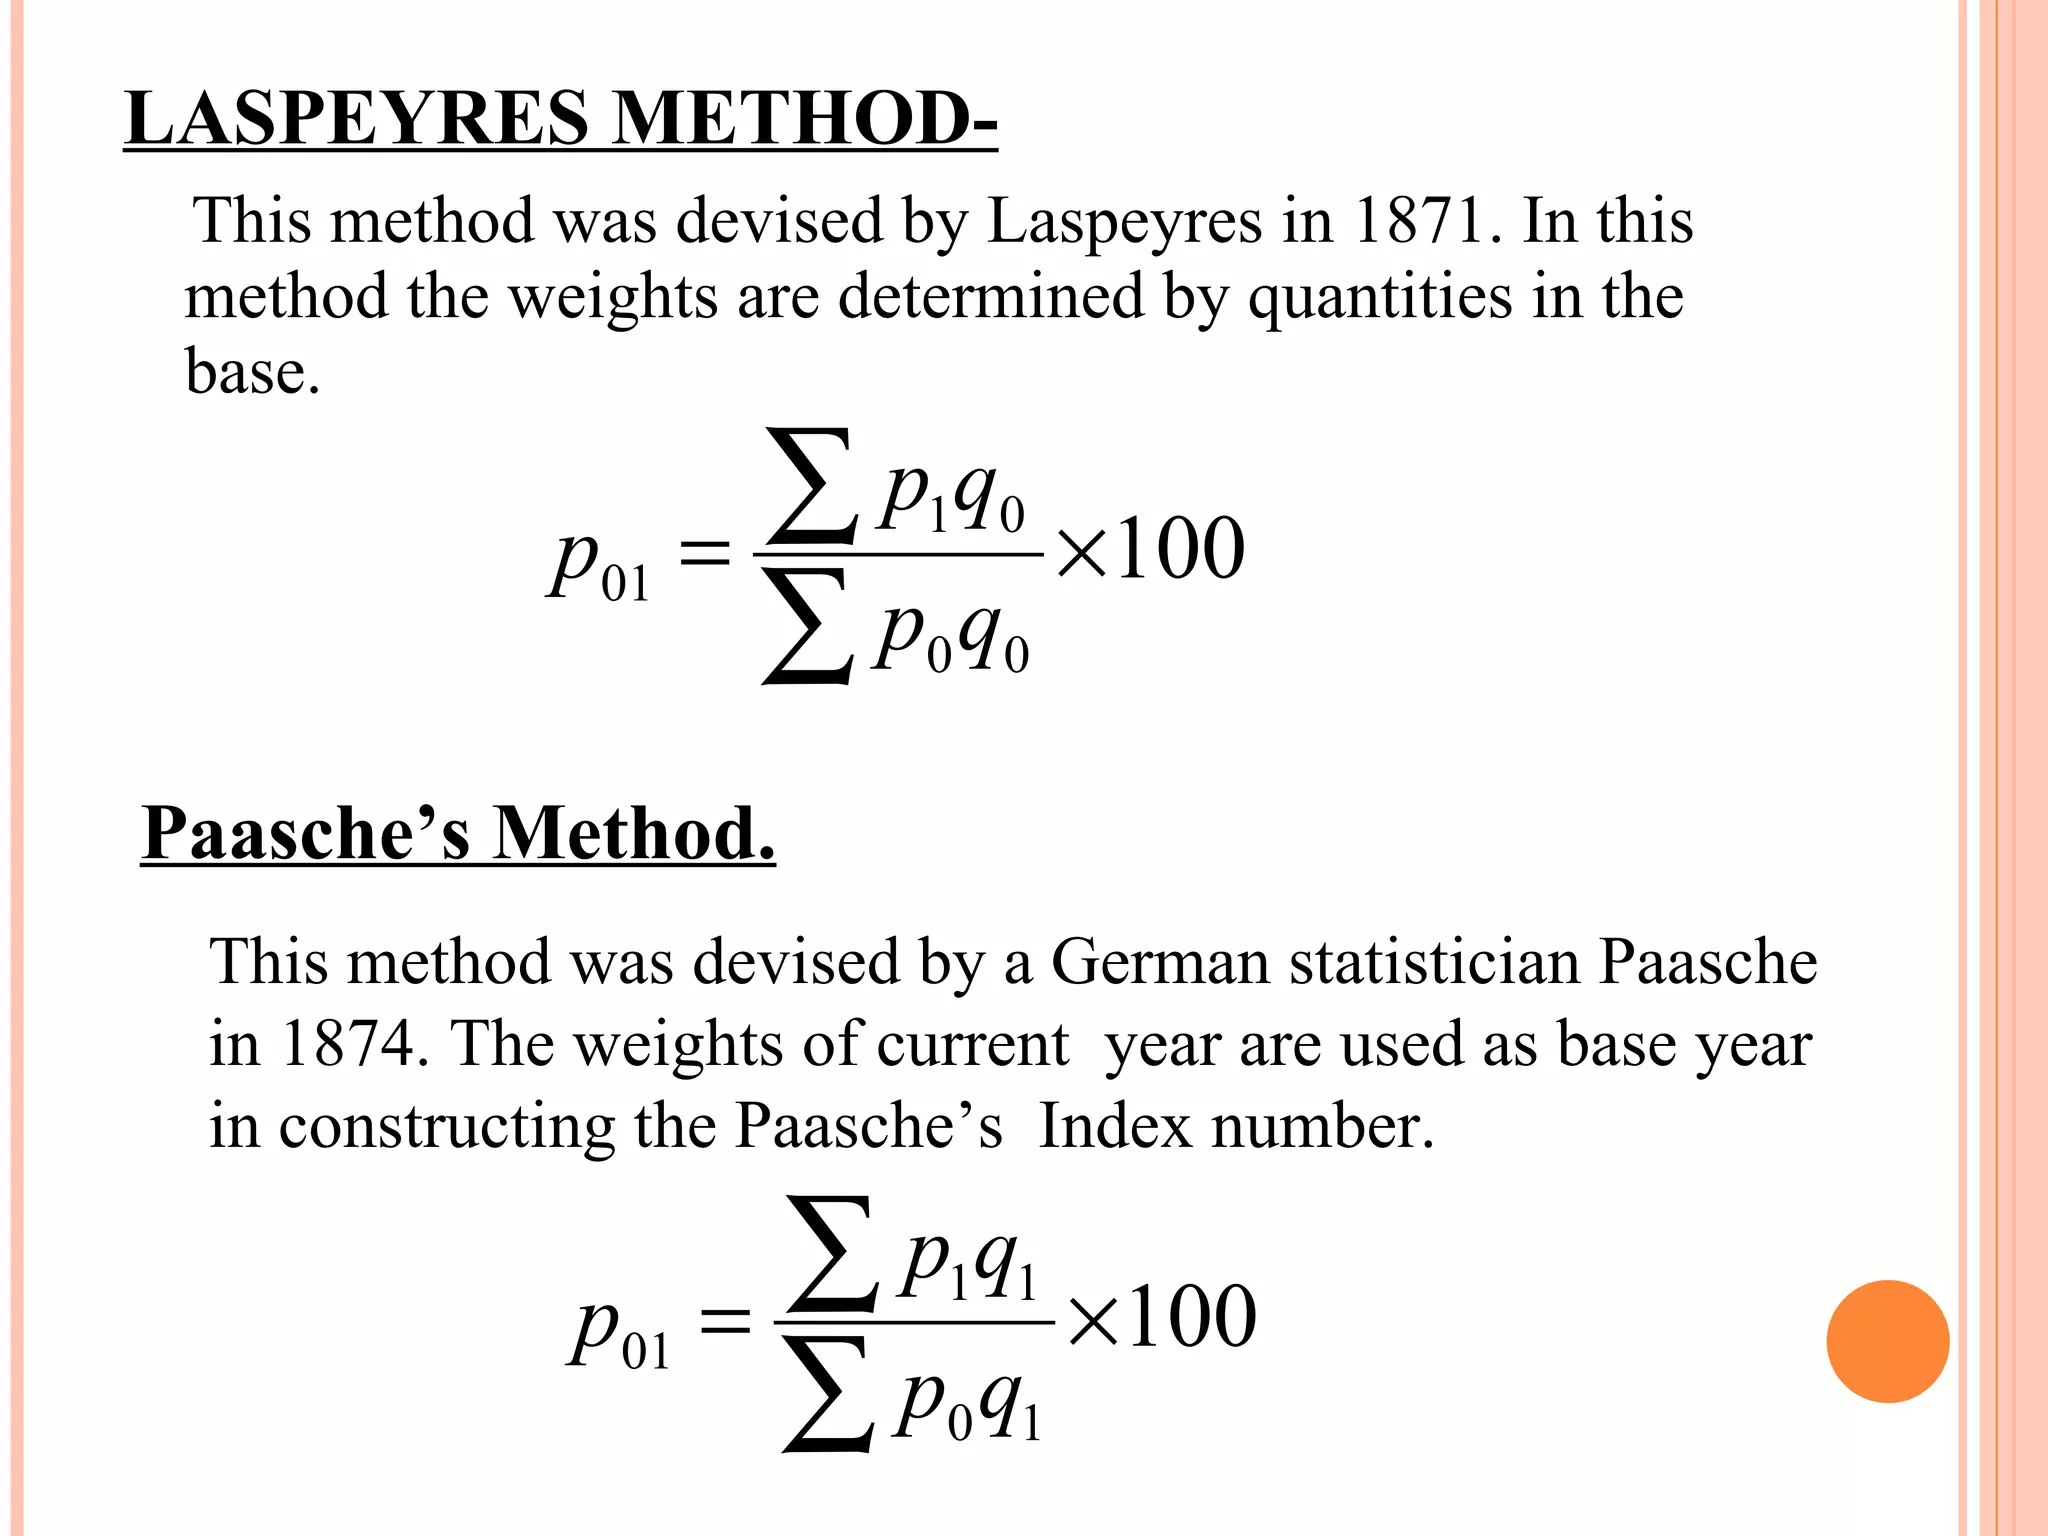
LASPEYRES METHOD- Thismethod was devised by Laspeyres in 1871. In this method the weights are determined by quantities in the base. Paasche’s Method. This method was devised by a German statistician Paasche in 1874. The weights of current year are used as base year in constructing the Paasche’s Index number.
19.
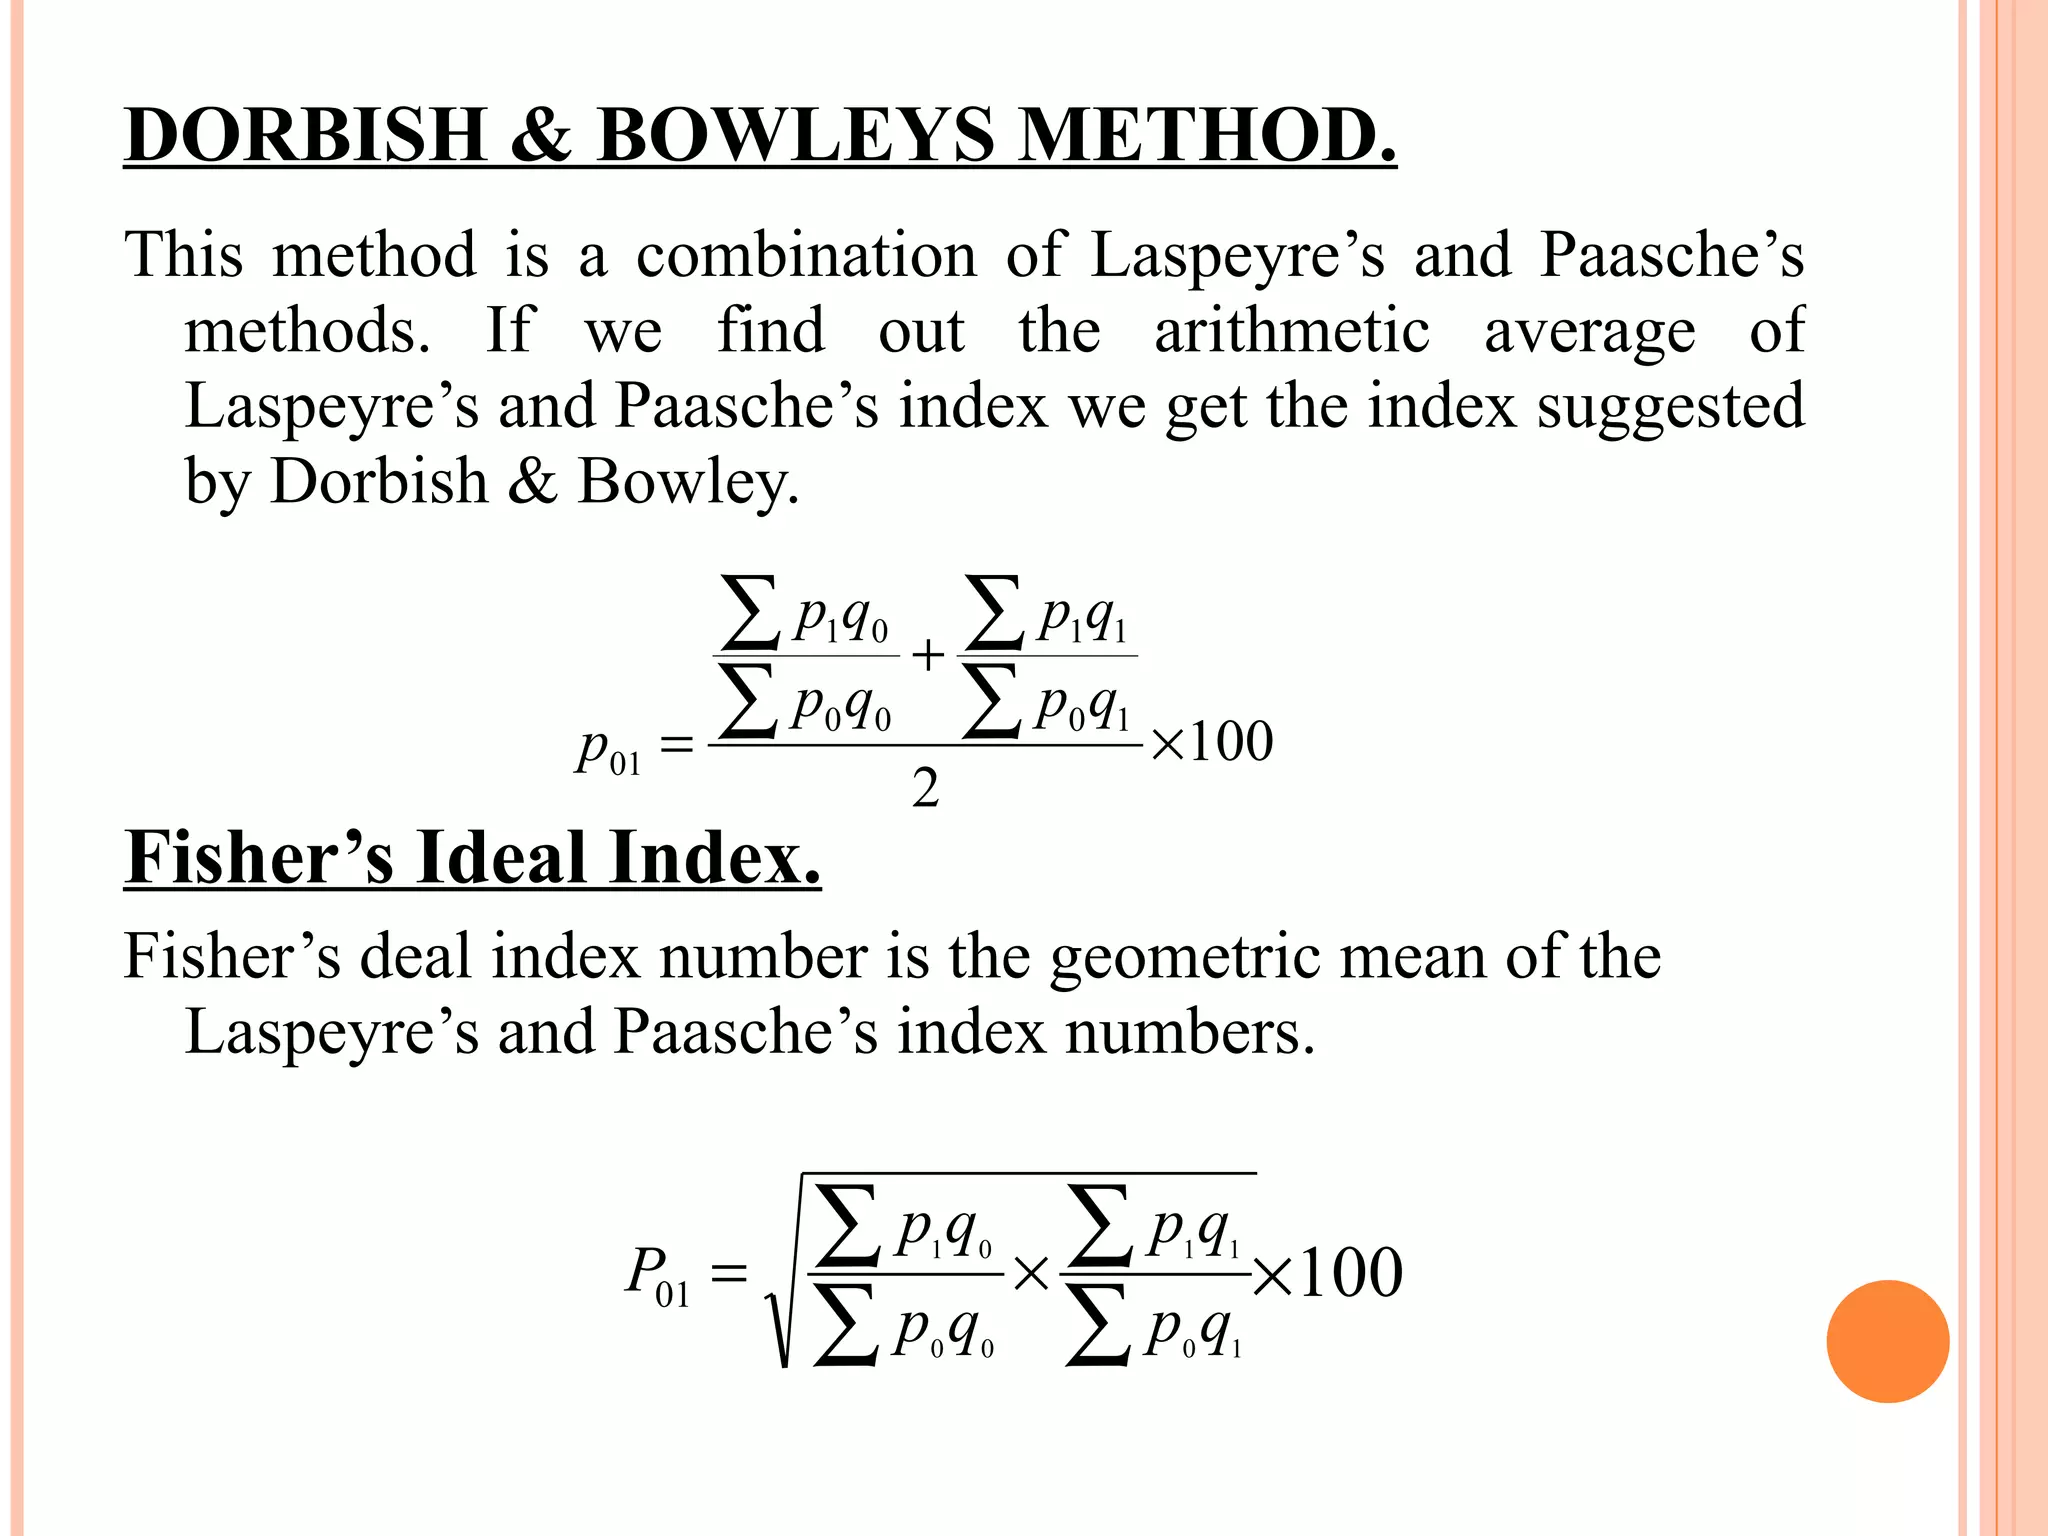
DORBISH & BOWLEYSMETHOD. This method is a combination of Laspeyre’s and Paasche’s methods. If we find out the arithmetic average of Laspeyre’s and Paasche’s index we get the index suggested by Dorbish & Bowley. Fisher’s Ideal Index. Fisher’s deal index number is the geometric mean of the Laspeyre’s and Paasche’s index numbers.
20.
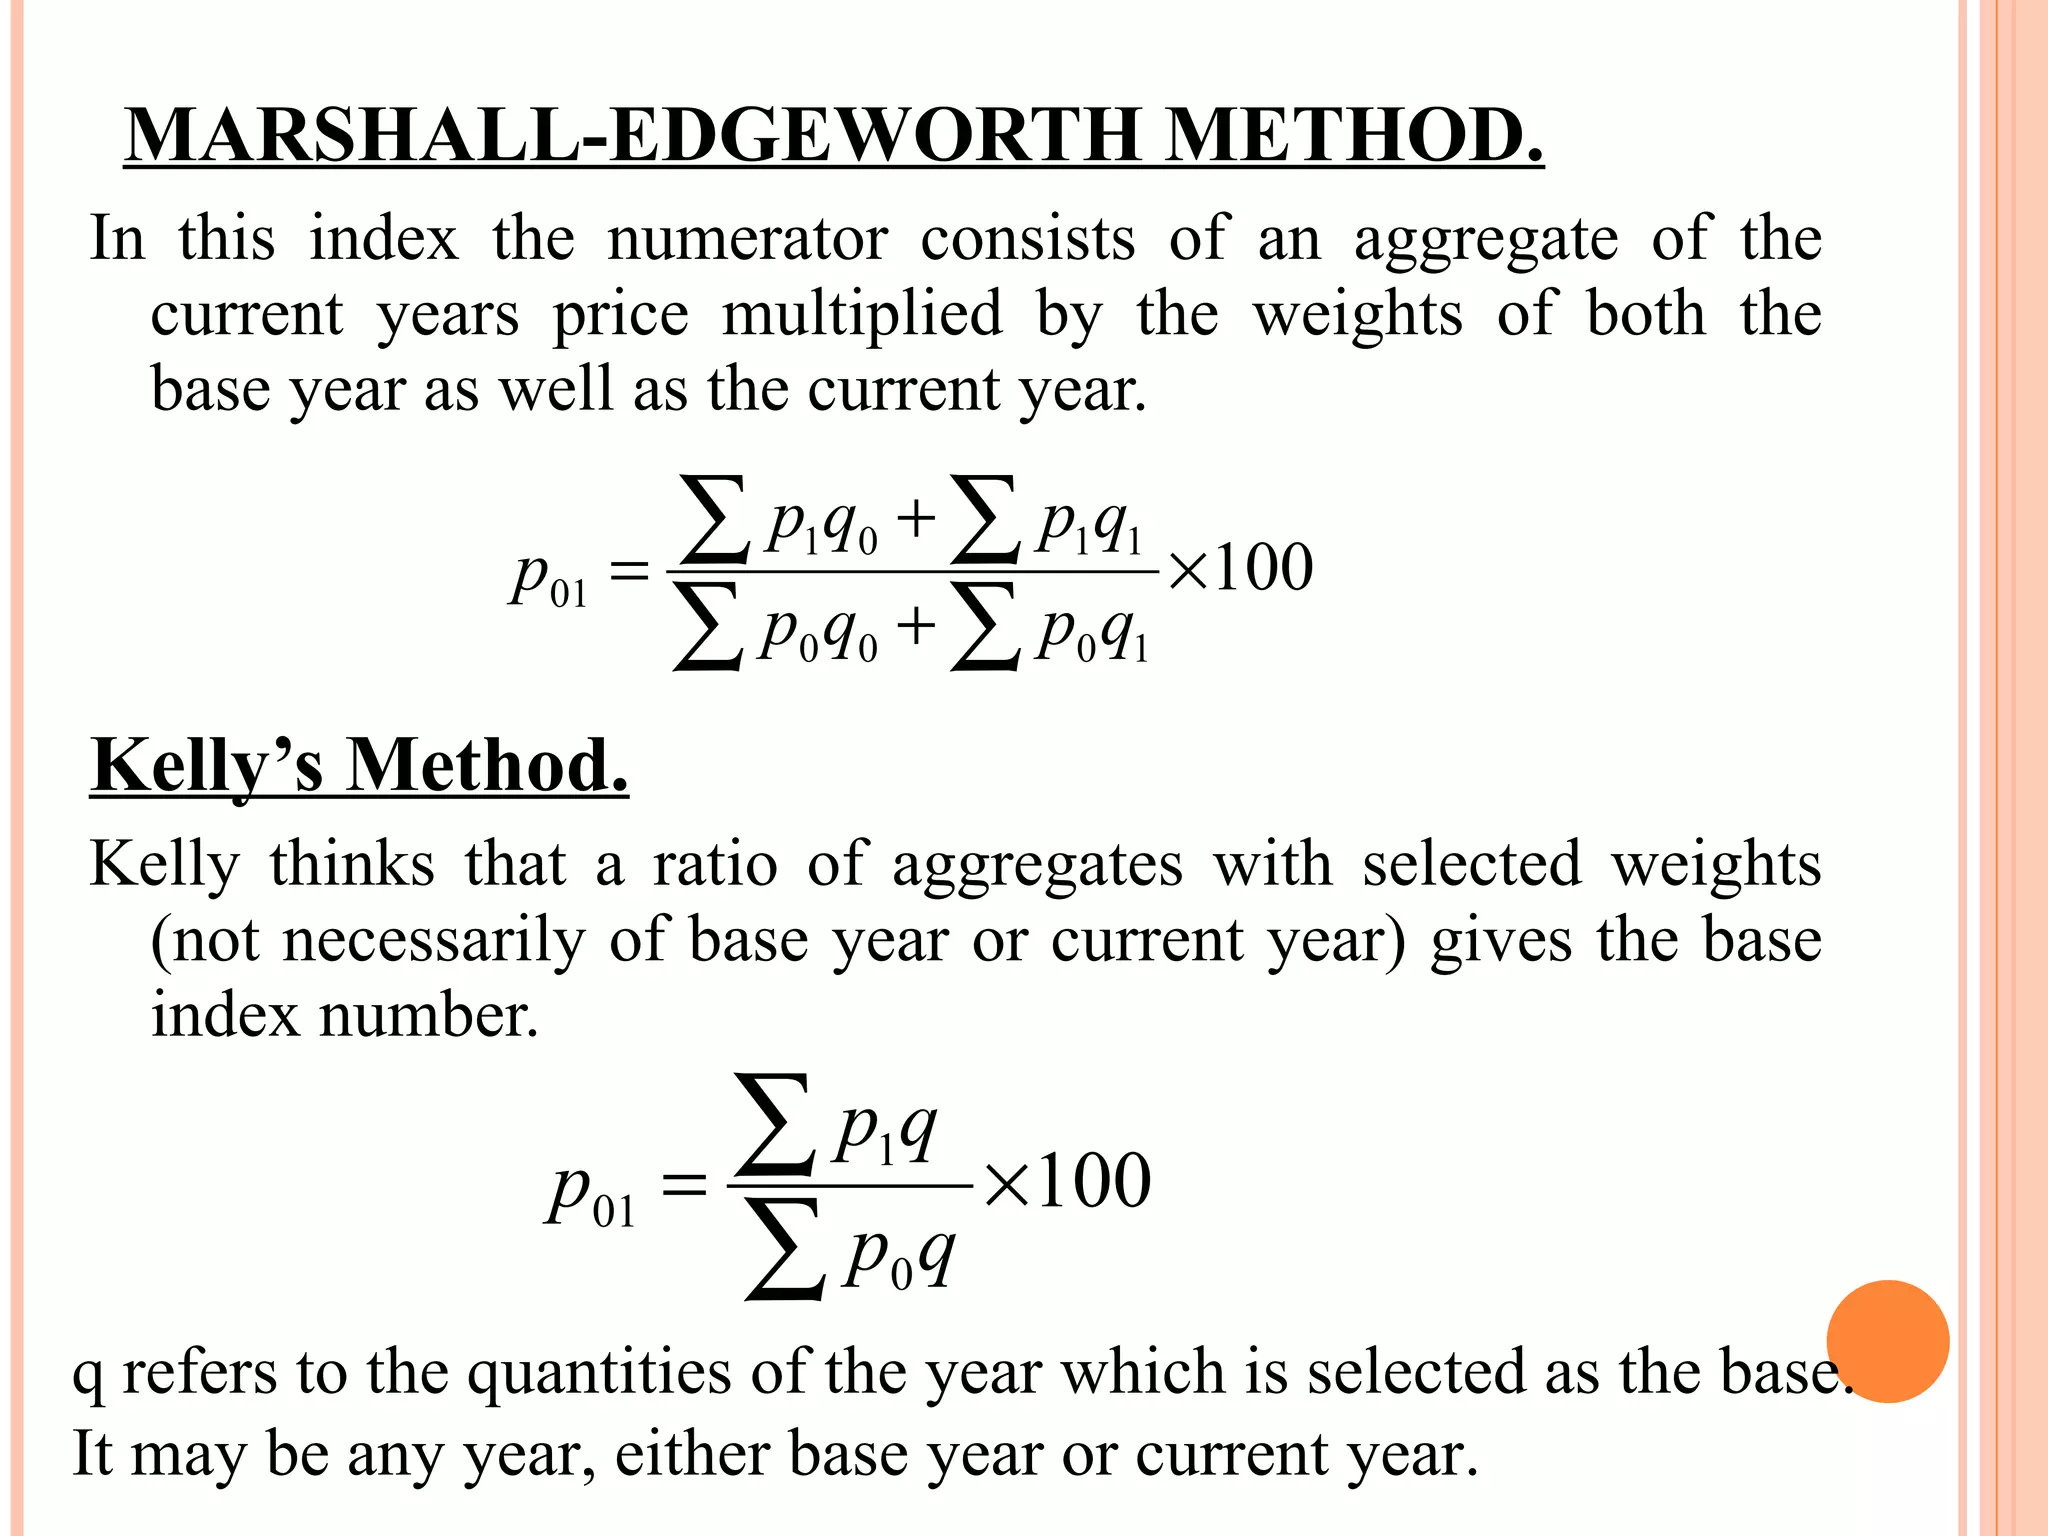
MARSHALL-EDGEWORTH METHOD. Inthis index the numerator consists of an aggregate of the current years price multiplied by the weights of both the base year as well as the current year. Kelly’s Method. Kelly thinks that a ratio of aggregates with selected weights (not necessarily of base year or current year) gives the base index number. q refers to the quantities of the year which is selected as the base. It may be any year, either base year or current year.
21.
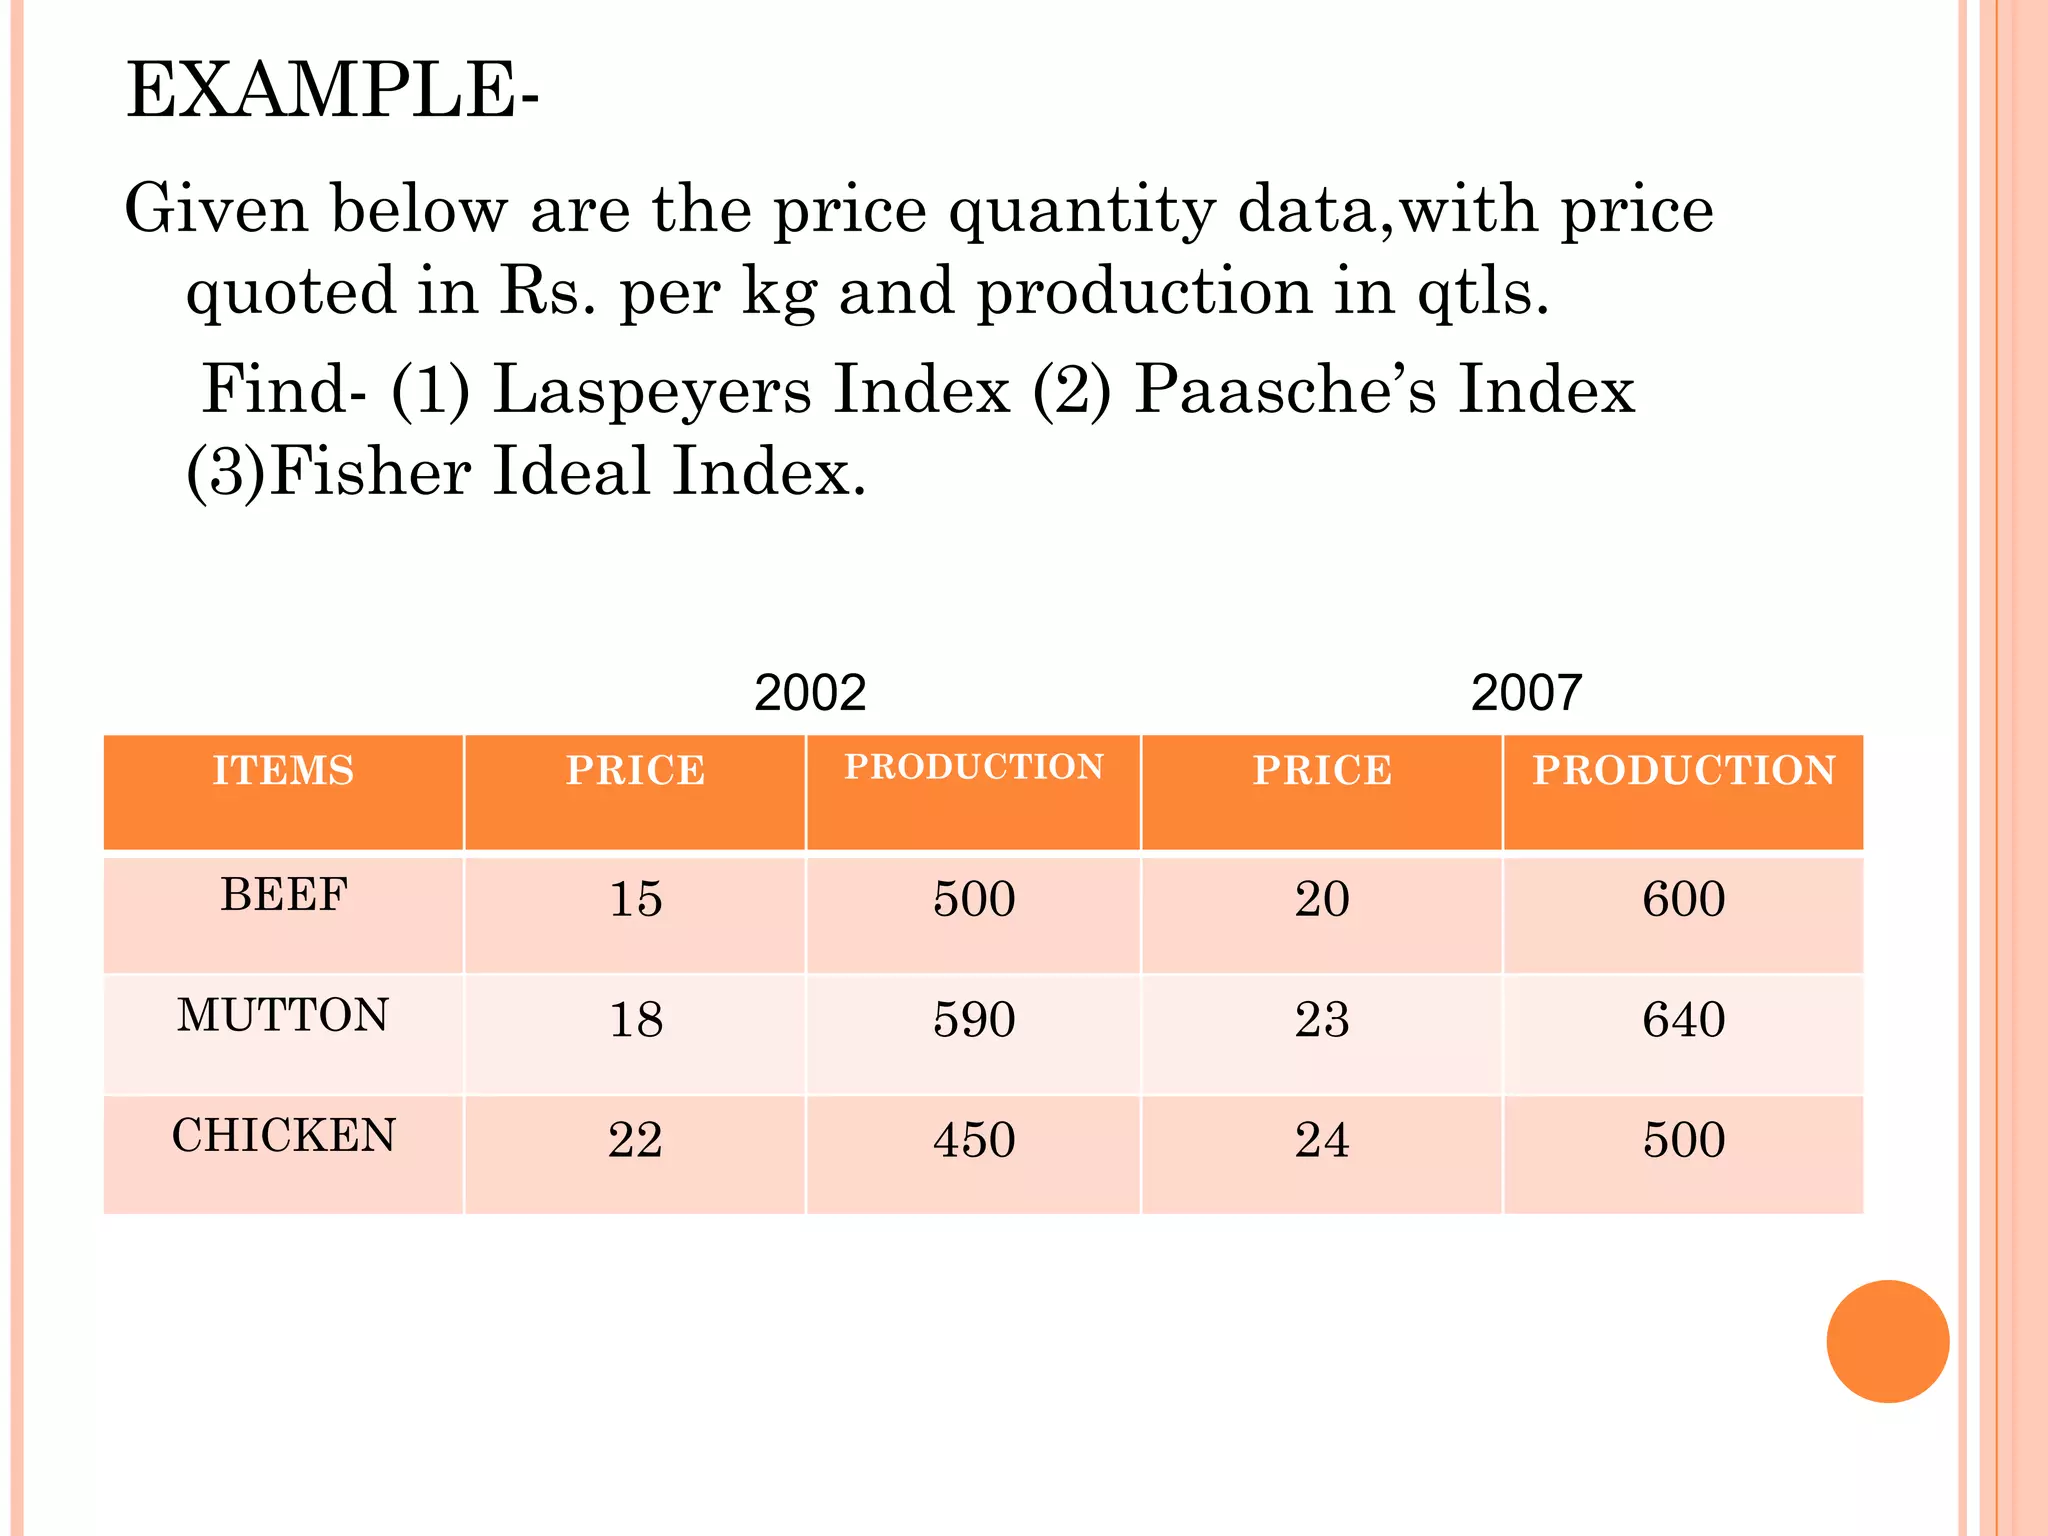
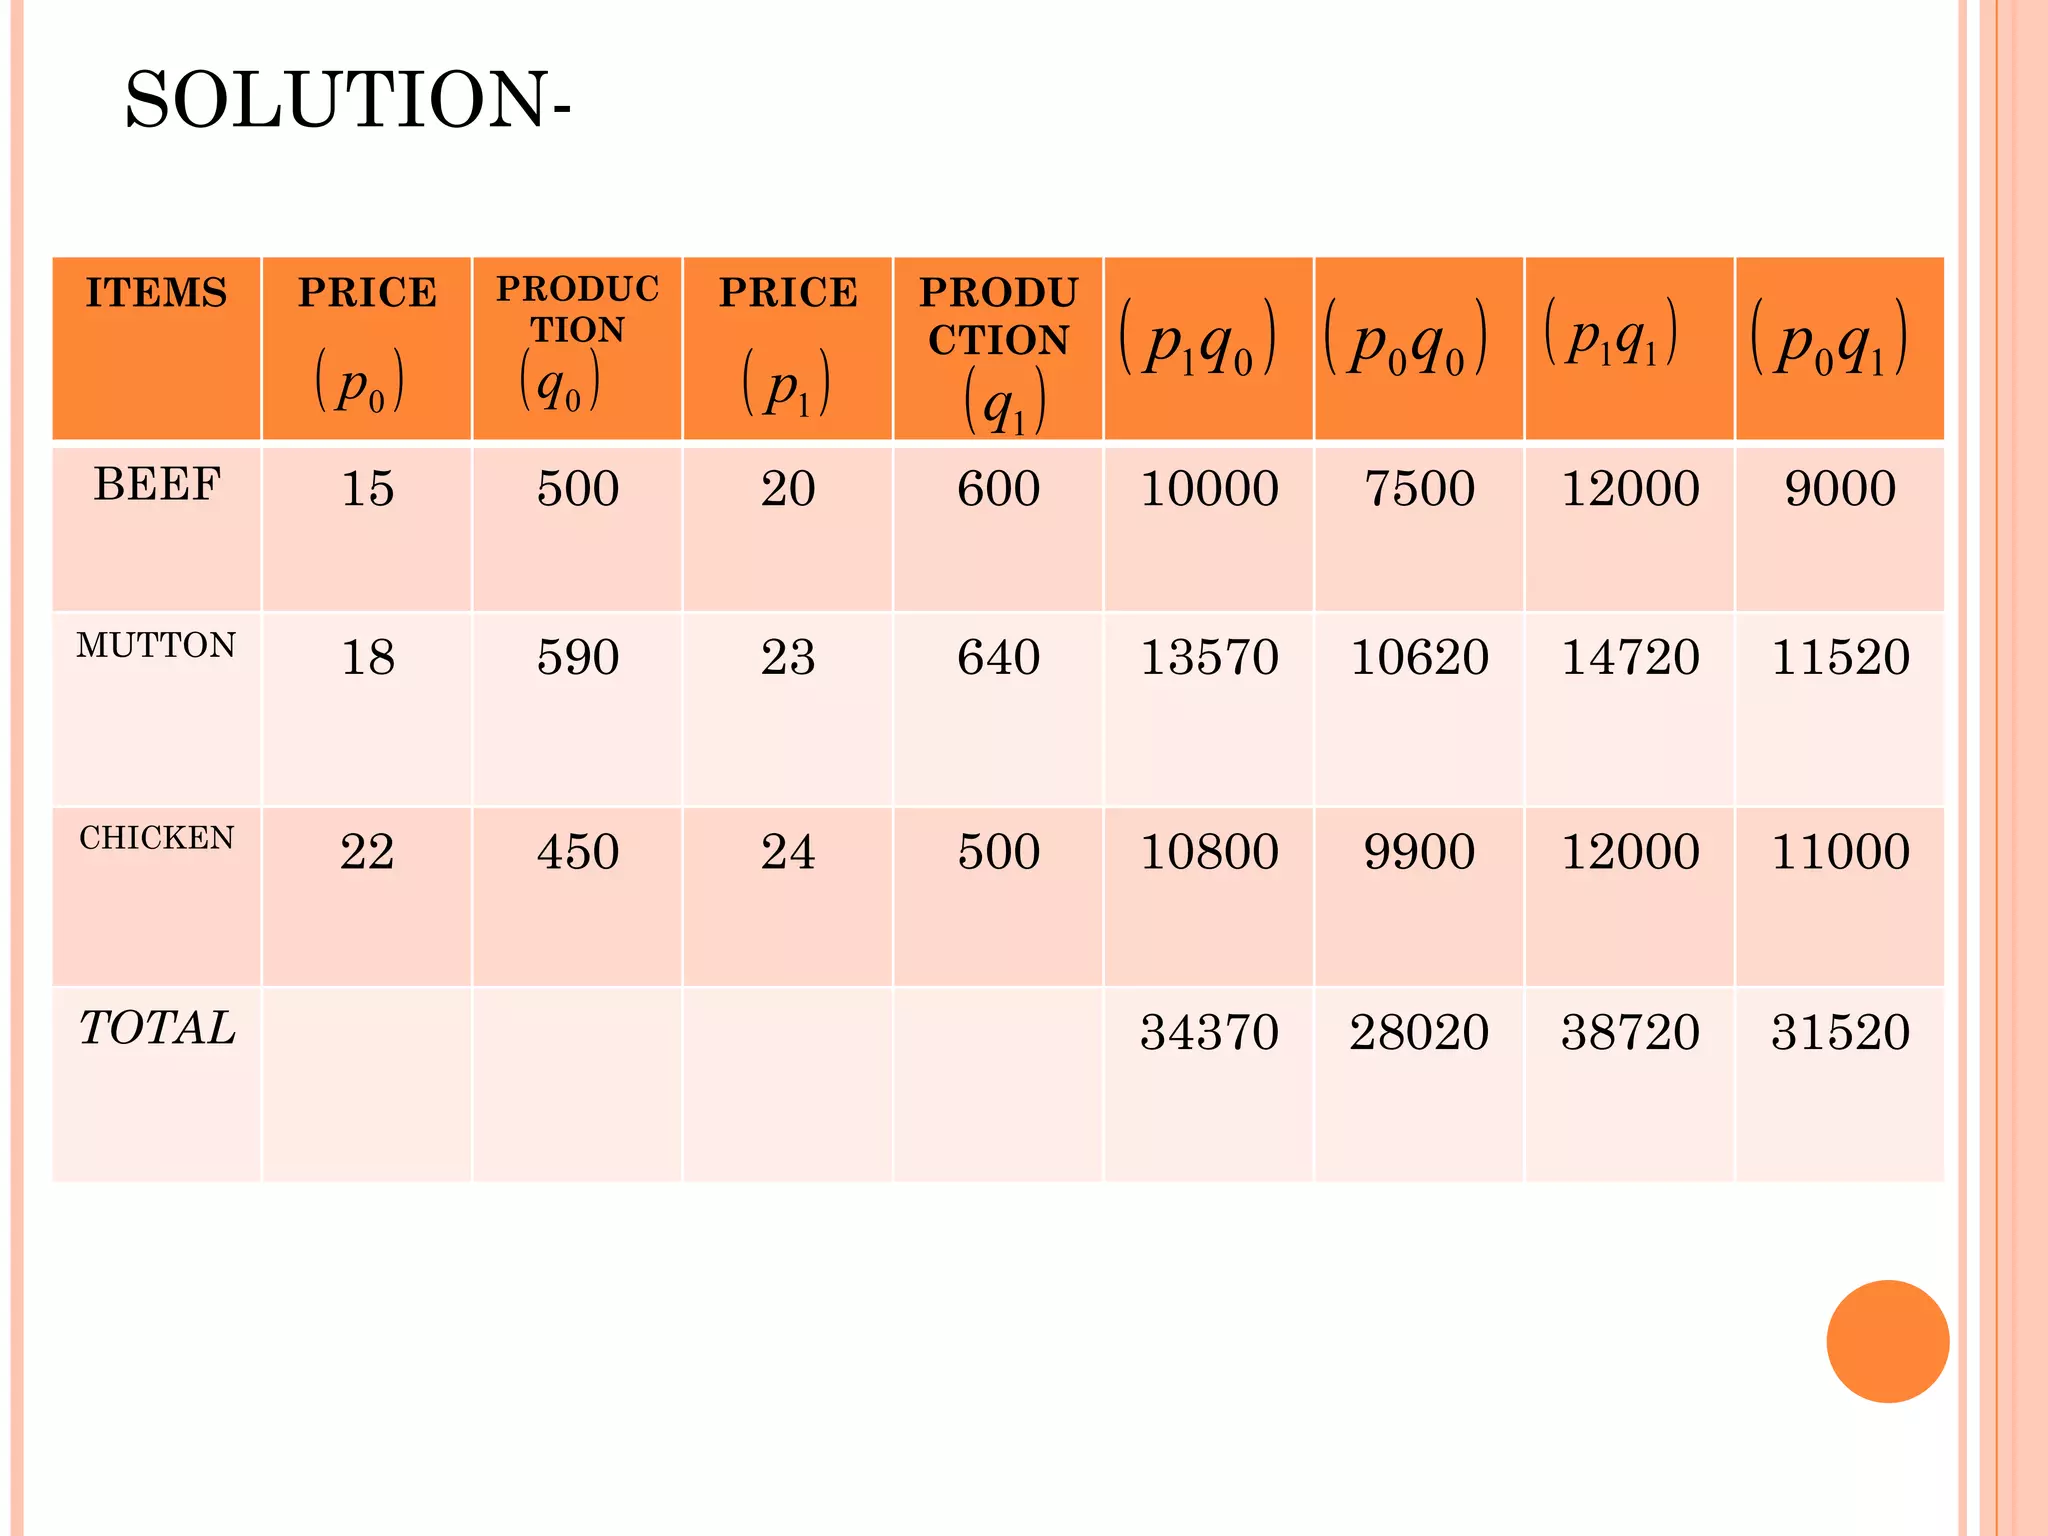
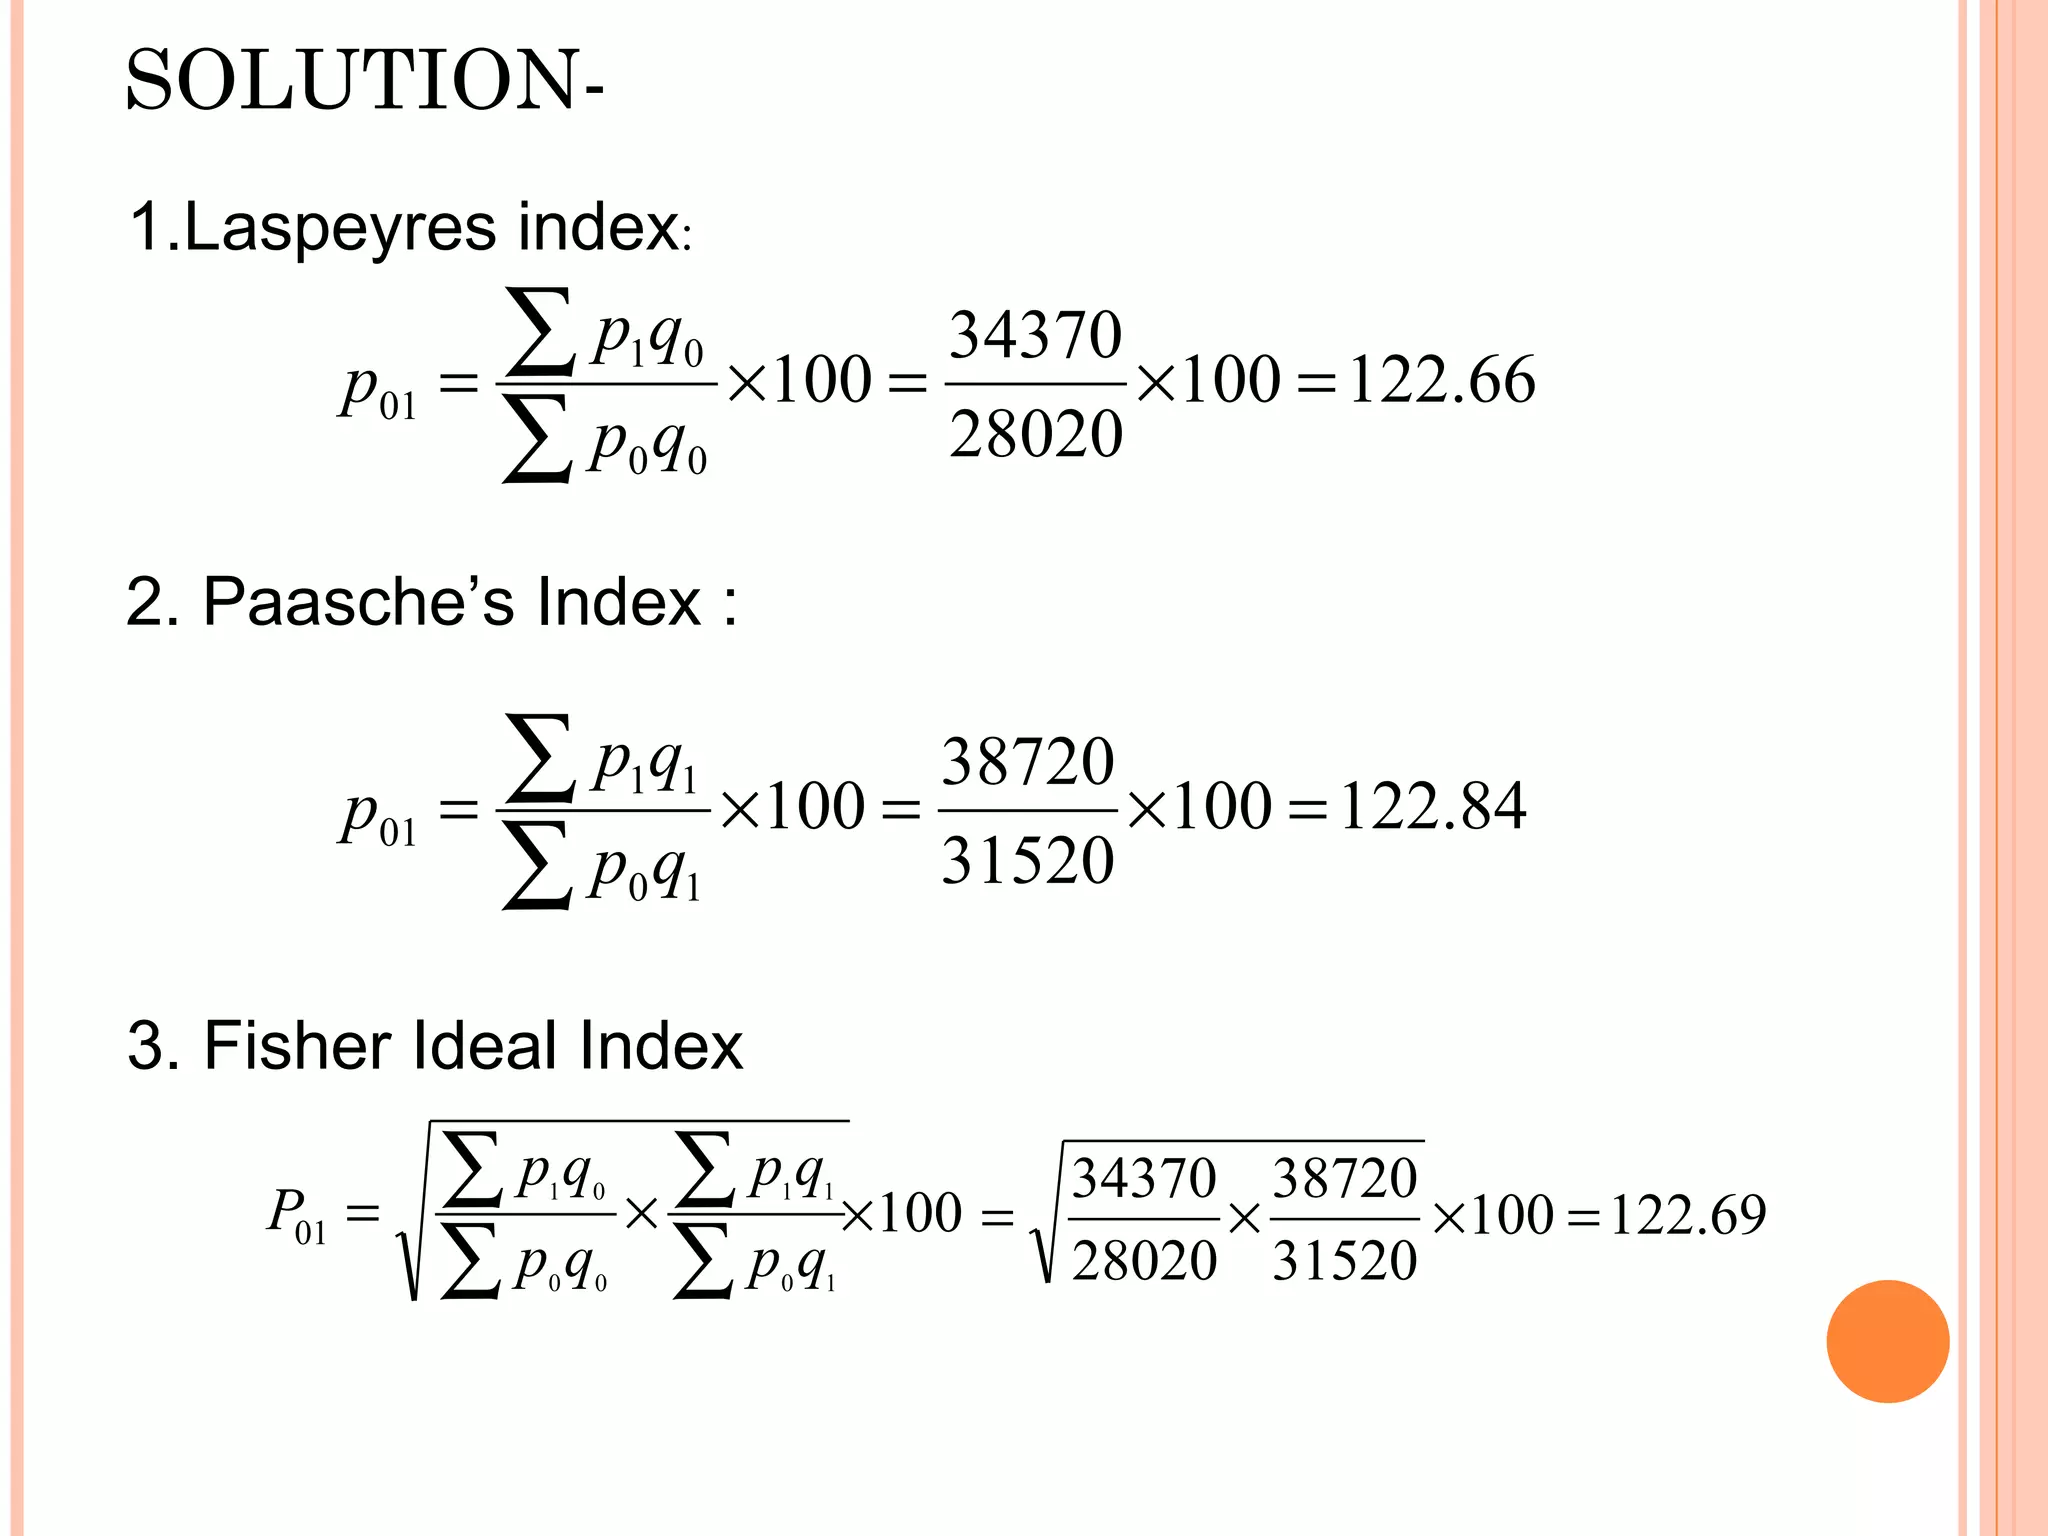
EXAMPLE- Given beloware the price quantity data,with price quoted in Rs. per kg and production in qtls. Find- (1) Laspeyers Index (2) Paasche’s Index (3)Fisher Ideal Index. 2002 2007 ITEMS PRICE PRODUCTION PRICE PRODUCTION BEEF 15 500 20 600 MUTTON 18 590 23 640 CHICKEN 22 450 24 500
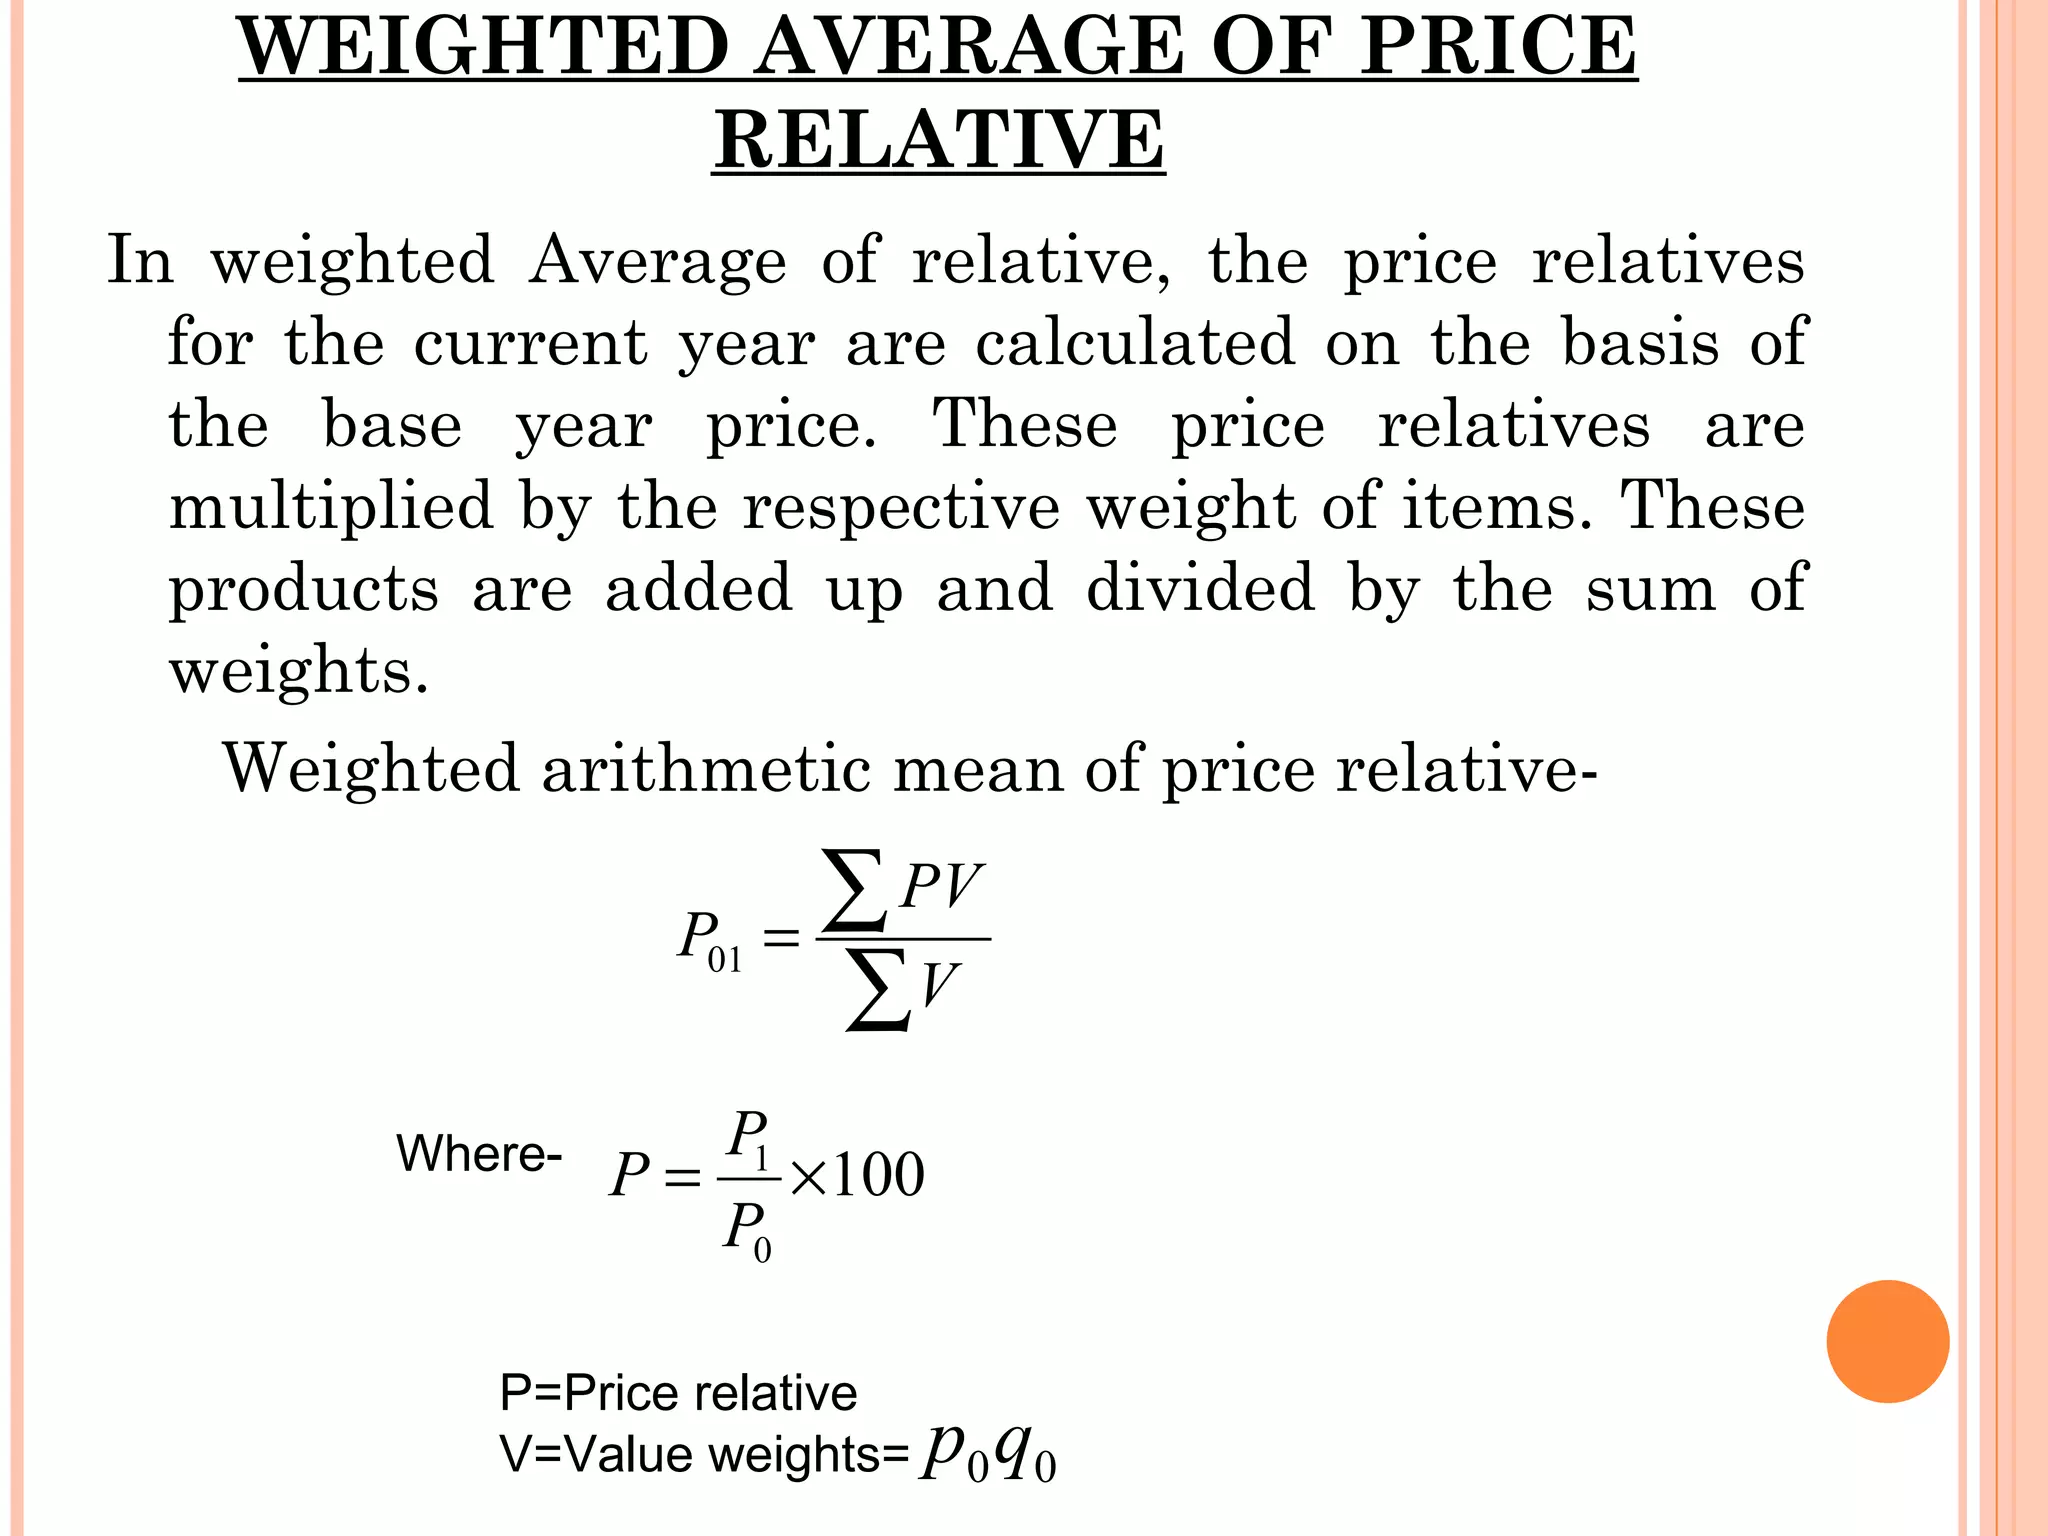
WEIGHTED AVERAGE OFPRICE RELATIVE In weighted Average of relative, the price relatives for the current year are calculated on the basis of the base year price. These price relatives are multiplied by the respective weight of items. These products are added up and divided by the sum of weights. Weighted arithmetic mean of price relative- Where- P=Price relative V=Value weights=
25.
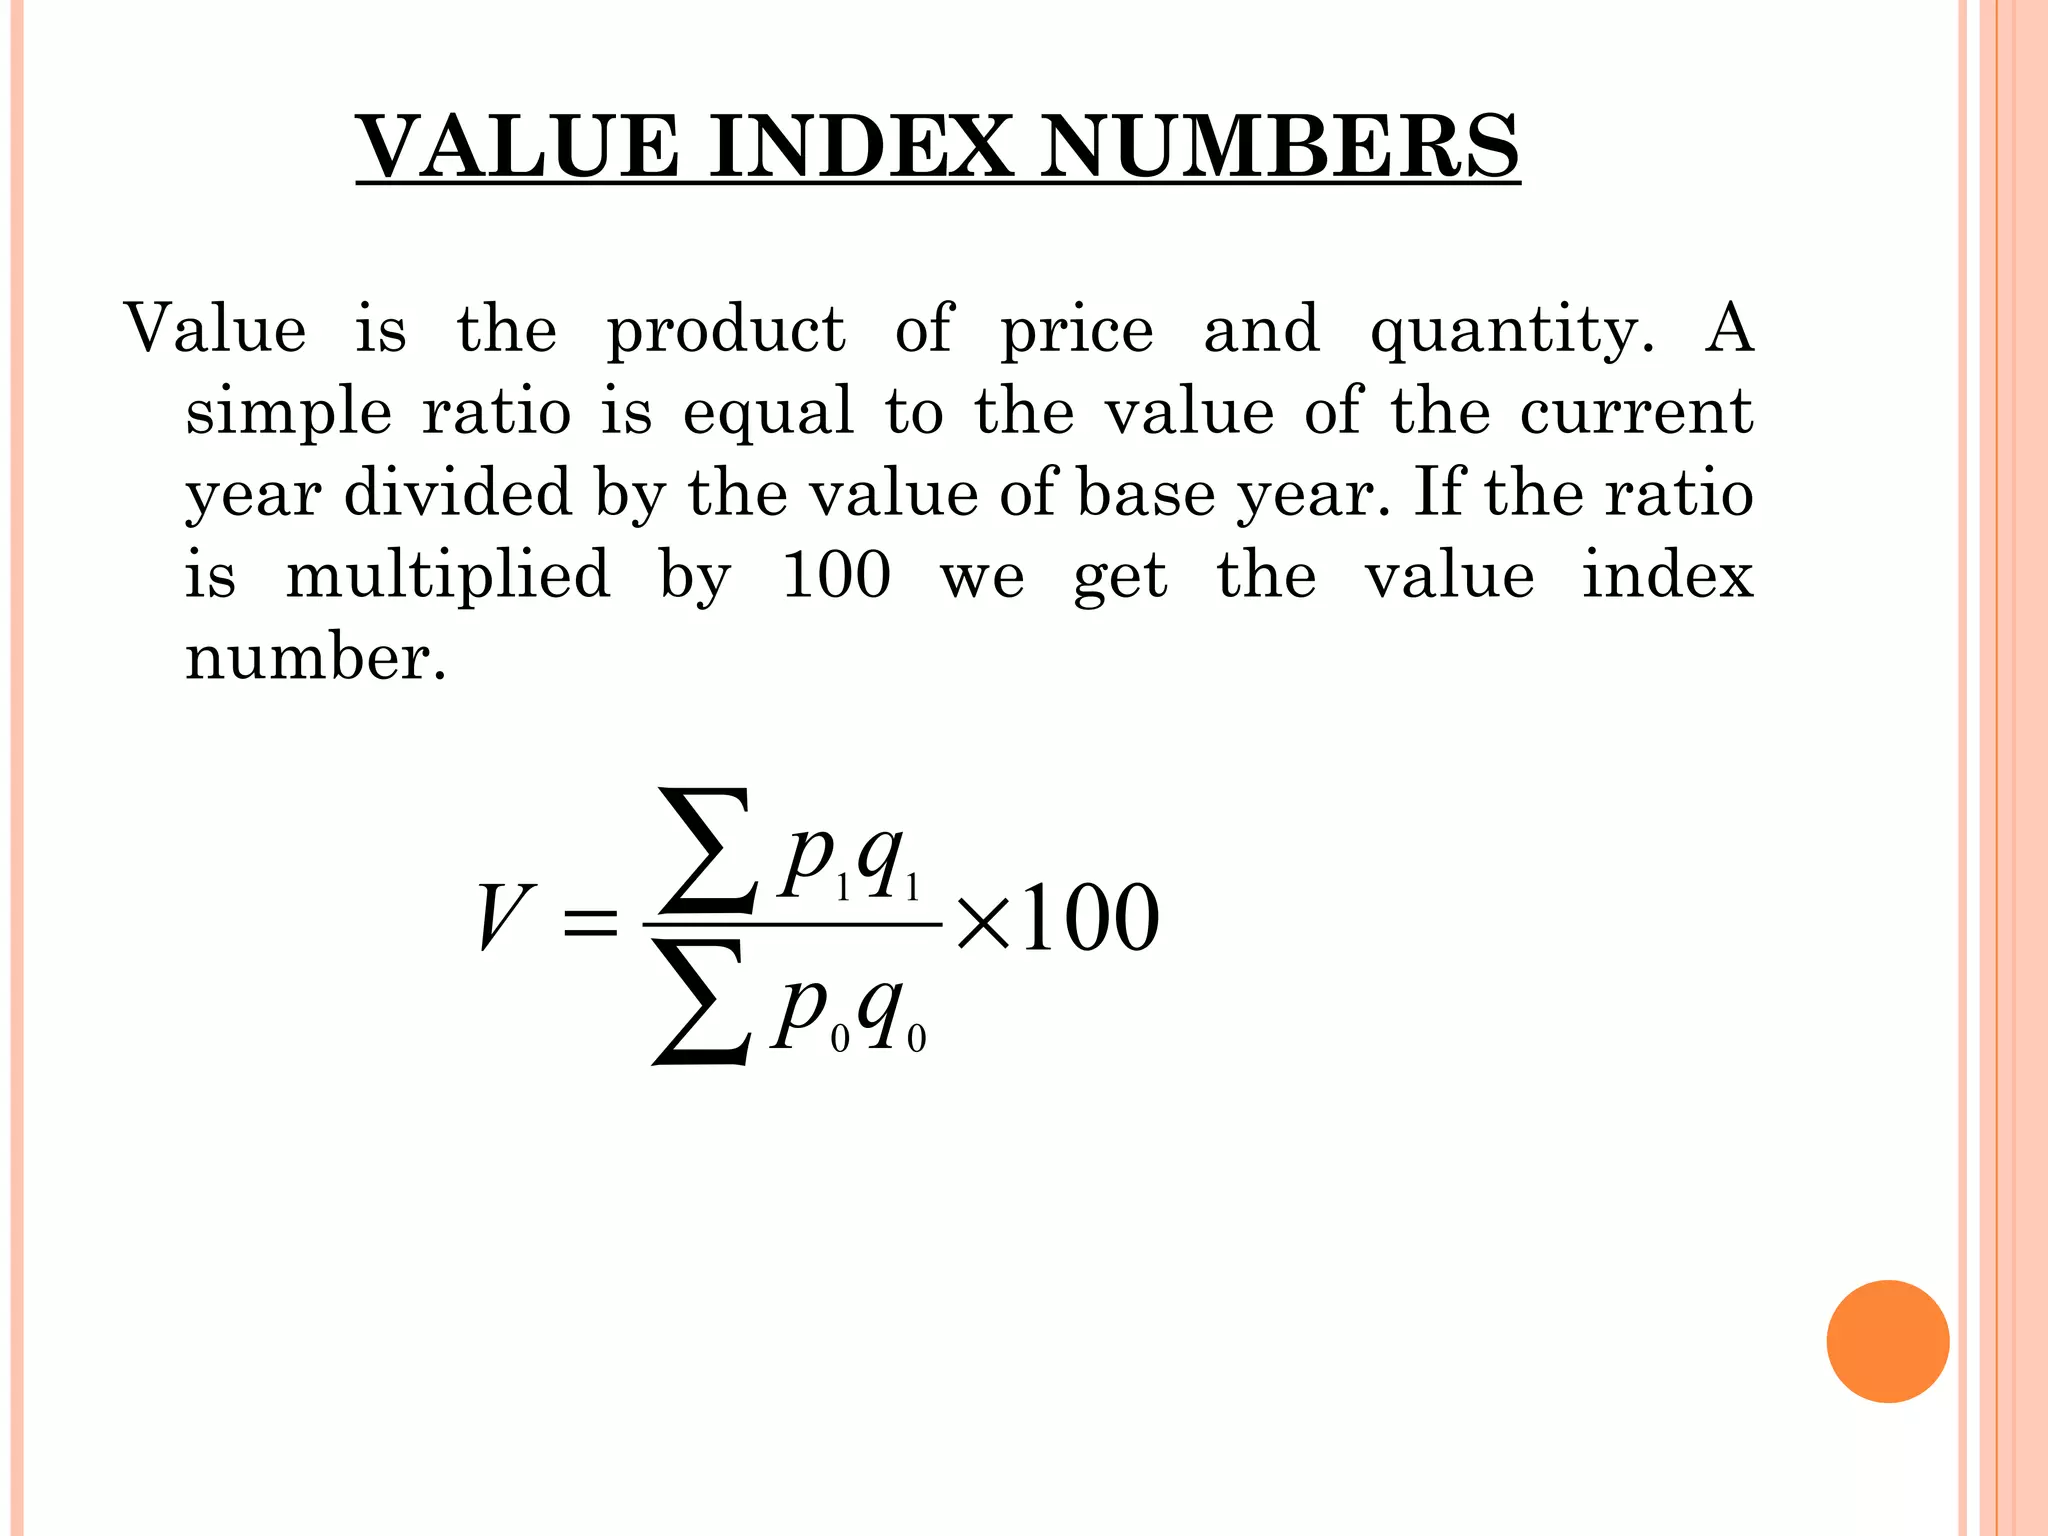
VALUE INDEX NUMBERSValue is the product of price and quantity. A simple ratio is equal to the value of the current year divided by the value of base year. If the ratio is multiplied by 100 we get the value index number.
26.
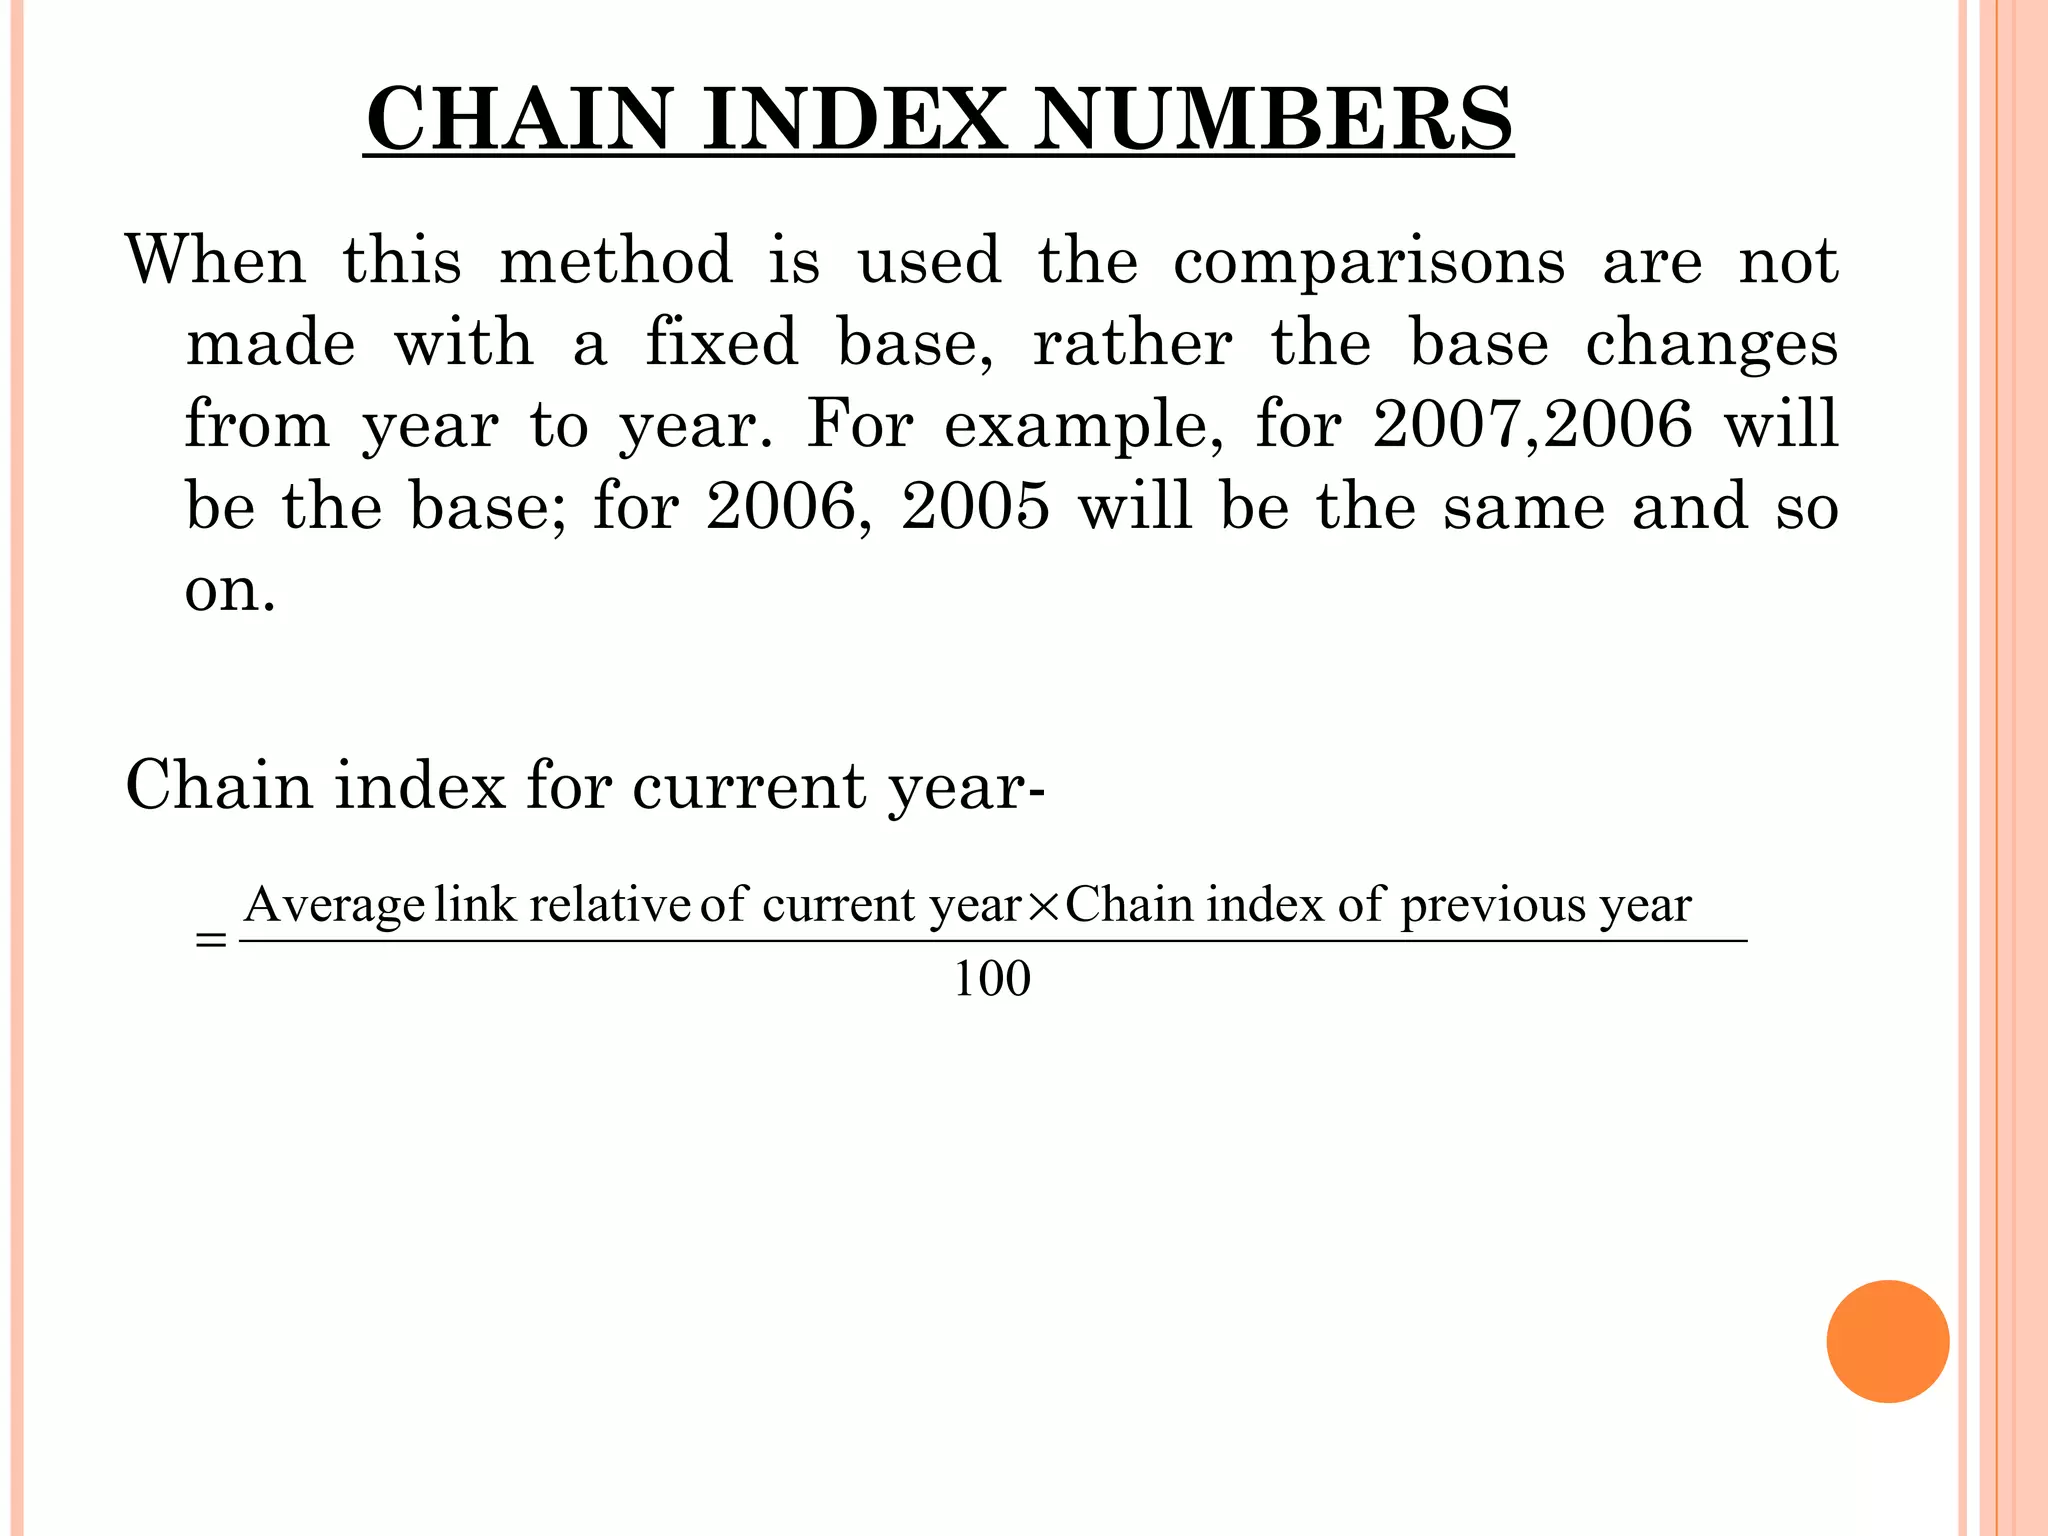
CHAIN INDEX NUMBERSWhen this method is used the comparisons are not made with a fixed base, rather the base changes from year to year. For example, for 2007,2006 will be the base; for 2006, 2005 will be the same and so on. Chain index for current year-
27.
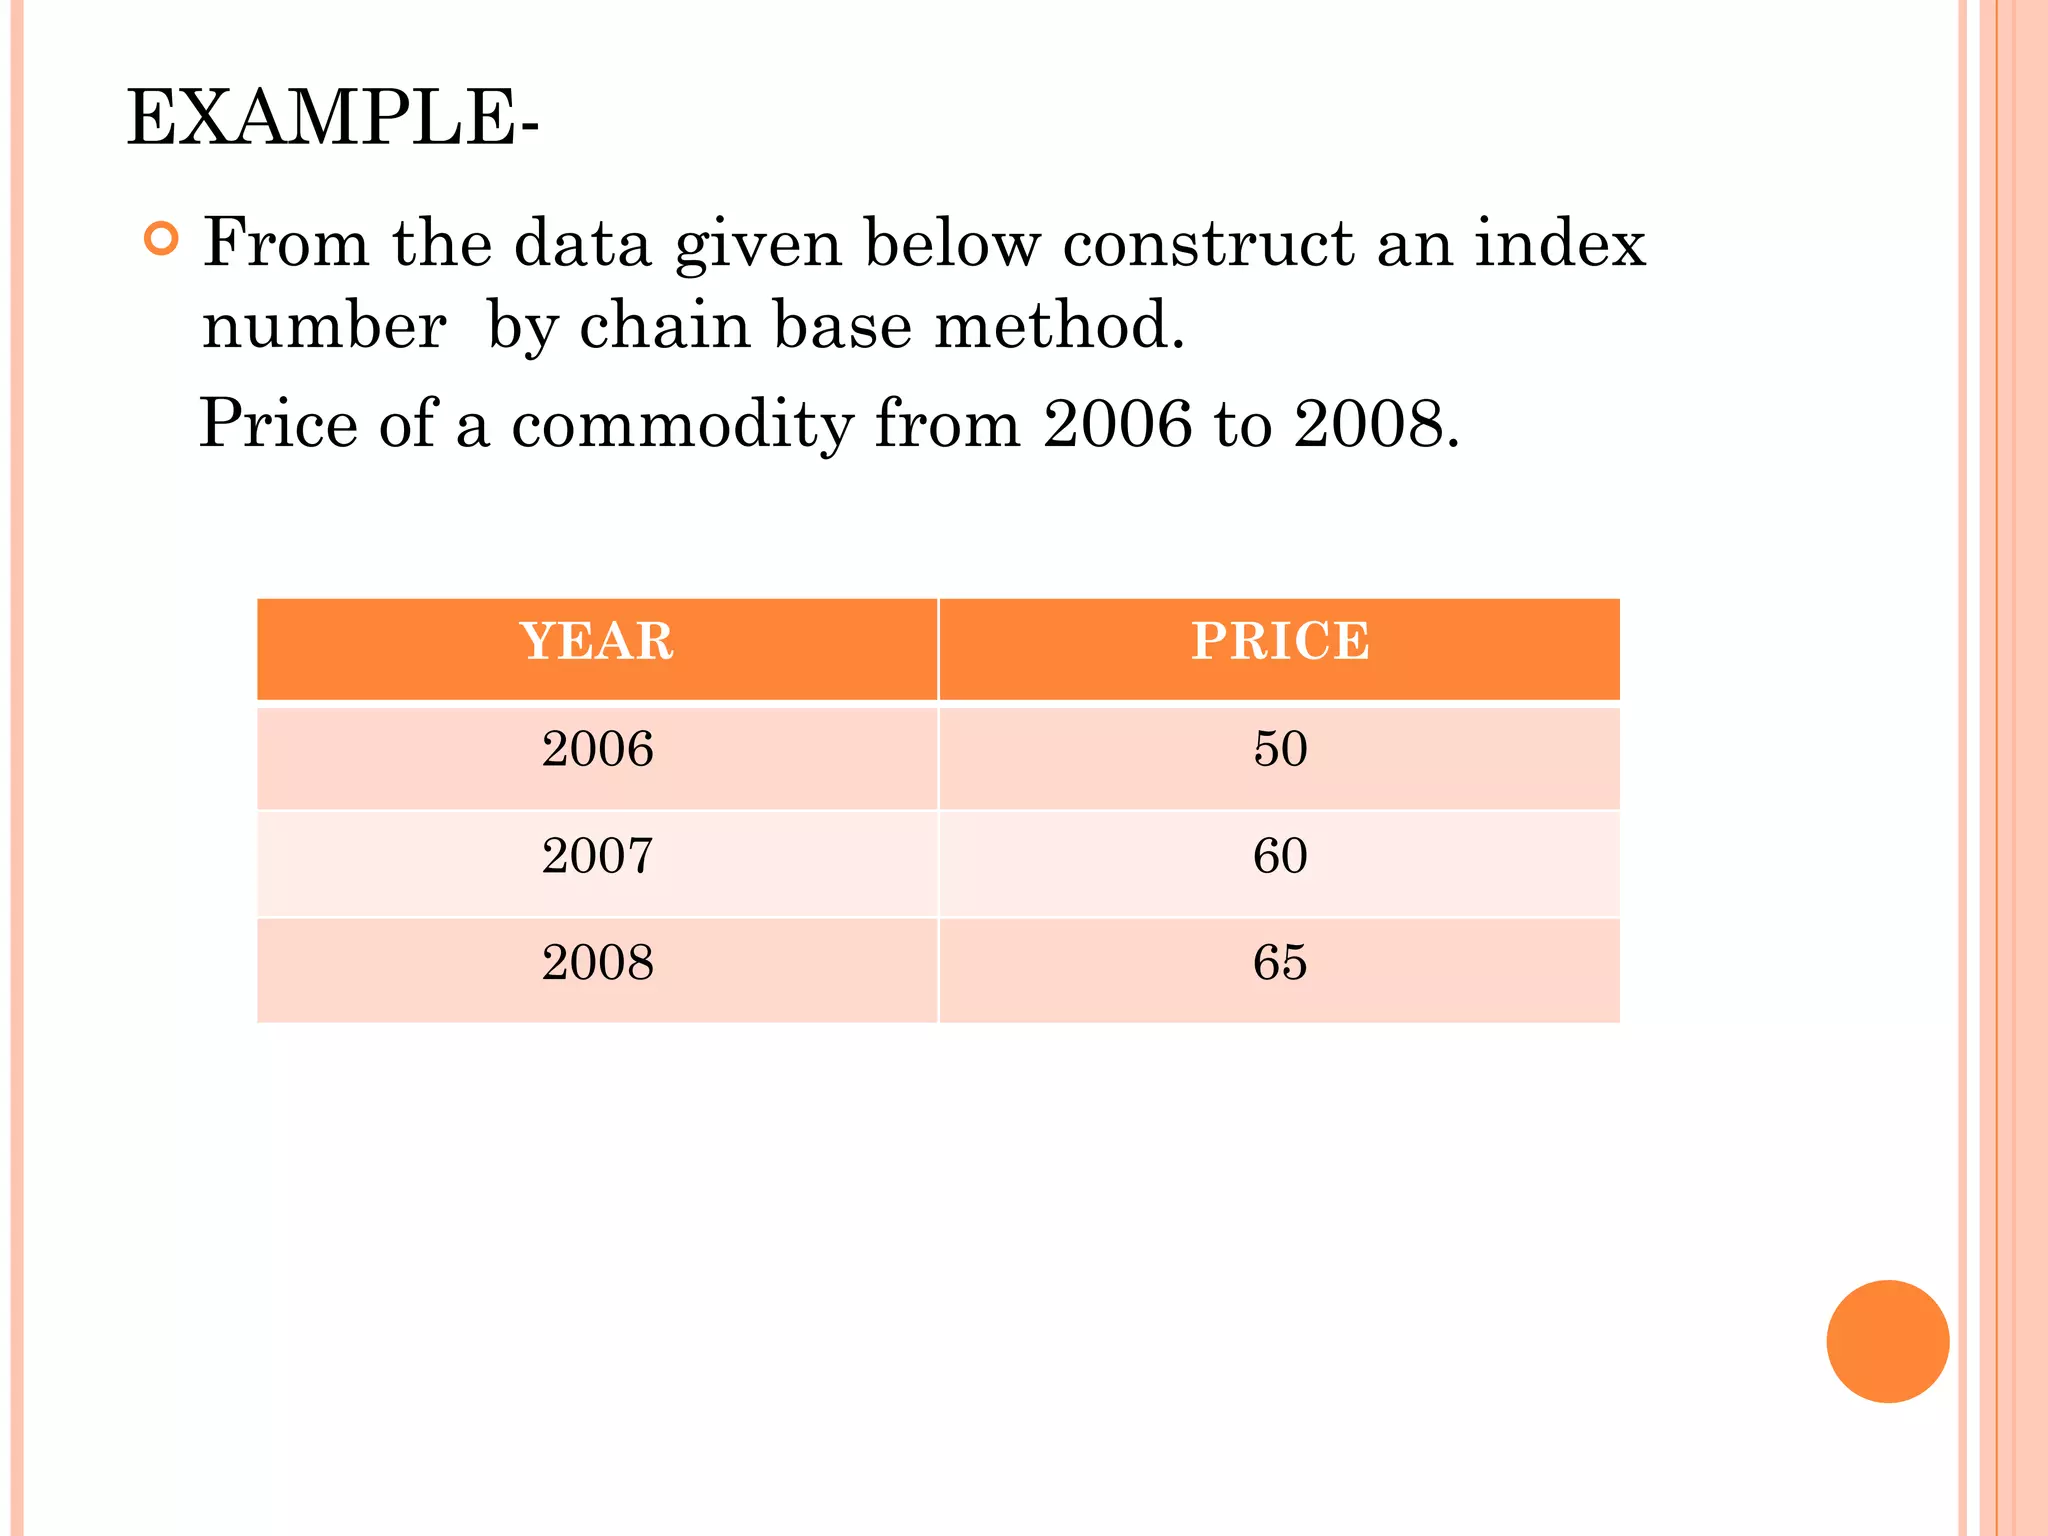
EXAMPLE- From thedata given below construct an index number by chain base method. Price of a commodity from 2006 to 2008. YEAR PRICE 2006 50 2007 60 2008 65
28.
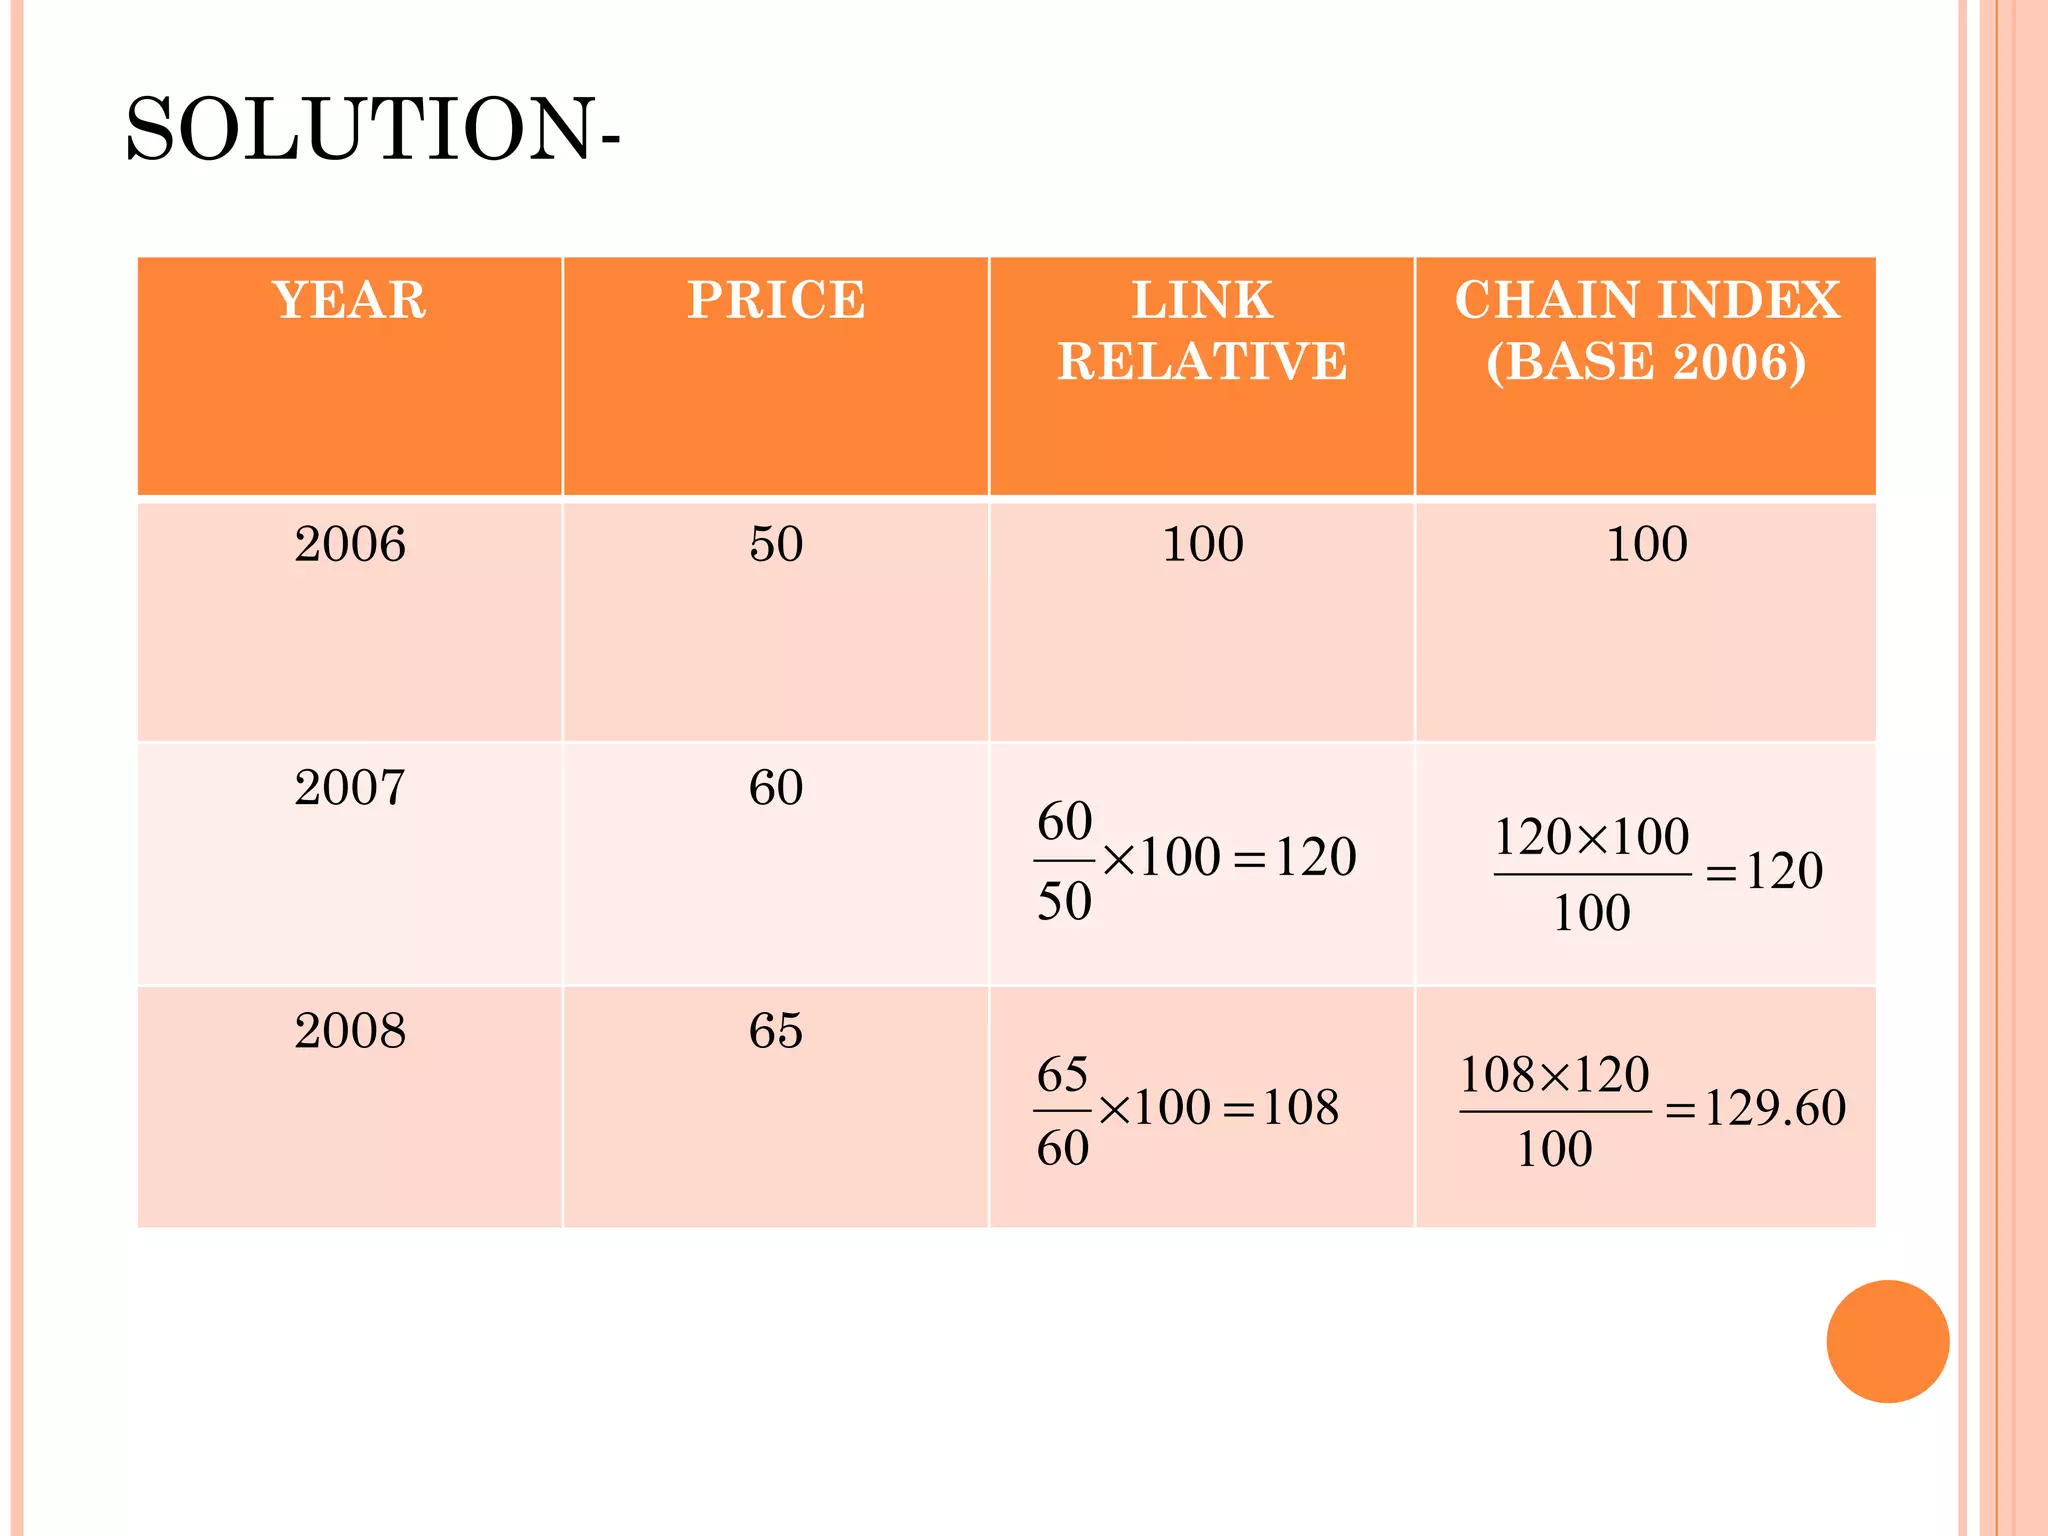
SOLUTION- YEAR PRICELINK RELATIVE CHAIN INDEX (BASE 2006) 2006 50 100 100 2007 60 2008 65
29.
REFERENCES 1. Statisticsfor management. Richard i. Levin & David S. Rubin. 2. Statistics for Business and economics. R.P.Hooda. 3. Business Statistics. B.M.Agarwal. 4. Business statistics. S.P.Gupta.