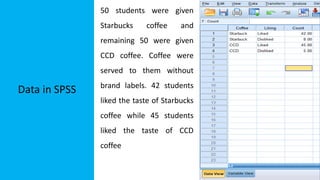
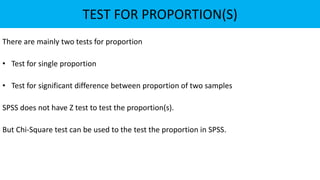
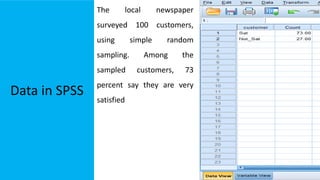
The document explains statistical tests for proportions using SPSS, detailing the test for a single proportion and the test for the difference between two proportions, including hypothesis formulation and statistical calculations. It includes case studies involving customer satisfaction and coffee brand preference, demonstrating how to apply the chi-square test and z-test in practical scenarios. The results indicate that the CEO's claim about customer satisfaction is supported, while there is no significant difference in preferences between the two coffee brands among undergraduate students.

![Null & Alternative
Hypothesis
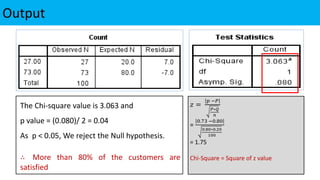
Step 1: H0: P = 0.80
[Not more than 80% of the customers are satisfied ]
Step 2: H1: P > 0.80
[More than 80% of the customers are satisfied ]
(One-tailed test)](https://image.slidesharecdn.com/proptestusingchi-square-220124171947/85/Proportion-test-using-Chi-square-7-320.jpg)
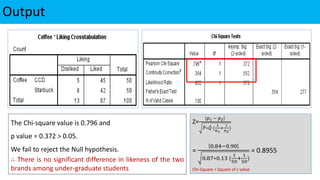
![Null & Alternative
Hypothesis
Step 1: H0: 𝑃1 = 𝑃1
[There is no significant difference in likeness of the two brands]
Step 2: H1: 𝑃1 ≠ 𝑃1
[There is significant difference in likeness of the two brands]
(Two-tailed test)](https://image.slidesharecdn.com/proptestusingchi-square-220124171947/85/Proportion-test-using-Chi-square-16-320.jpg)