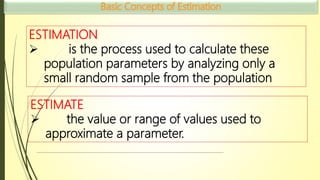
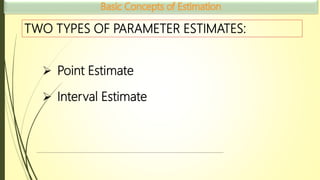
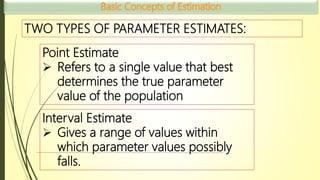
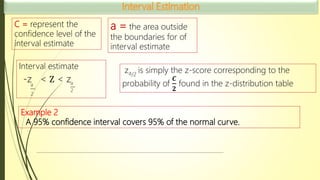
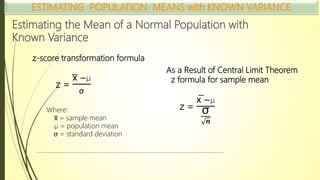
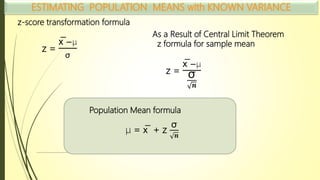
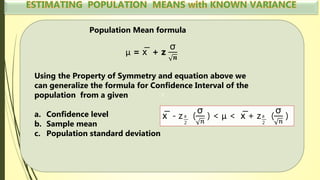
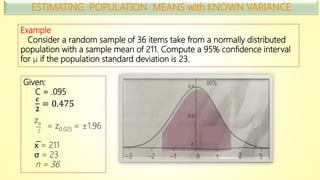
This document discusses parameter estimation and interval estimation. It defines point estimates as single values that estimate population parameters and interval estimates as ranges of values within which population parameters are expected to fall. It provides examples of using the sample mean and variance as point estimators for the population mean and variance. It also discusses how to construct confidence intervals for population parameters based on sample statistics, sample size, and the desired confidence level.
Application of Matrices in real life. Presentation on application of matrices
Estimating population mean
1.
2.
3.
4. ESTIMATION
is the process used to calculate these
population parameters by analyzing only a
small random sample from the population
ESTIMATE
the value or range of values used to
approximate a parameter.
5. TWO TYPES OF PARAMETER ESTIMATES:
Point Estimate
Interval Estimate
6. TWO TYPES OF PARAMETER ESTIMATES:
Point Estimate
Refers to a single value that best
determines the true parameter
value of the population
Interval Estimate
Gives a range of values within
which parameter values possibly
falls.
7. Point Estimate Method
a population parameter is estimated simply with its
corresponding sample statistics
the sample mean estimates the population mean, the sample
variance estimates the population variance
x
_
=
1
𝑛
s2 =
1
𝑛−1
(xi – x )2
_
Point Estimator of Population
MEAN μ
Point Estimator of Population
VARIANCE σ²
8. Interval Estimation
To construct an interval around the point estimate and to state the degree of
certainty that the population mean is within that interval. Thus, a < μ < b, where
and b are the ends points of the interval between which the population mean lies.
The interval of values that predicts where the true population parameter belongs
is called INTERVAL ESTIMATE (Confidence Interval)
The degree of certainty that the true population parameter falls within the
constructed confidence interval is referred to as CONFIDENCE LEVEL.
9. Example 2
A 95% confidence interval covers 95% of the normal curve.
C = represent the
confidence level of the
interval estimate
a = the area outside
the boundaries for of
interval estimate
Interval estimate
za/2
is simply the z-score corresponding to the
probability of
𝑪
𝟐
found in the z-distribution table
-z < Z < z
2
a__
2
a__
21. Estimating the Mean of a Normal Population with
Known Variance
z-score transformation formula
z =
x̅ −μ
σ
Where:
x̅ = sample mean
μ = population mean
σ = standard deviation
As a Result of Central Limit Theorem
z formula for sample mean
z =
x̅ −μ
σ
𝒏
22. z-score transformation formula
z =
x̅ −μ
σ
As a Result of Central Limit Theorem
z formula for sample mean
z =
x̅ −μ
σ
𝒏
μ = x̅ + z
σ
𝒏
Population Mean formula
23. z
μ = x̅ + z
σ
𝒏
Population Mean formula
Using the Property of Symmetry and equation above we
can generalize the formula for Confidence Interval of the
population from a given
a. Confidence level
b. Sample mean
c. Population standard deviation
x̅ - z (
σ
𝑛
) < μ < x̅ + z (
σ
𝑛
)
2
a__
2
a__
24. Example
Consider a random sample of 36 items take from a normally distributed
population with a sample mean of 211. Compute a 95% confidence interval
for μ if the population standard deviation is 23.
Given:
C = .095
𝒄
𝟐
= 0.475
= z0.025 = ±1.96
x̅ = 211
σ = 23
n = 36
2
a__
z
25. 2
a__
z
x̅ - z (
σ
𝑛
) < μ < x̅ + z (
σ
𝑛
)
2
a__
2
a__
Formula:Given:
C = .095
𝒄
𝟐
= 0.475
= z0.025 = ±1.96
x̅ = 211
σ = 23
n = 36
211-1.96 (
23
36
) < μ < 211 + 1.96(
23
36
)
203.55< μ < 218.51
This mean that the mean of given population lies between 203.55
and 218.51 on a 95% confidence interval
26.
27. 1. The shape of the sampling distribution depends on
the shape of the population.
Two Problems will exist when the given sample is small
2. The population standard deviation is almost unknown
29. Exercise 1
Suppose that systolic blood pressures of a certain population are normally
distributed with σ = 8 and a sample with size 25 is taken from this
population. The average of the systolic blood pressures of these is 25
individuals is found to be 122. Find the 99% confidence interval of the
average systolic pressure for all the members of the population.
Exercise 2
A random sample with size 9 is selected from a certain population with
standard deviation of 3.2 the mean is 15. Estimate the mean for the
population at 90% confidence level.
31. Problem 1
The ages of the member of a given population have standard deviation of
10. If the mean age of the sample with size 9 is 33.5 and considering that
the given population follows a normal distribution, compute the 99%
confidence interval of the mean age of the members of the population.
Problem 2
The average height of the students in a famous college in the city is
unknown but the standard deviation is approximated to be 0.8 ft. If a
random sample of 49 students is chosen and the mean of their heights is 6.1
ft, estimate the average height of all the students in the college using 95%
confidence level.