Downloaded 299 times
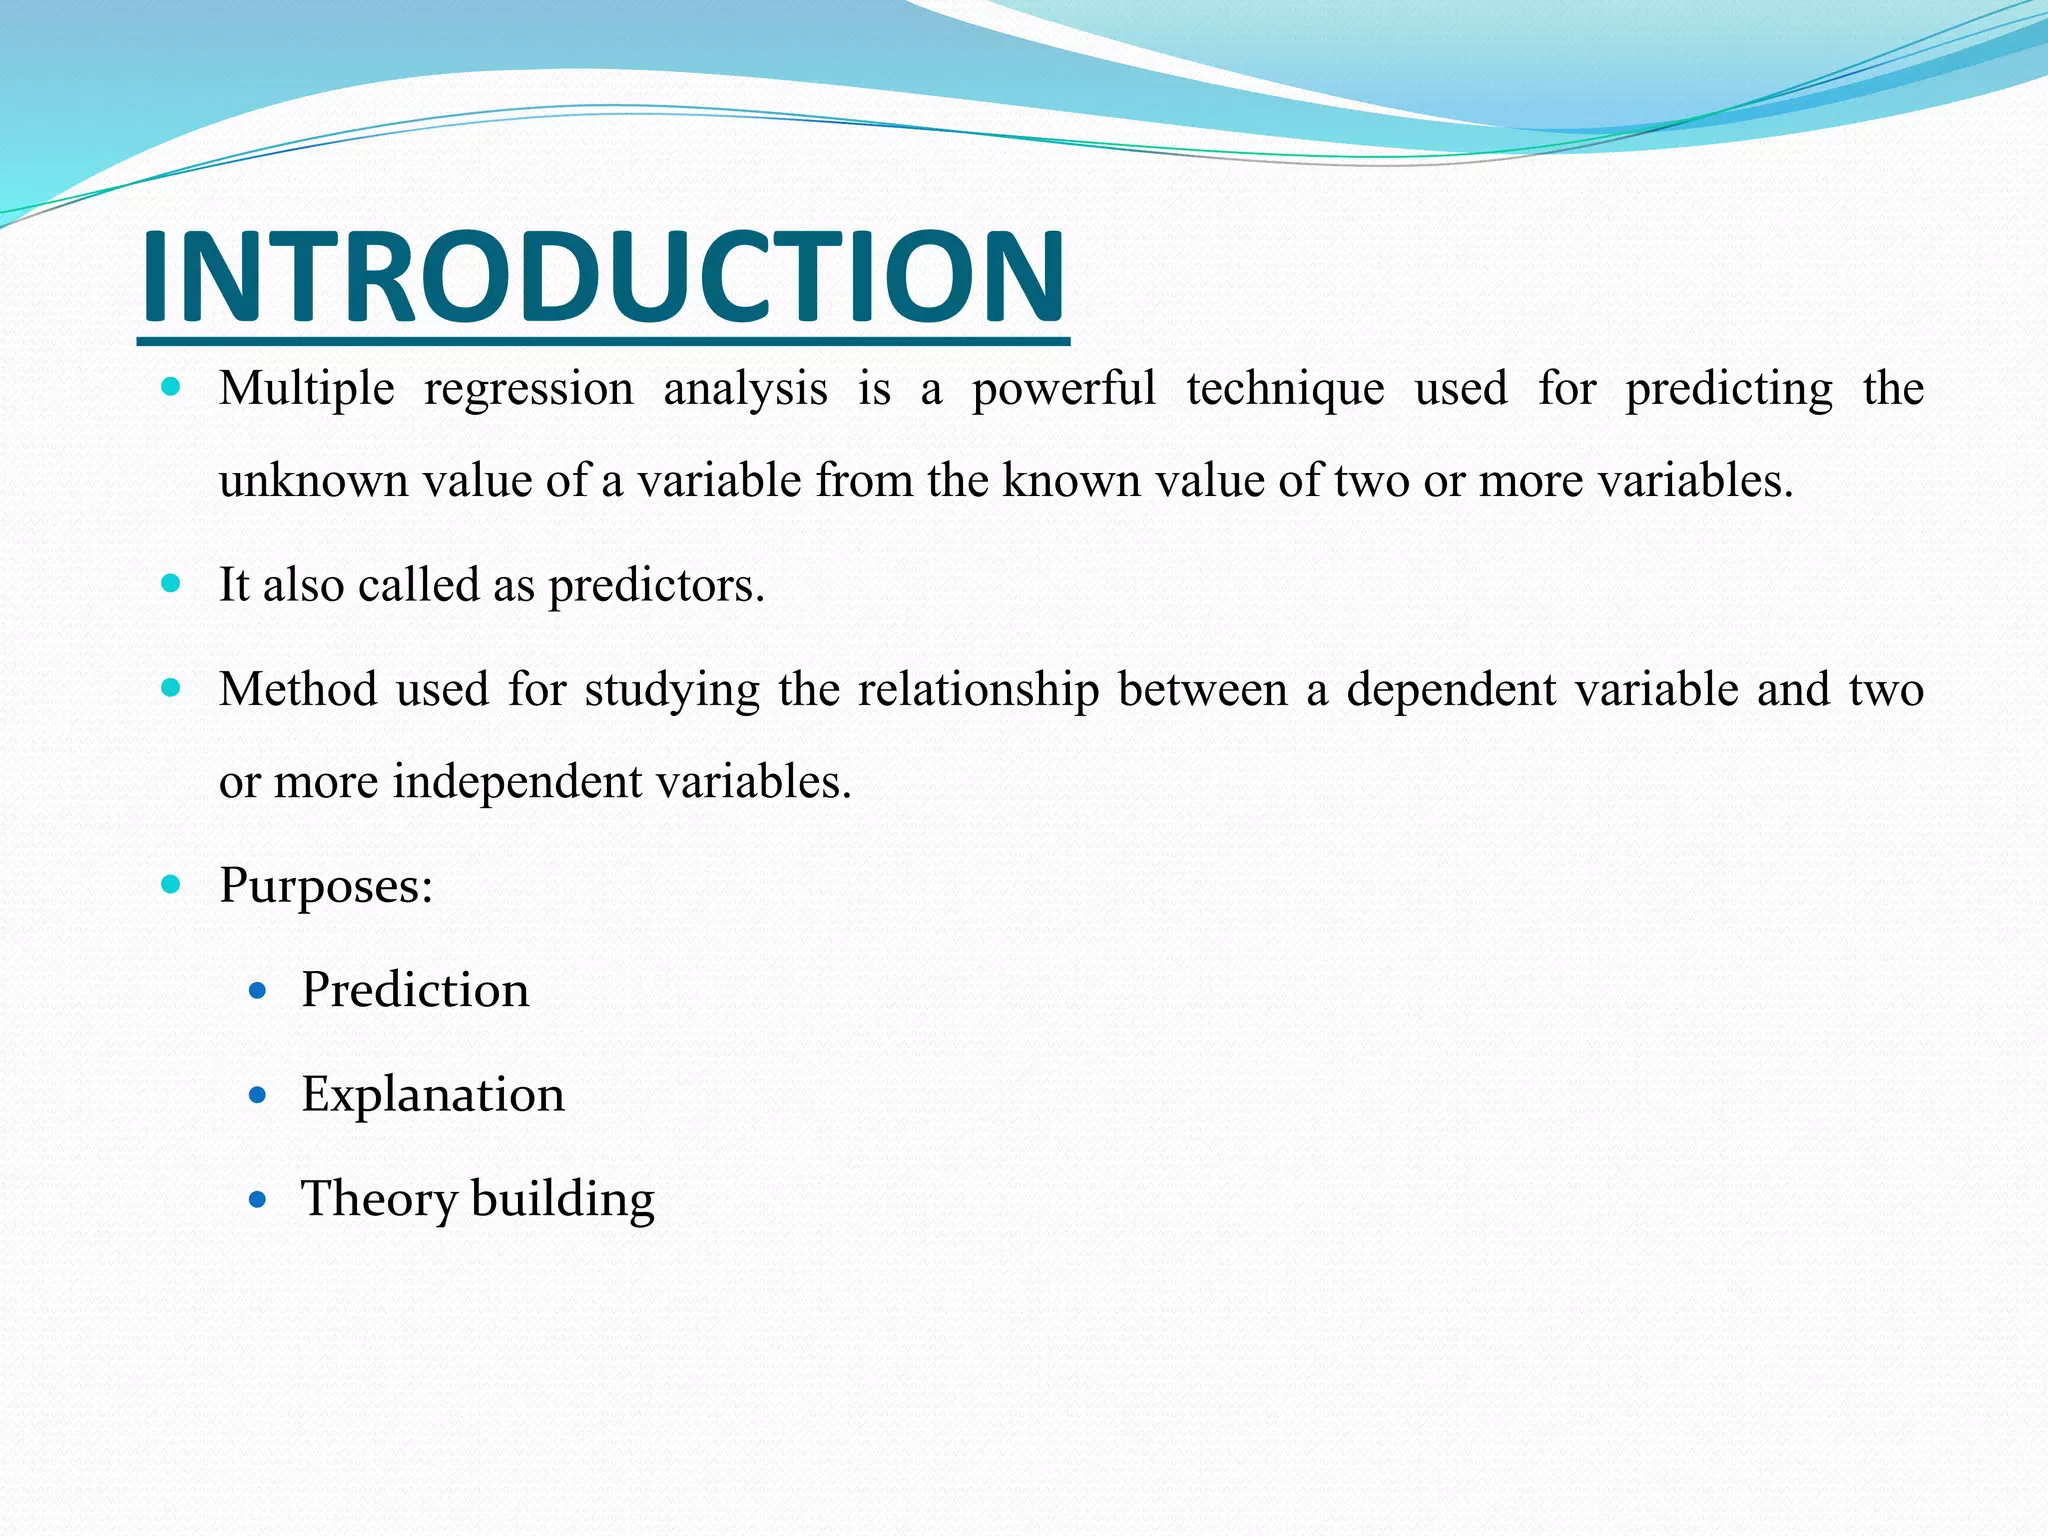


Multiple regression analysis is a statistical method used to predict the value of a dependent variable based on two or more independent variables. It is useful for prediction, explanation, and theory building, with the quality of the model assessed using the coefficient of determination (r2). Assumptions include the linearity of relationships, necessitating scatter plot examinations for potential non-linearities.


