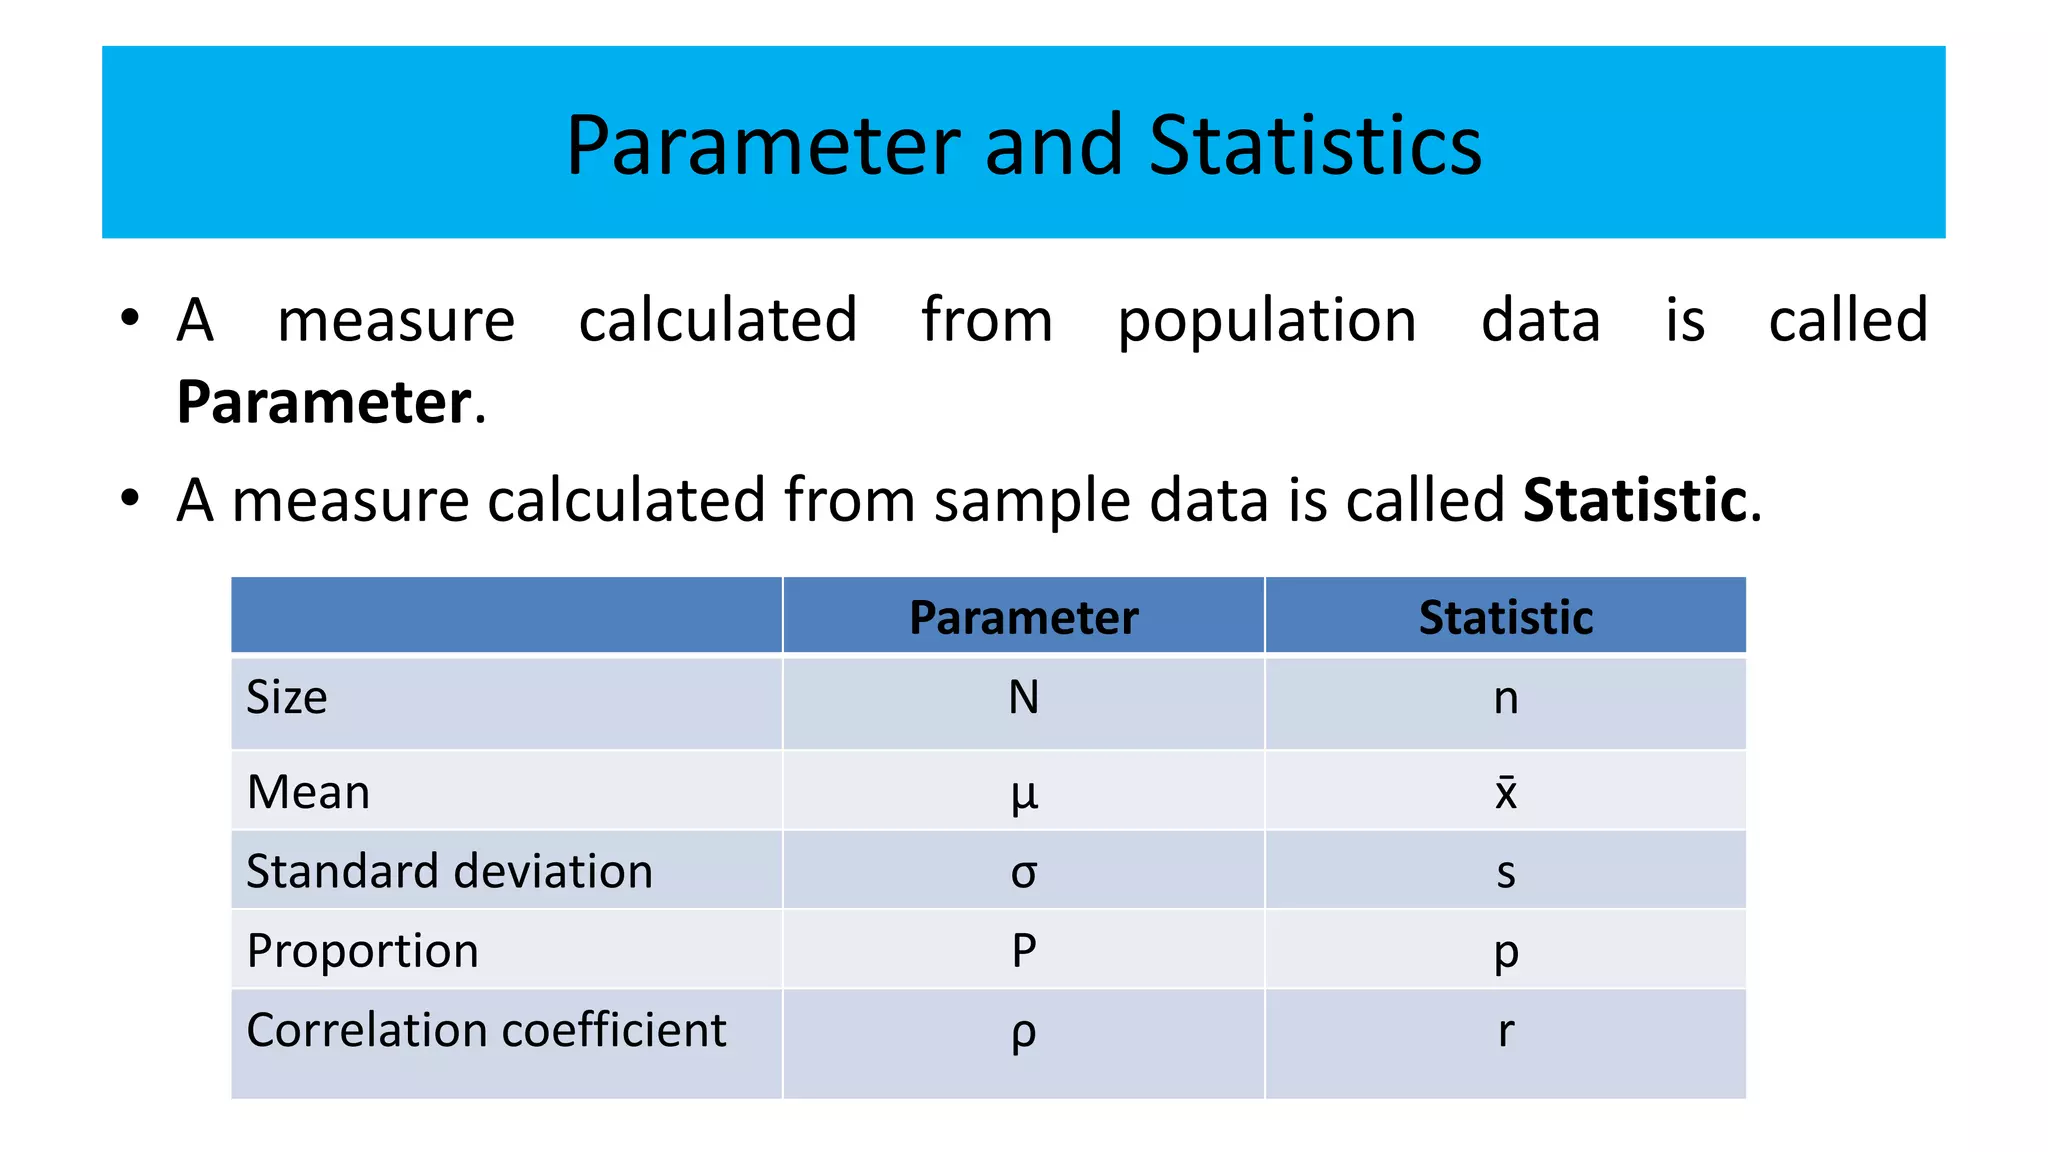
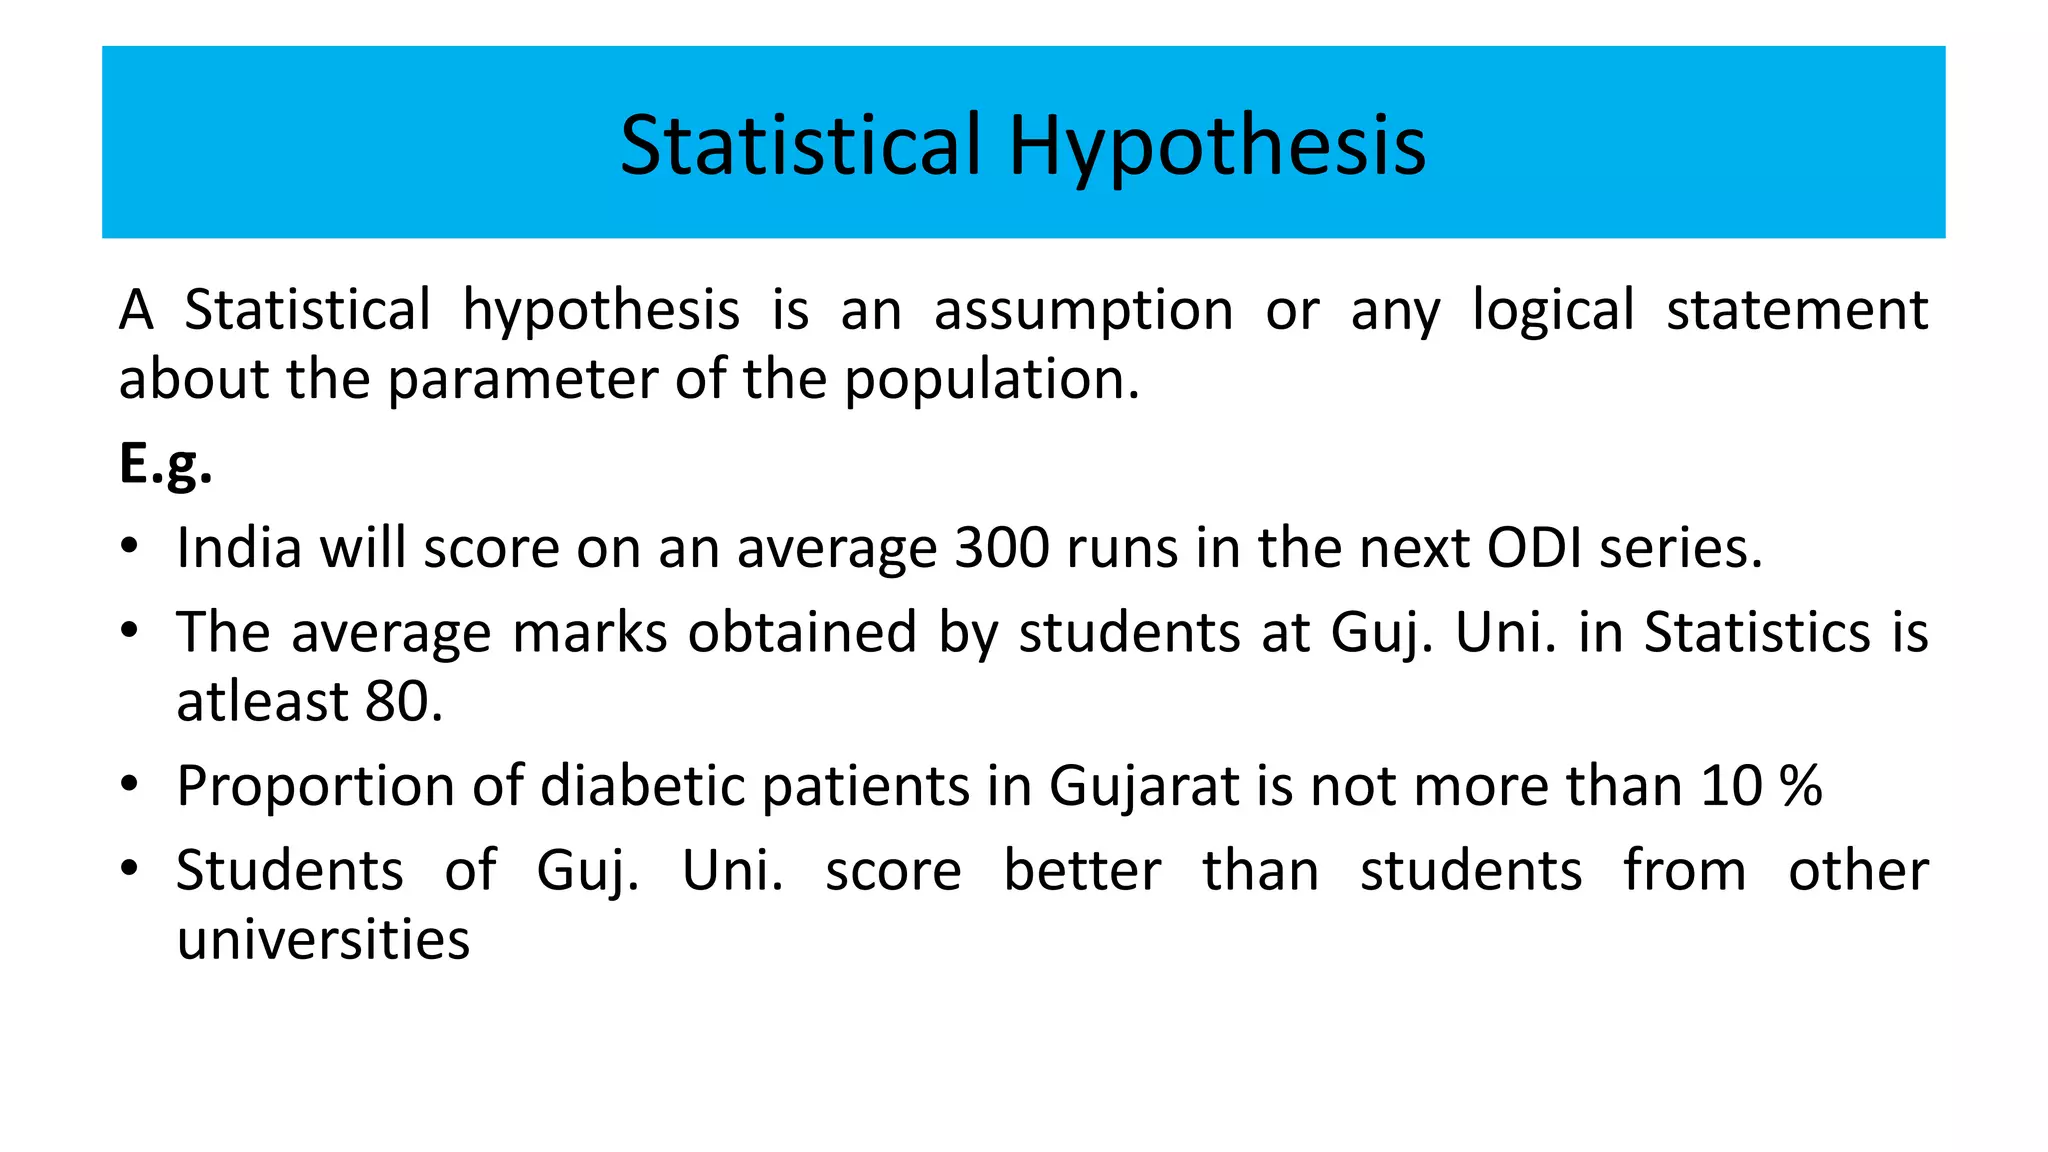
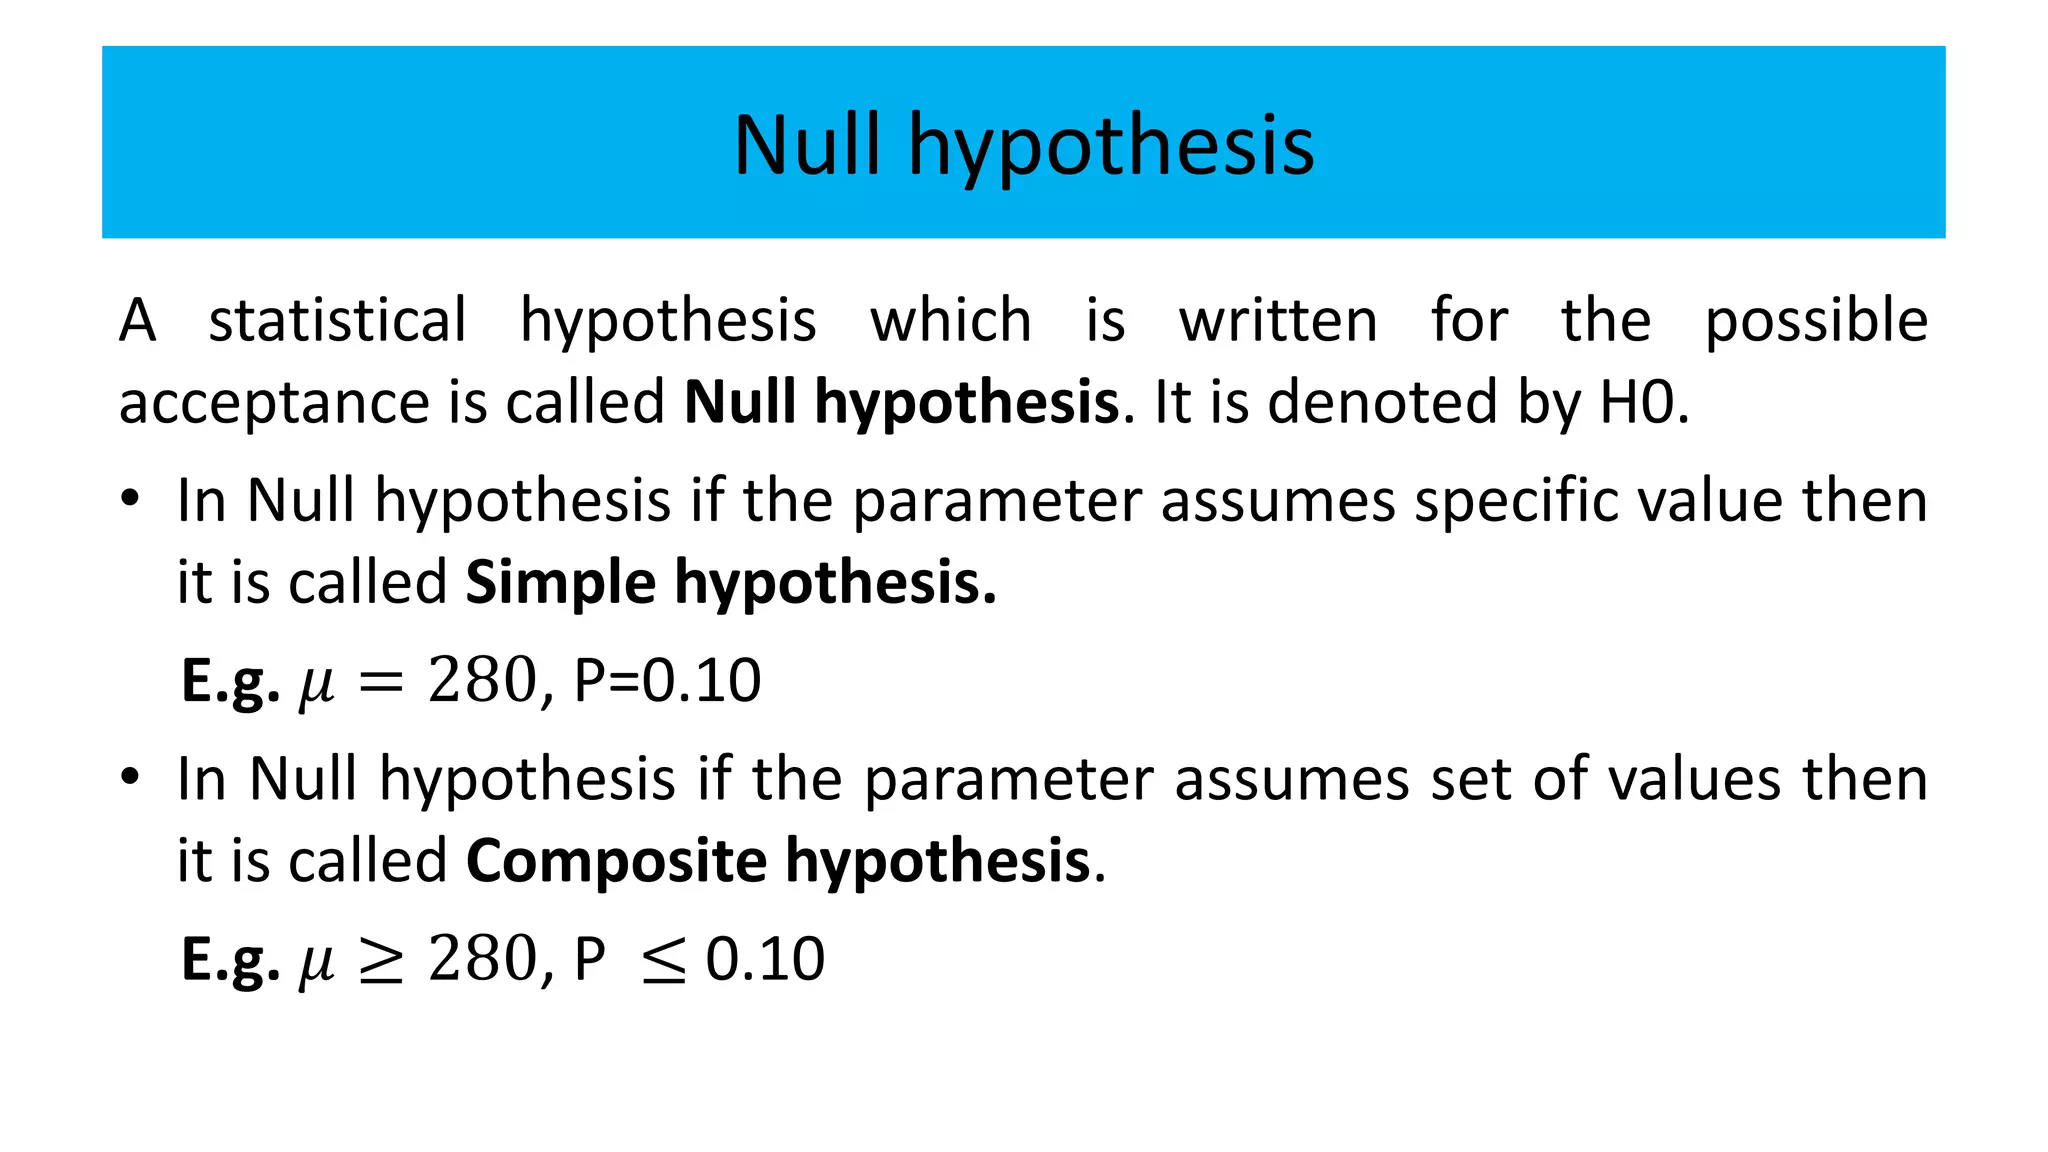
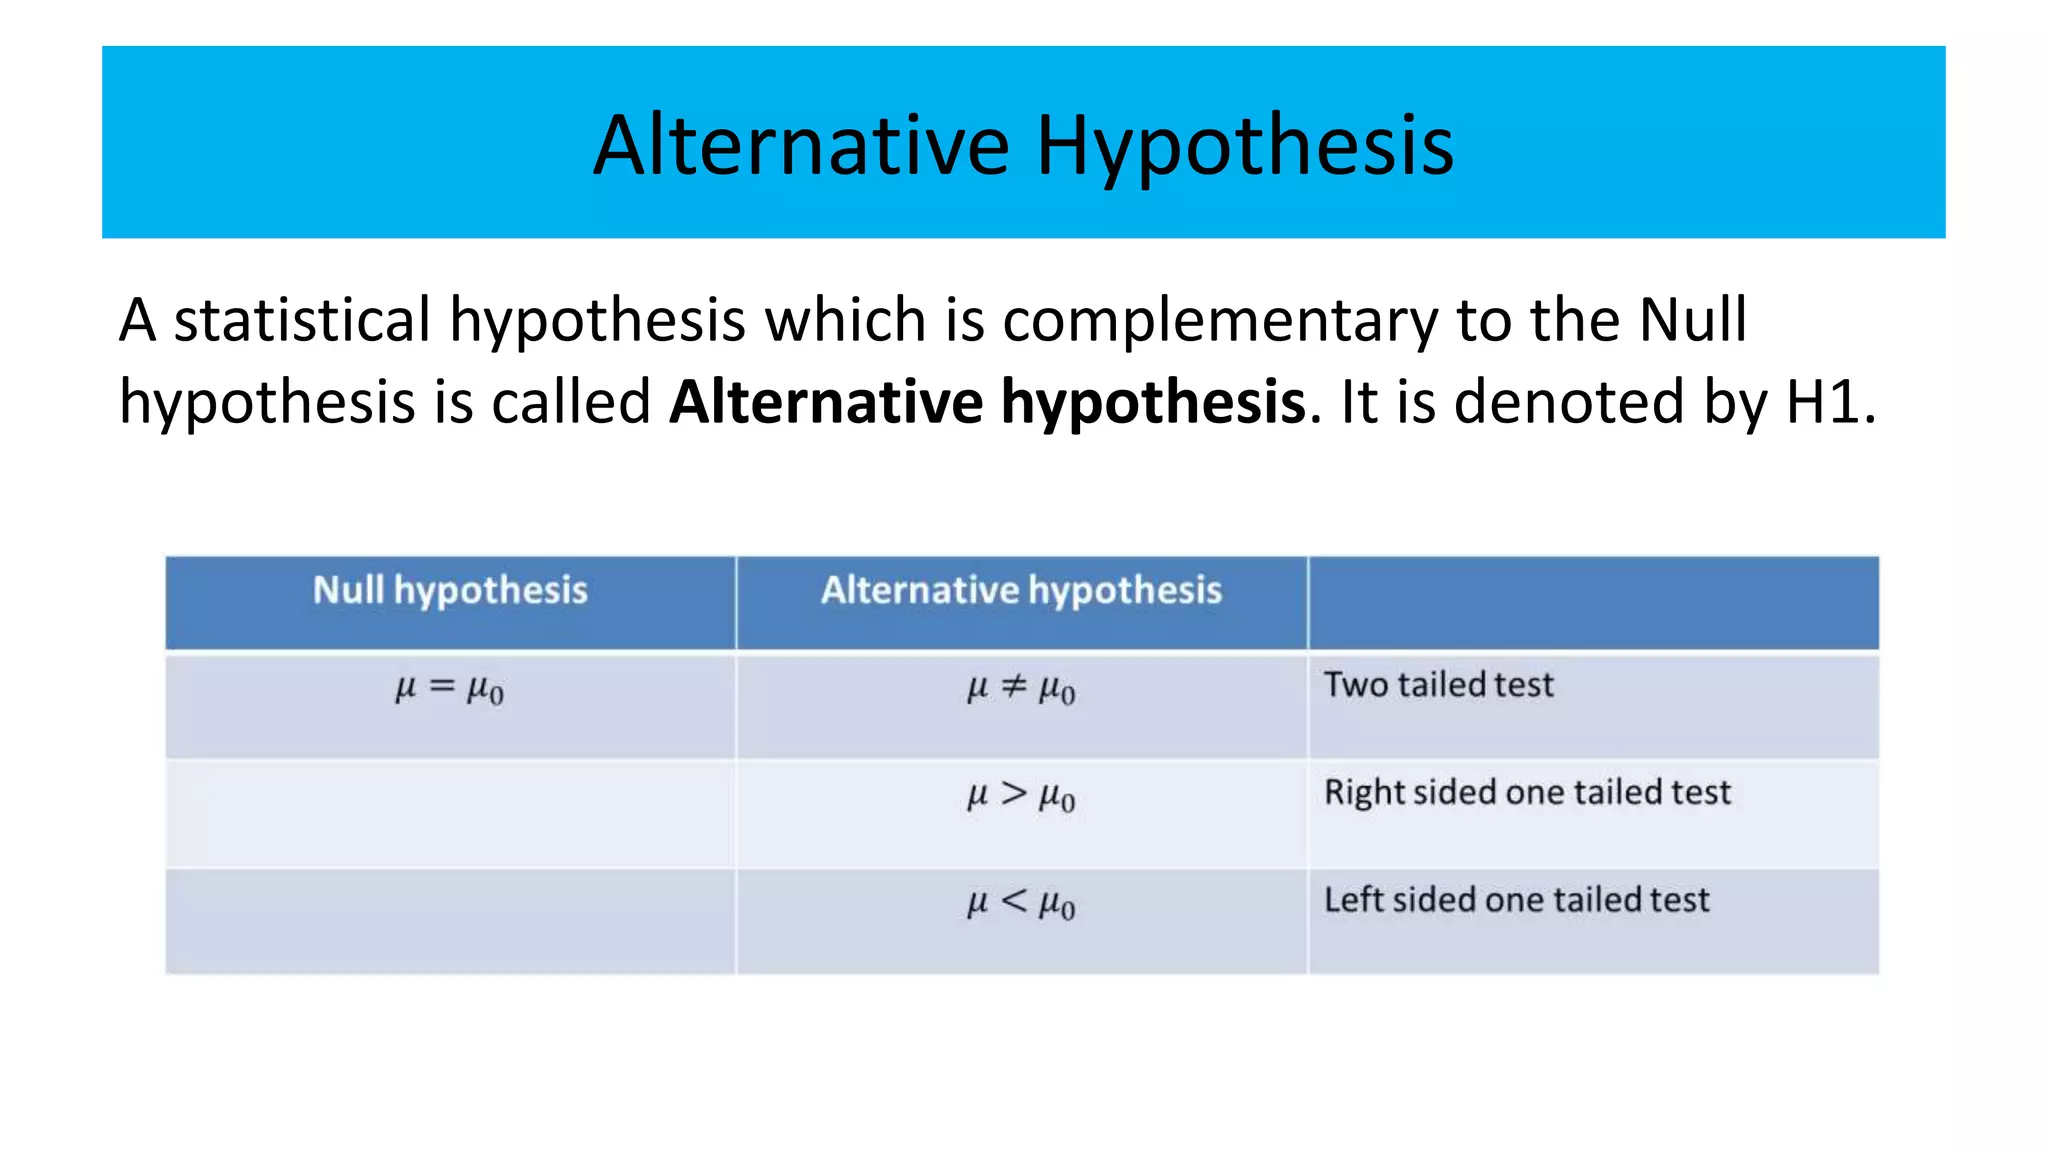
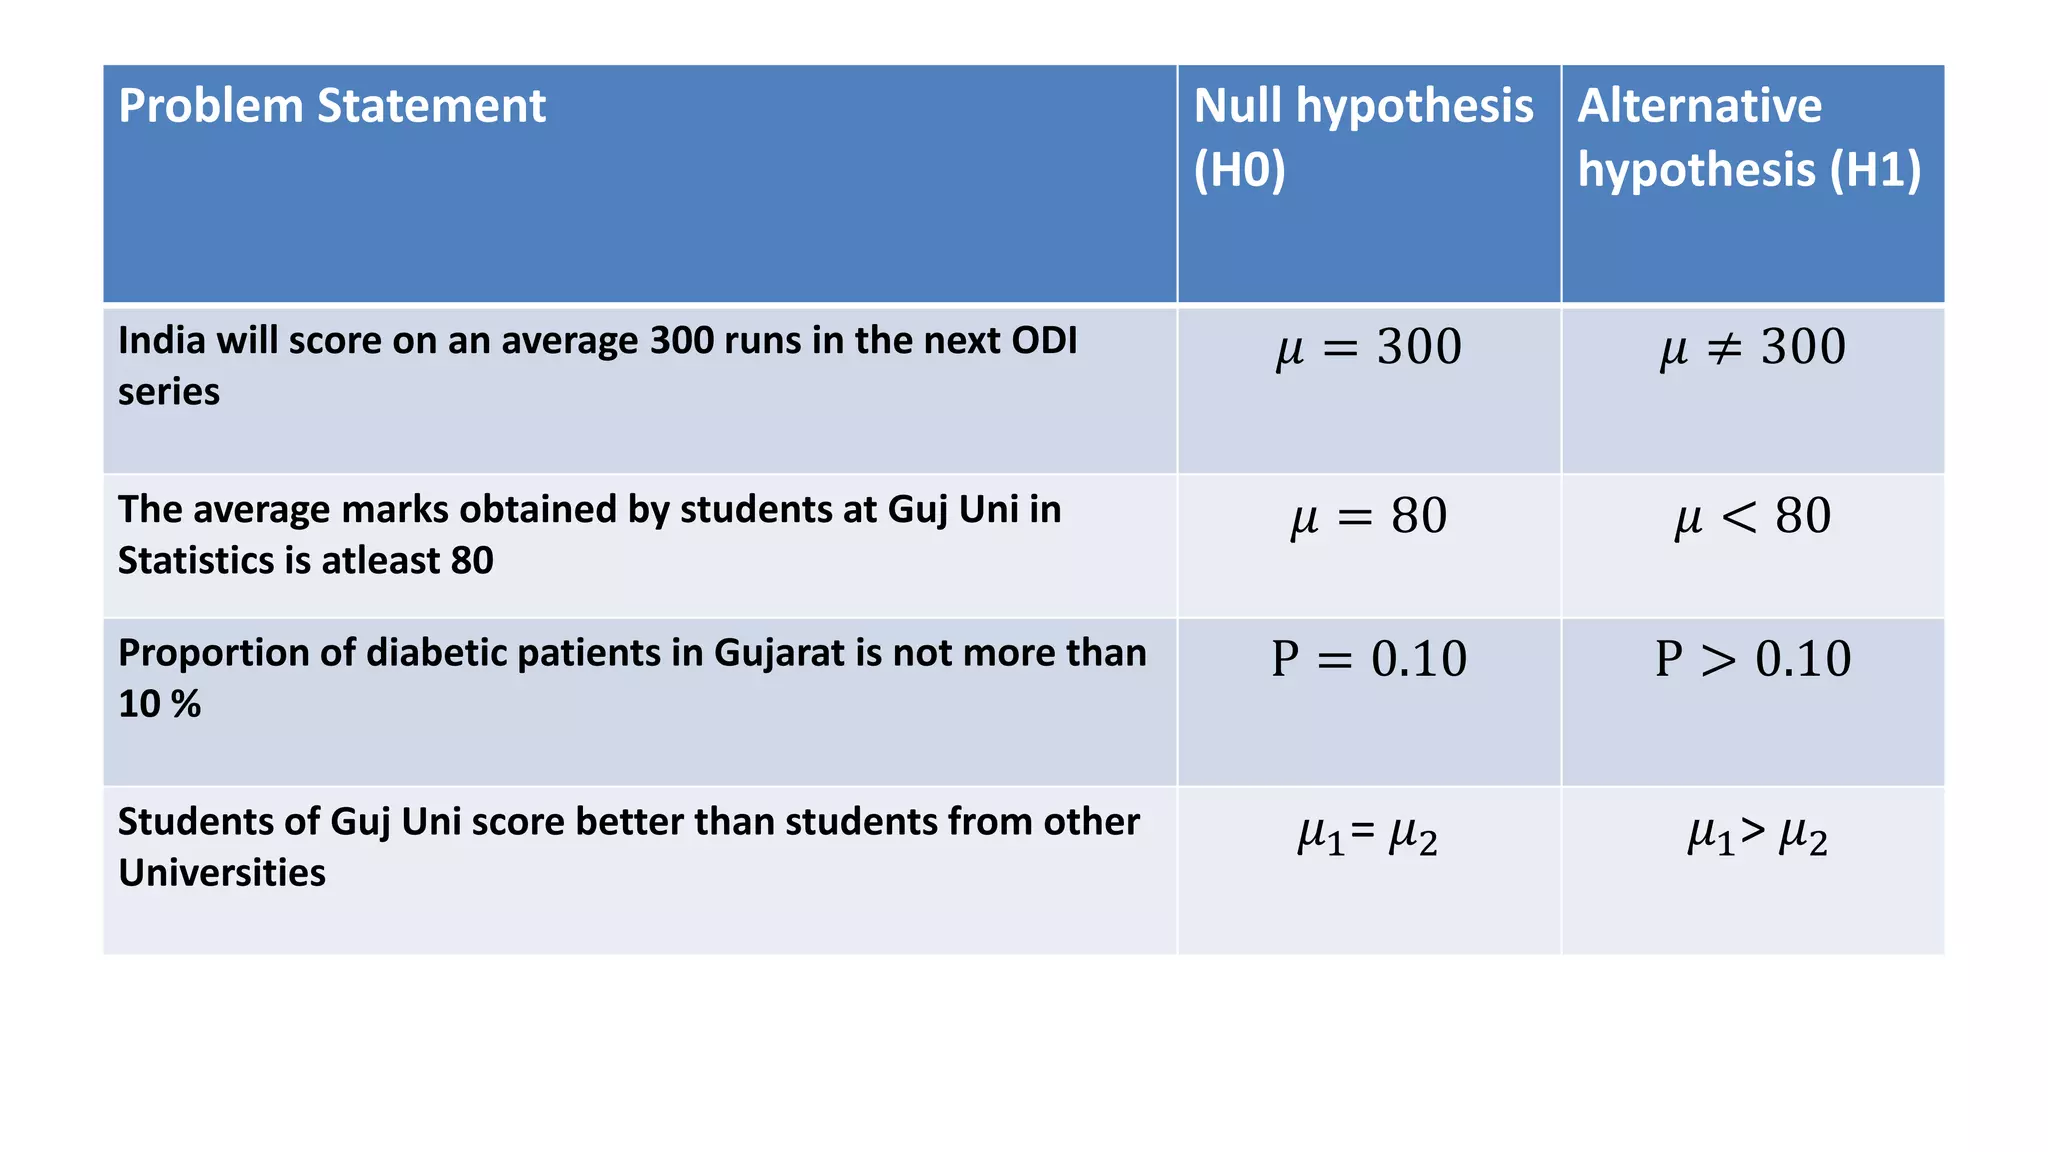
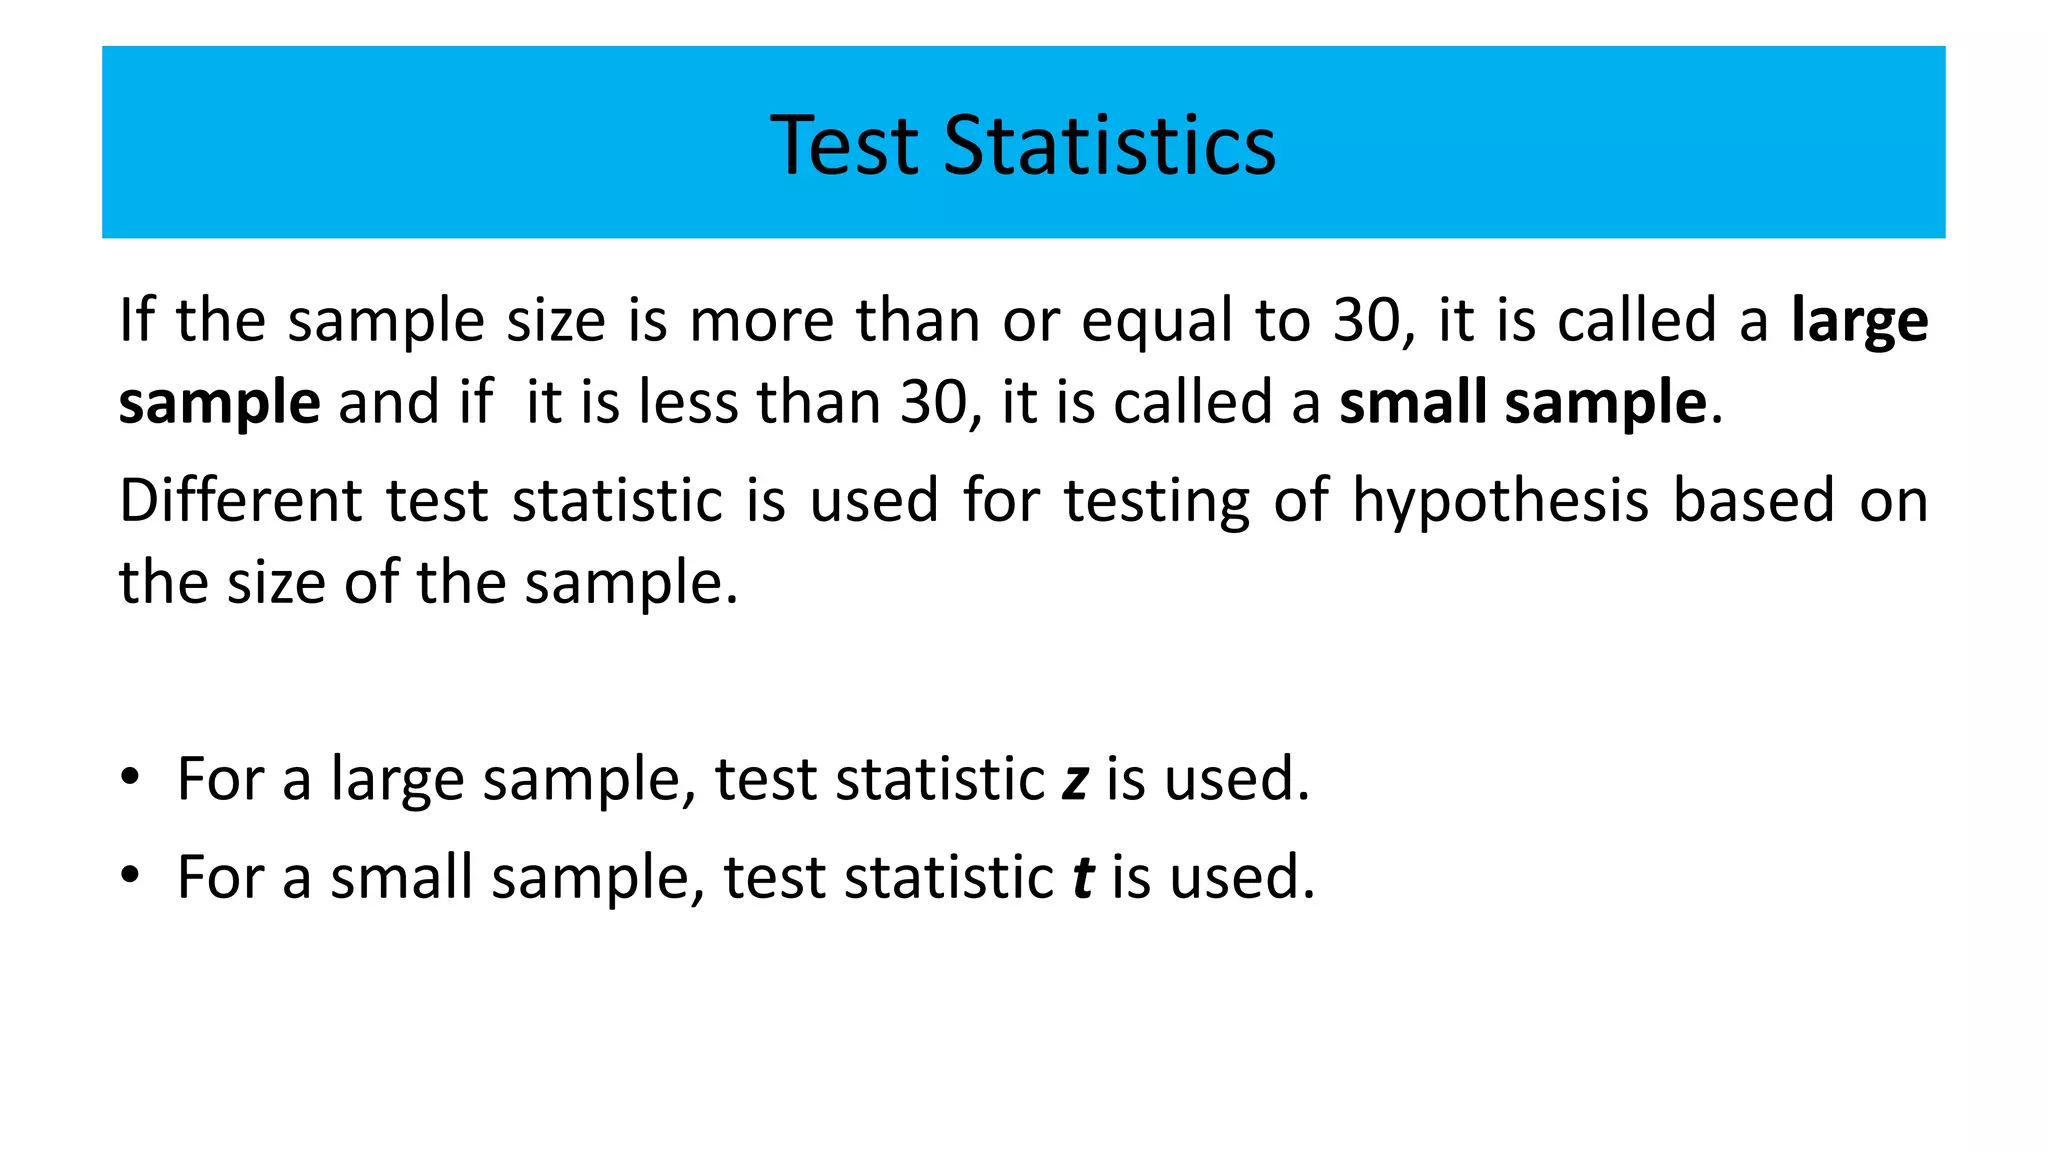
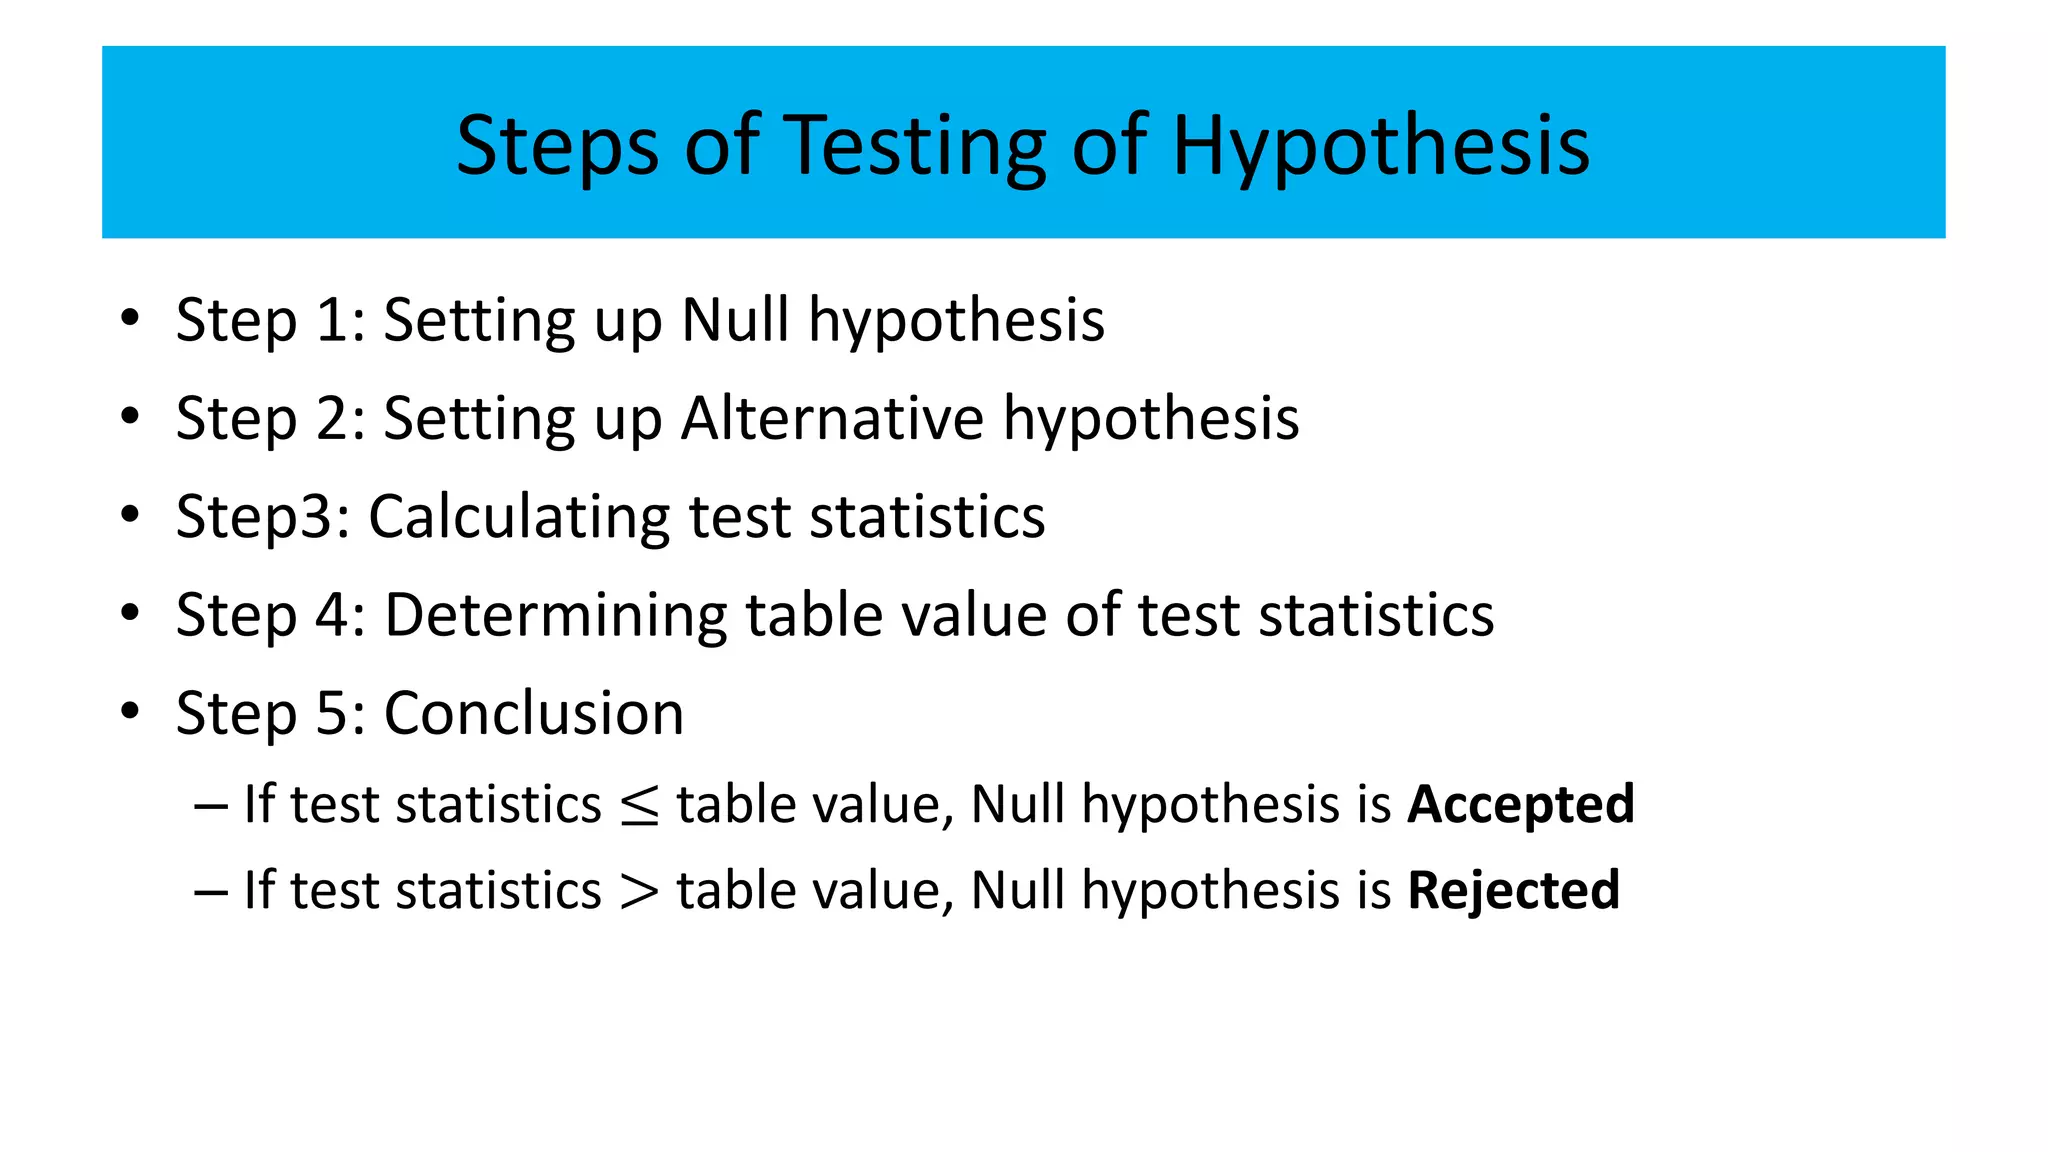
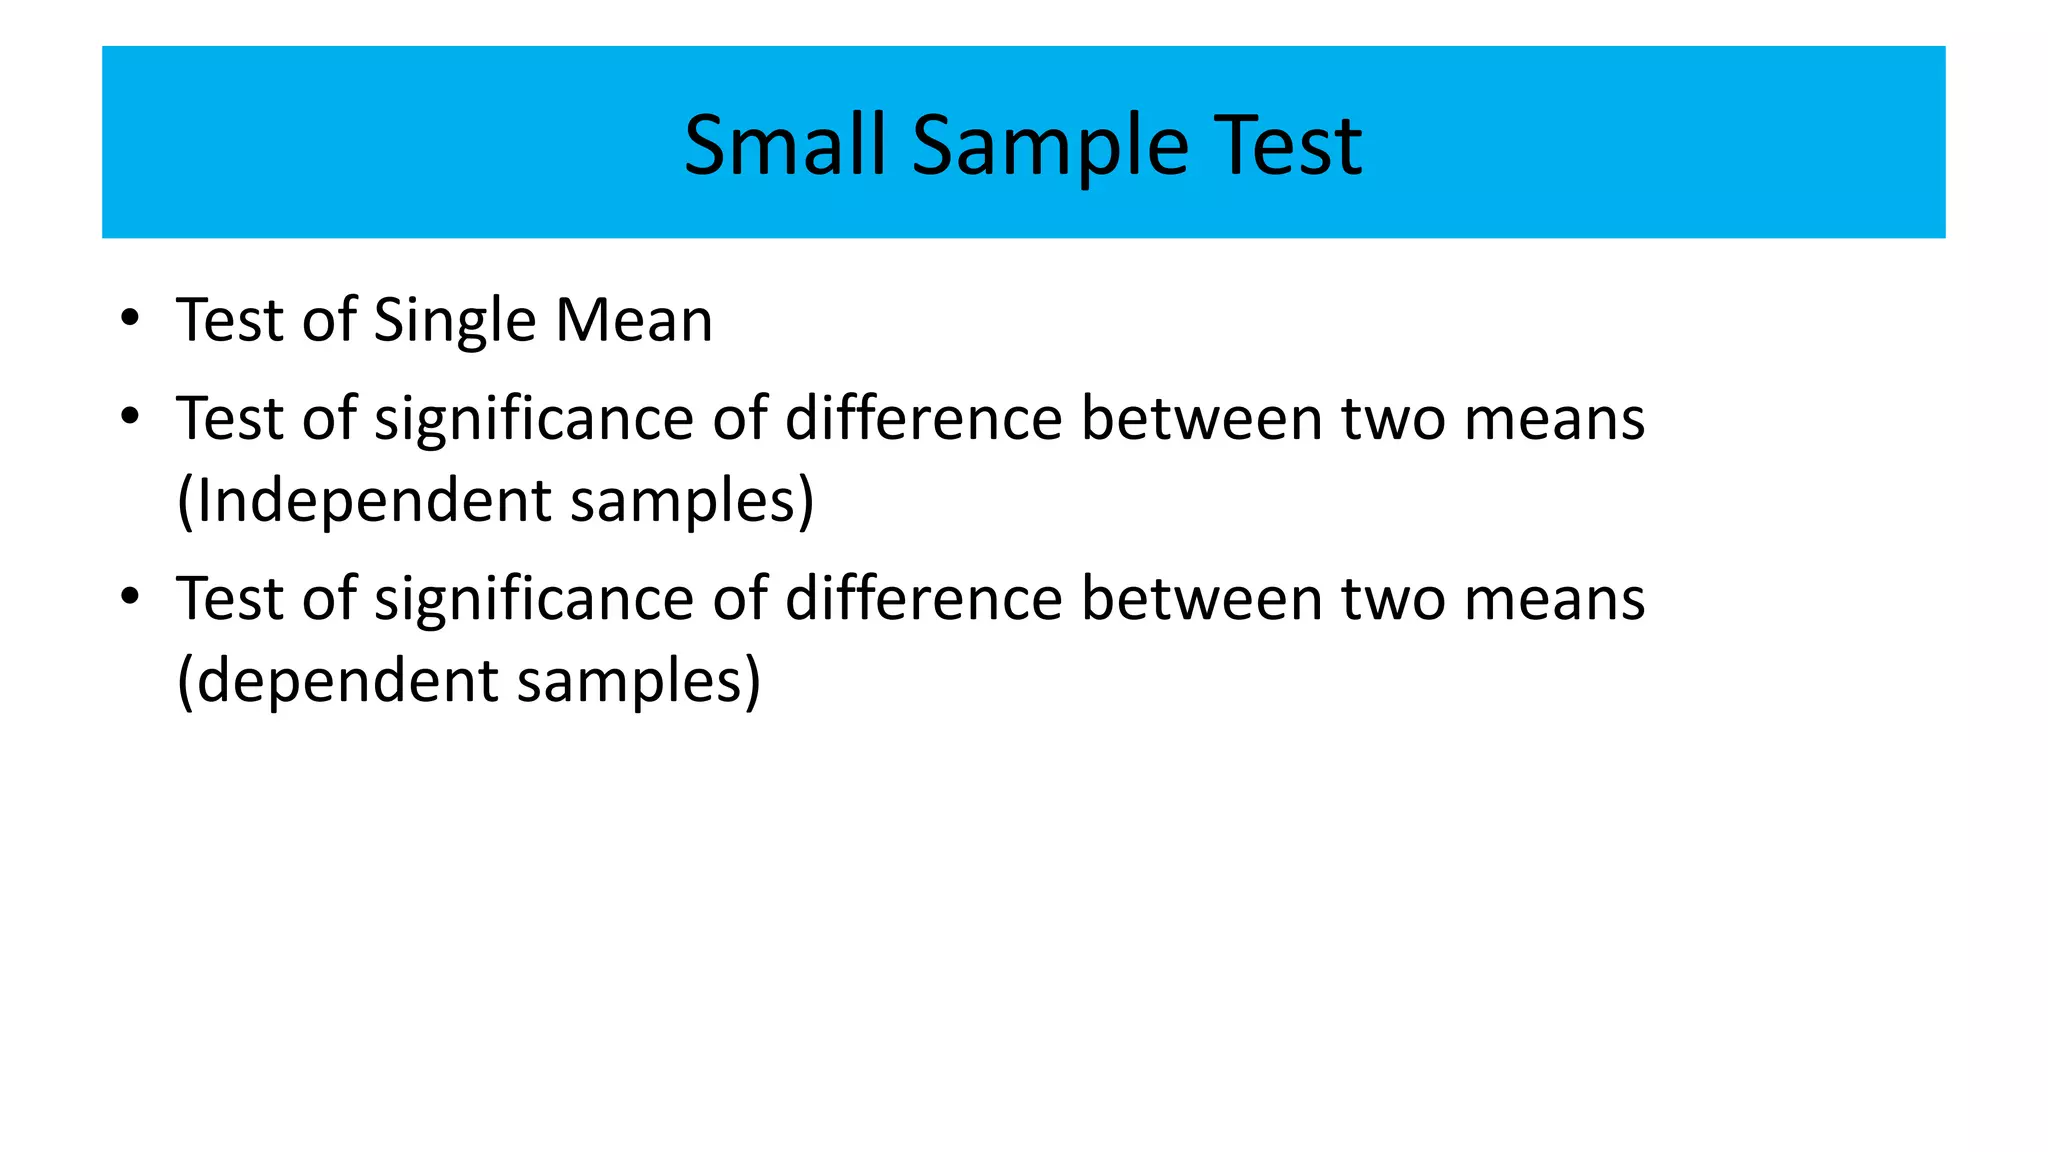
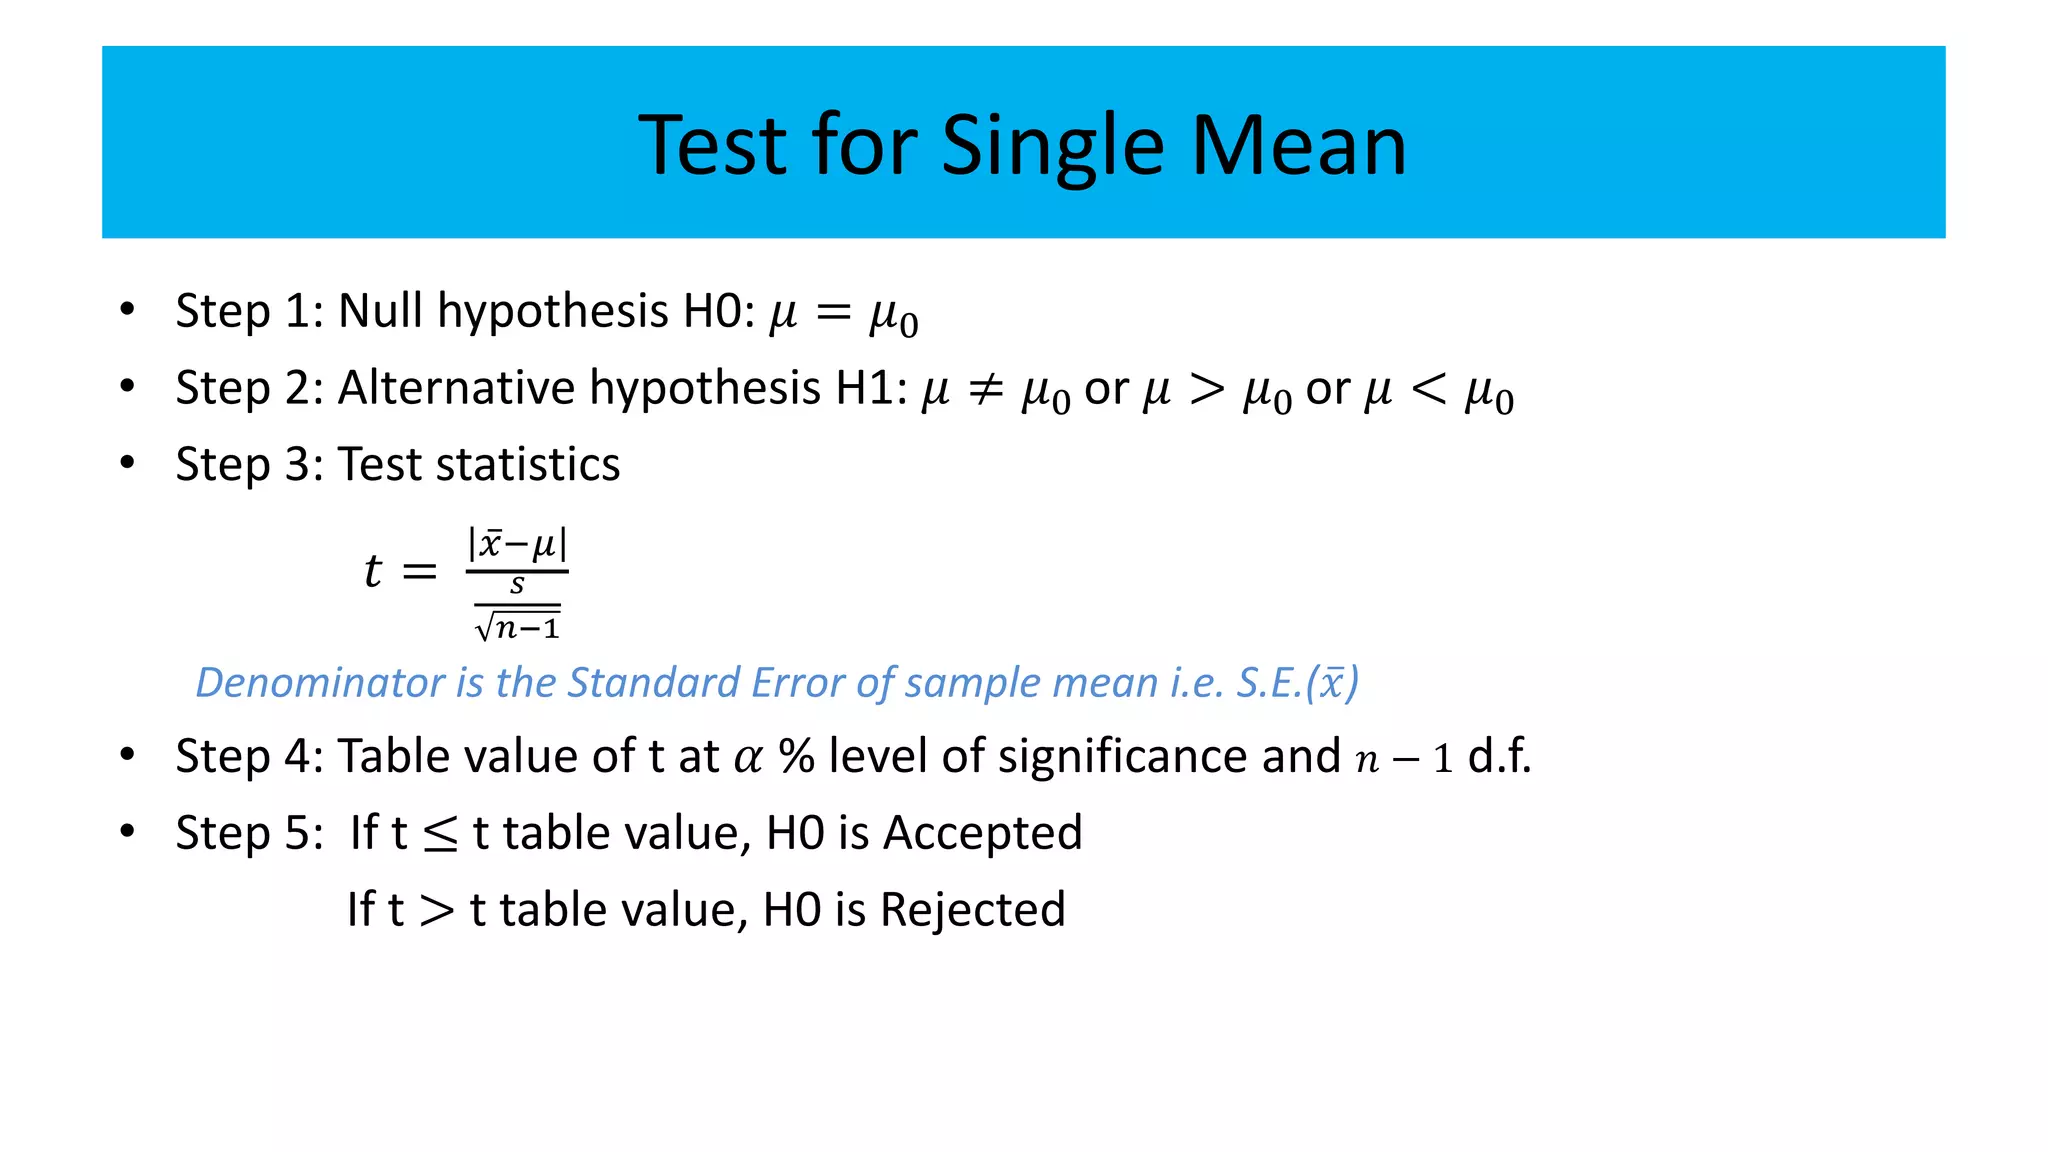
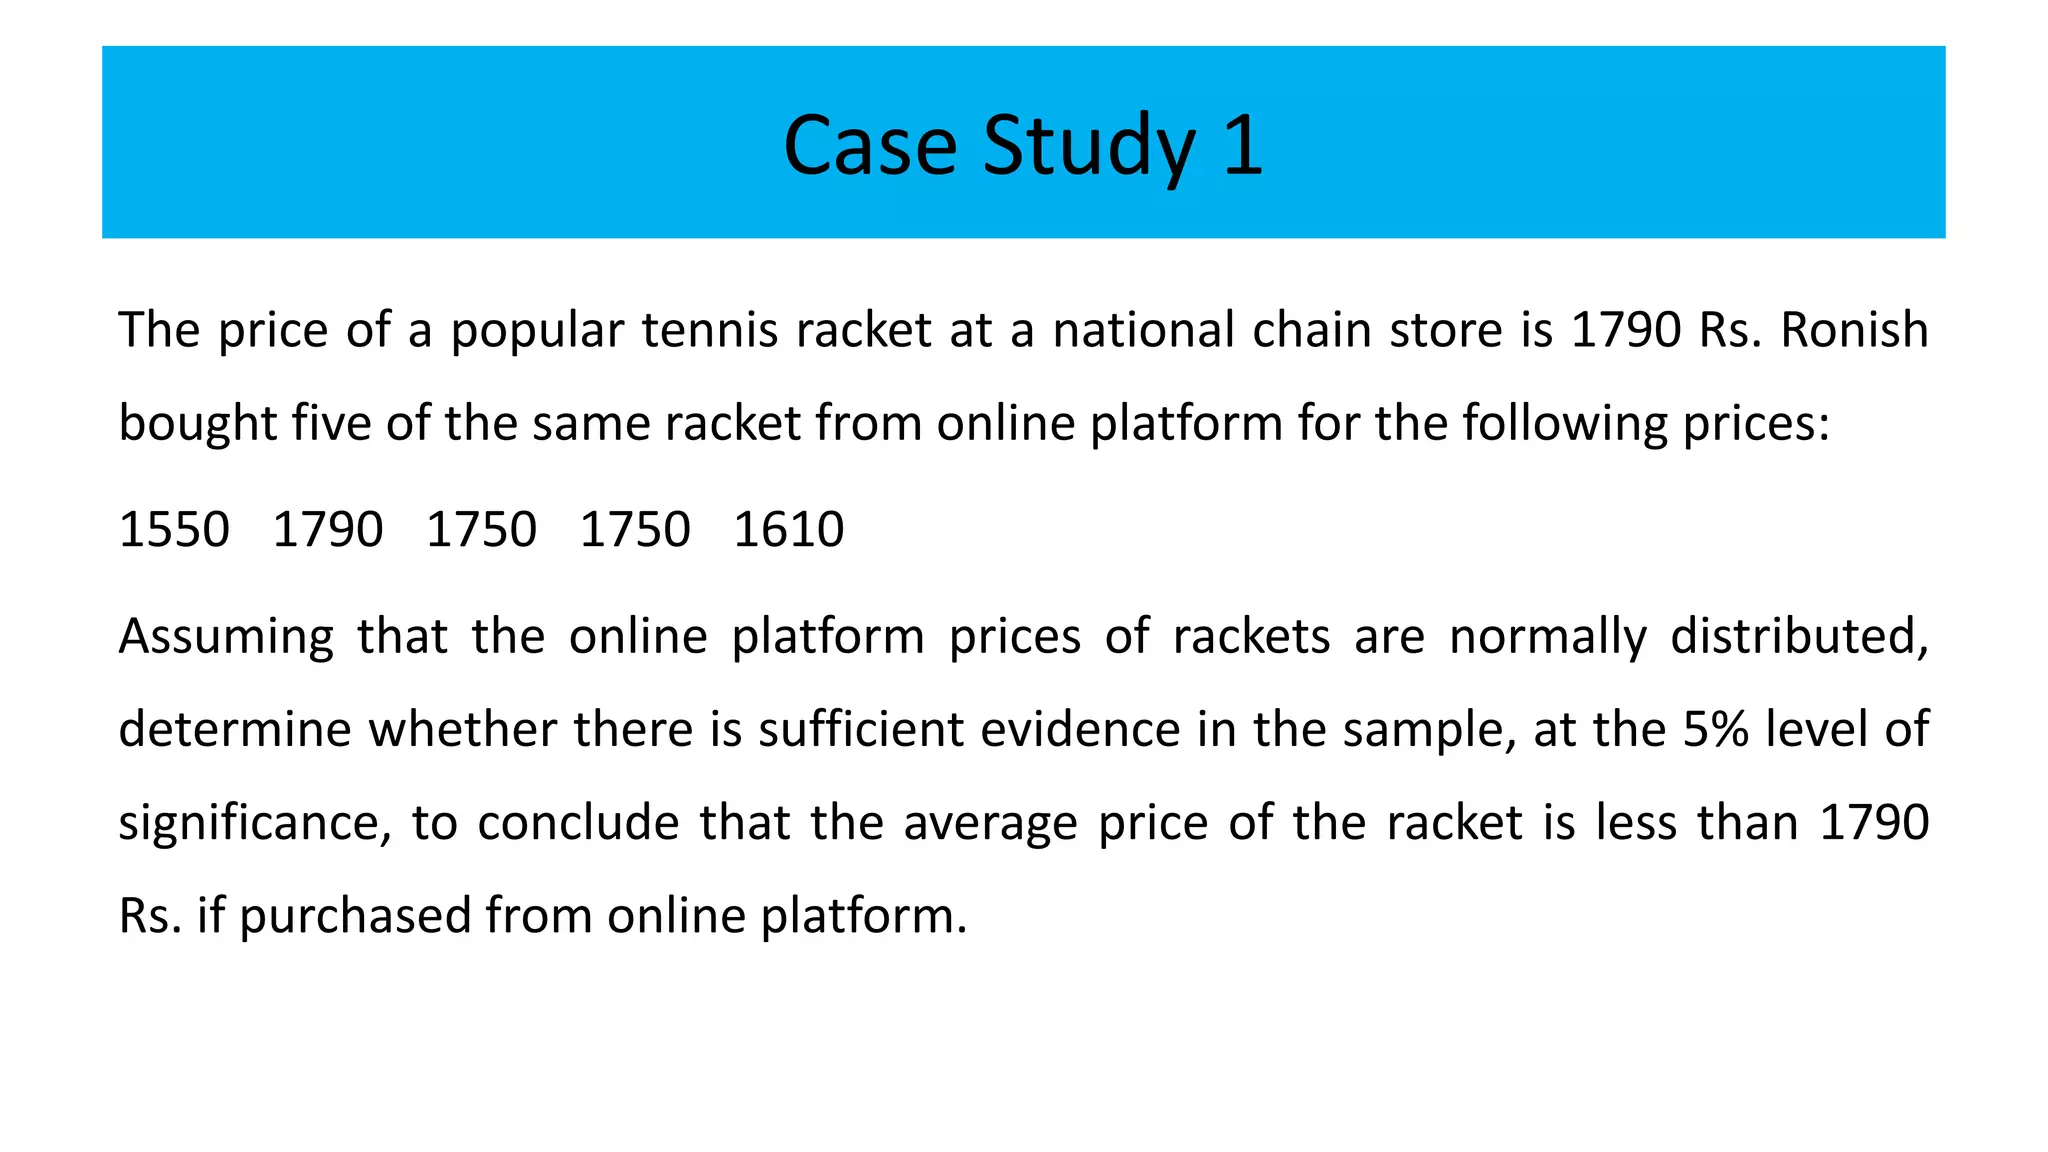
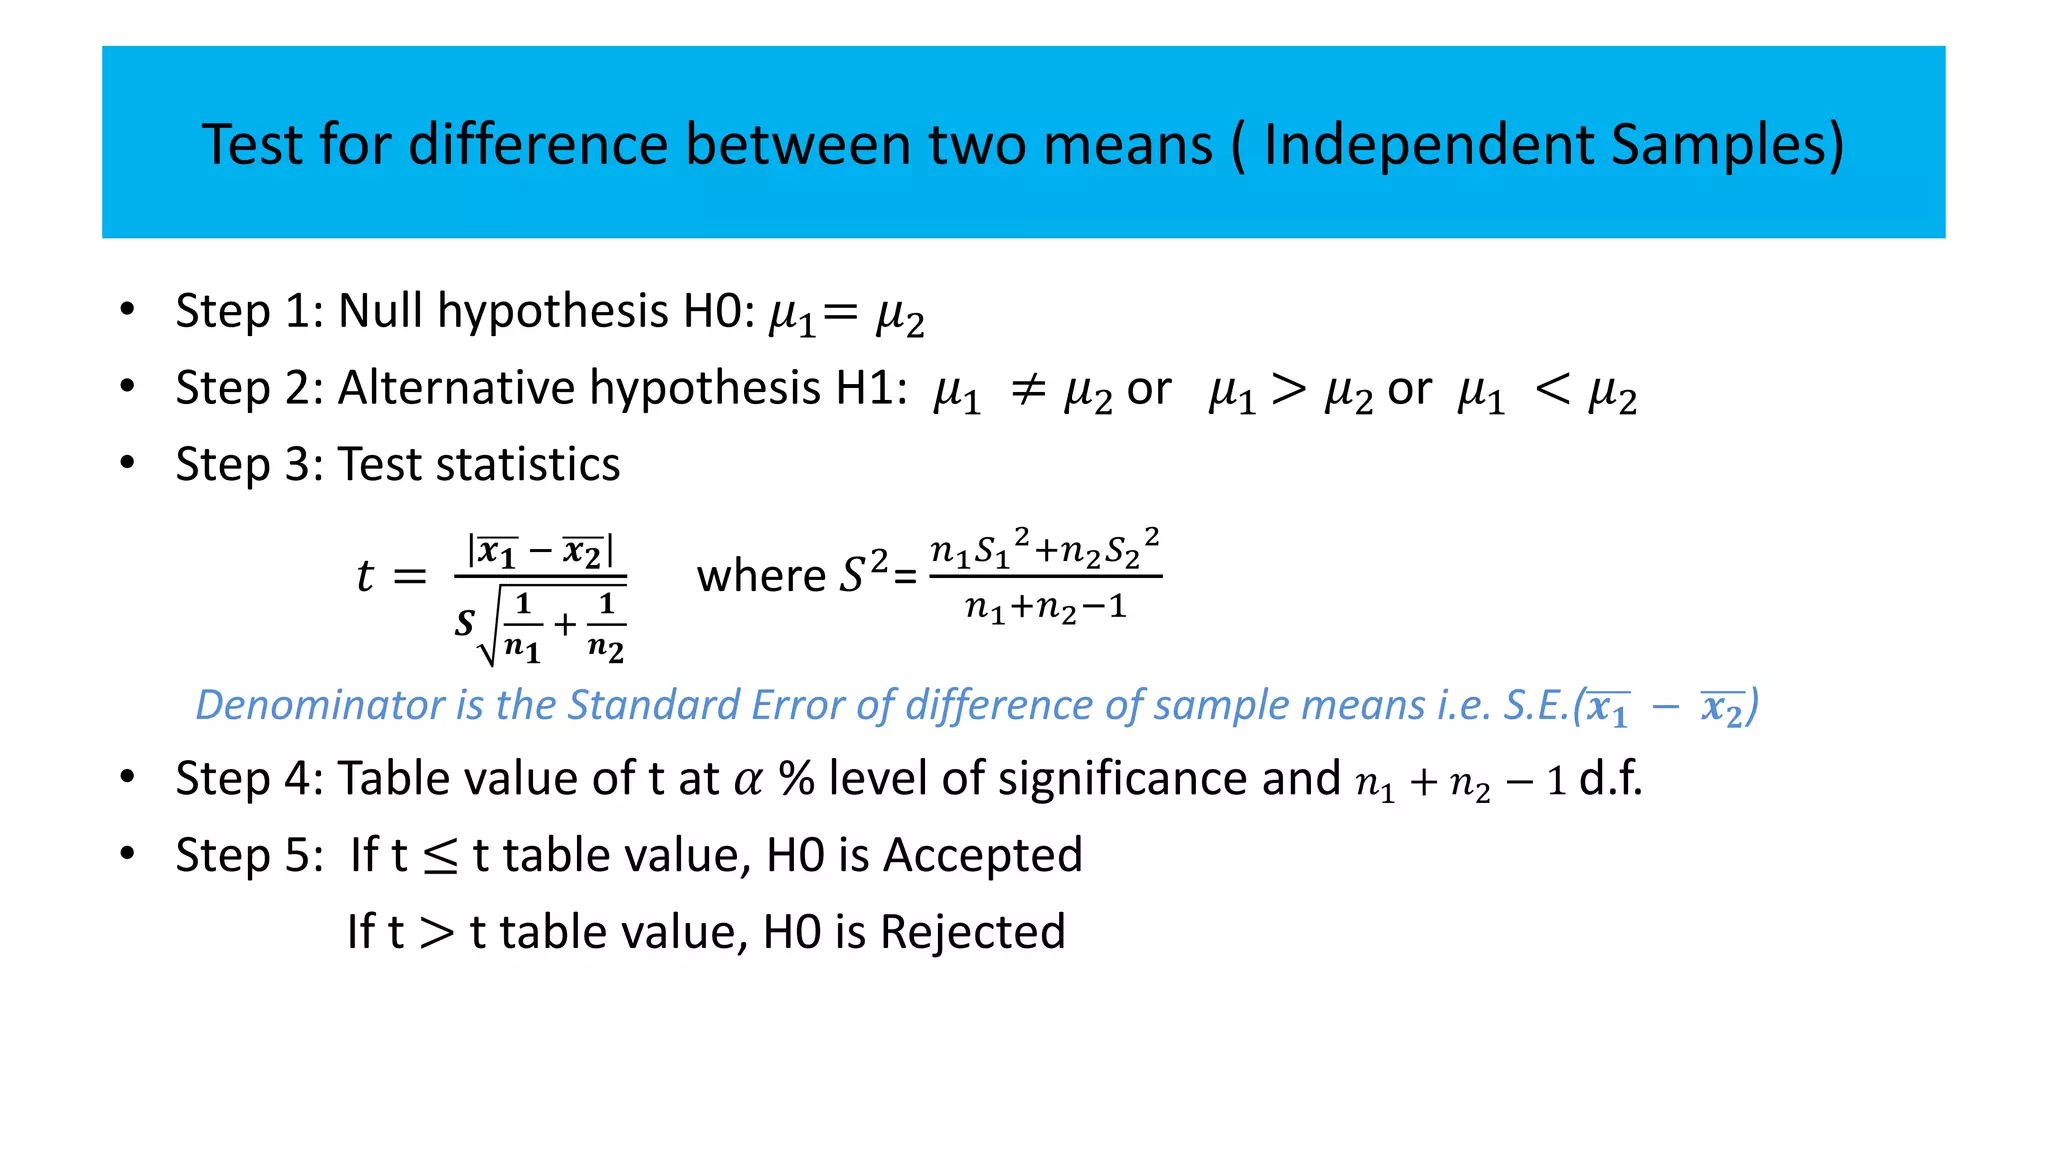
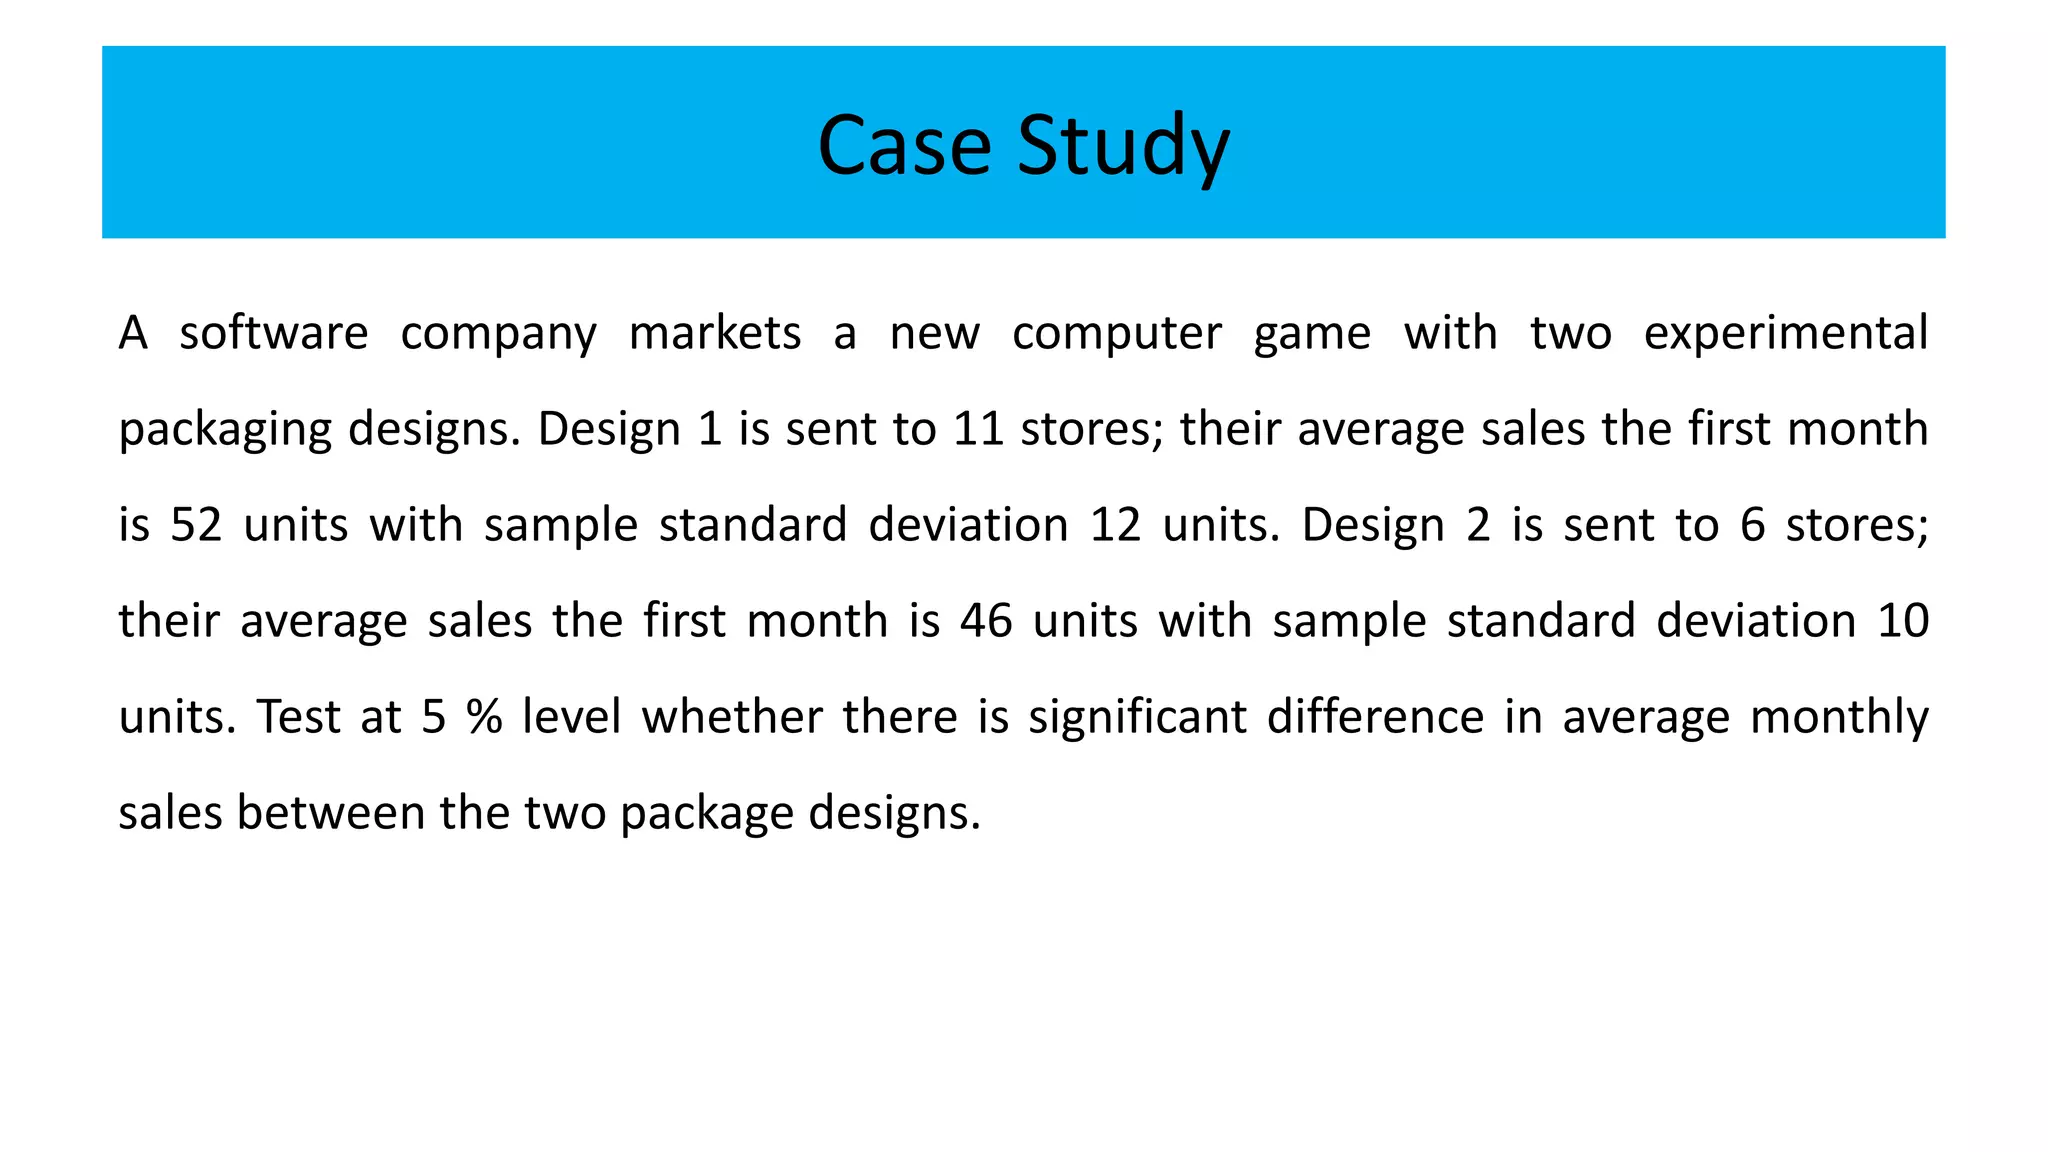
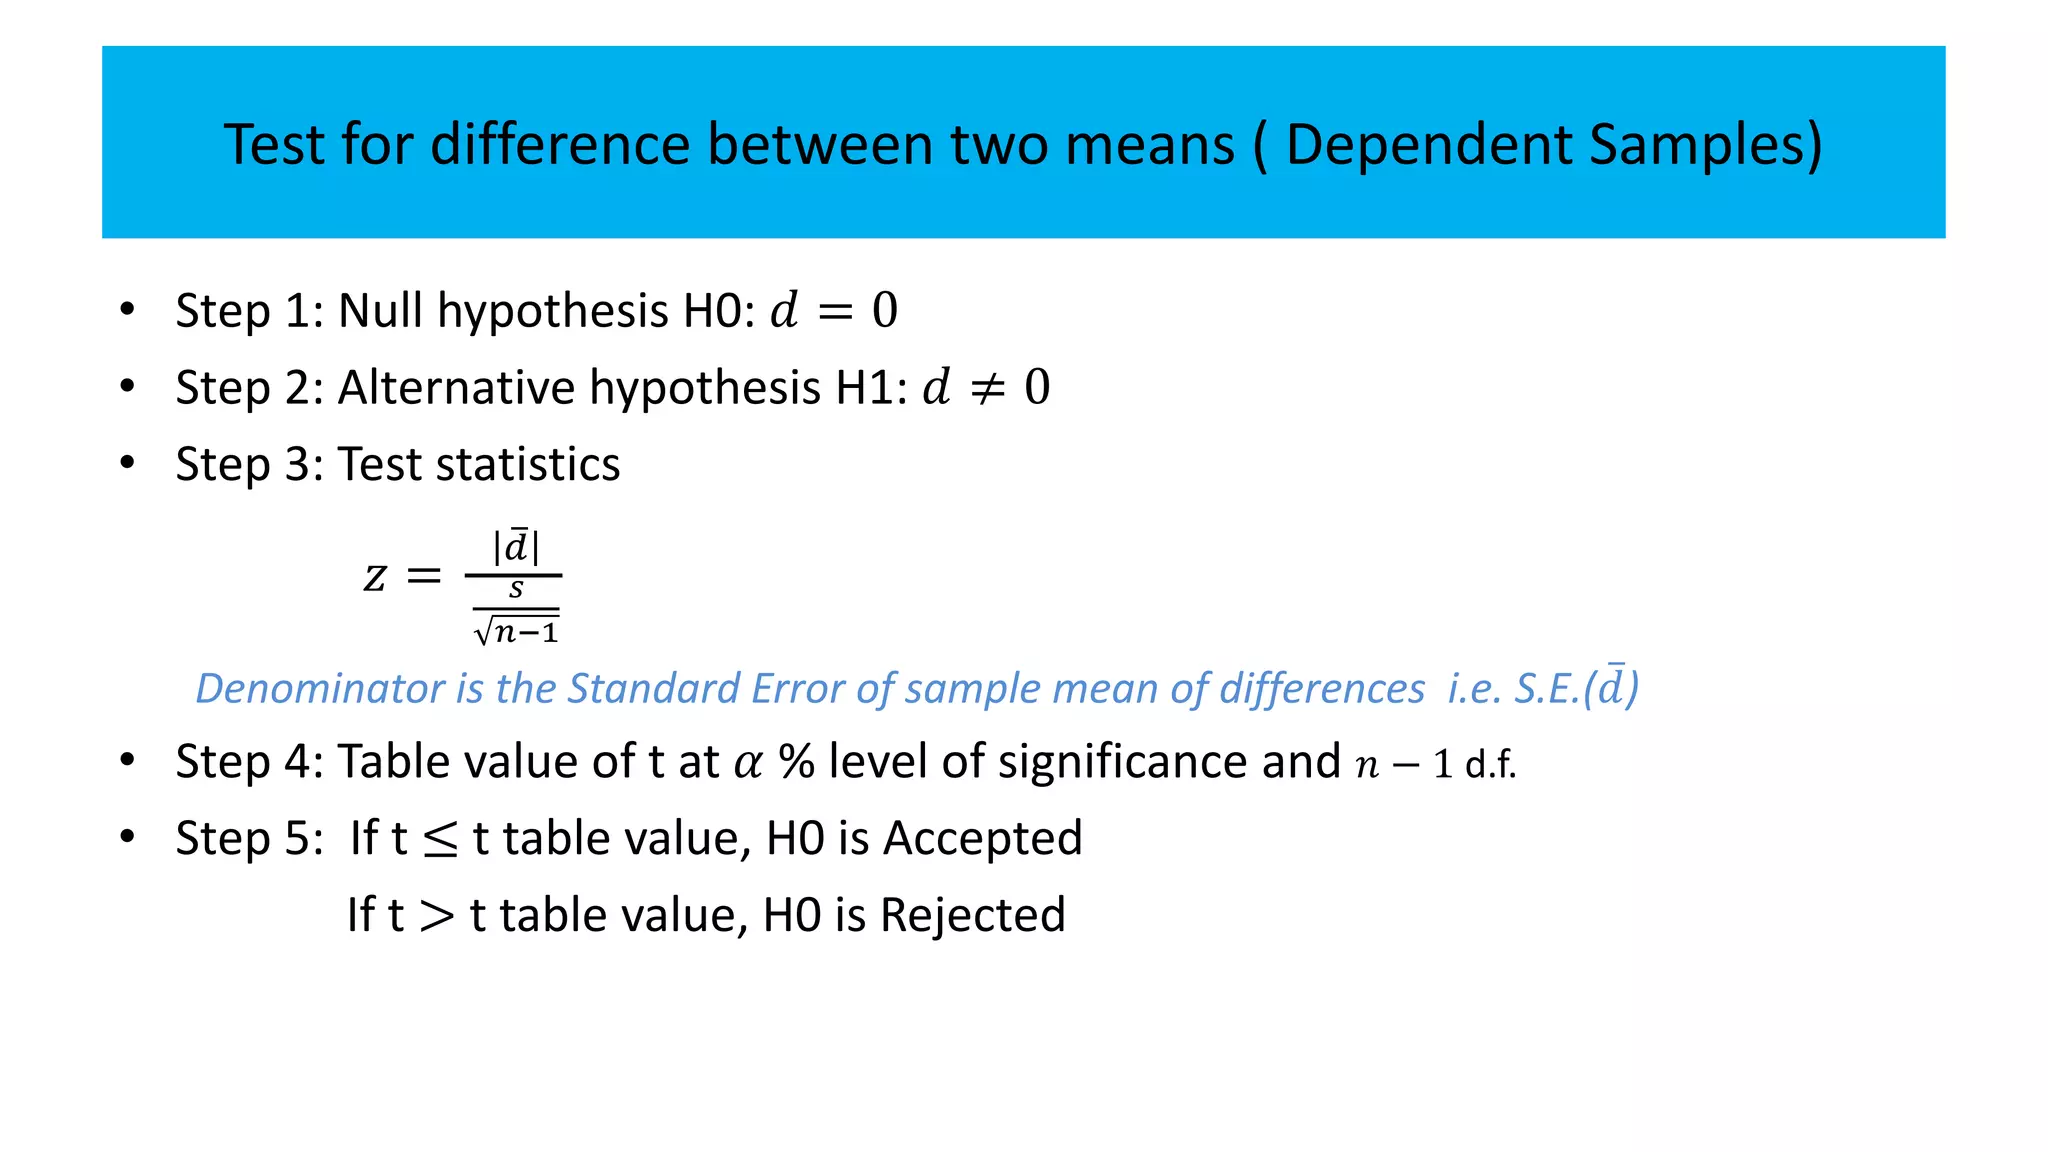
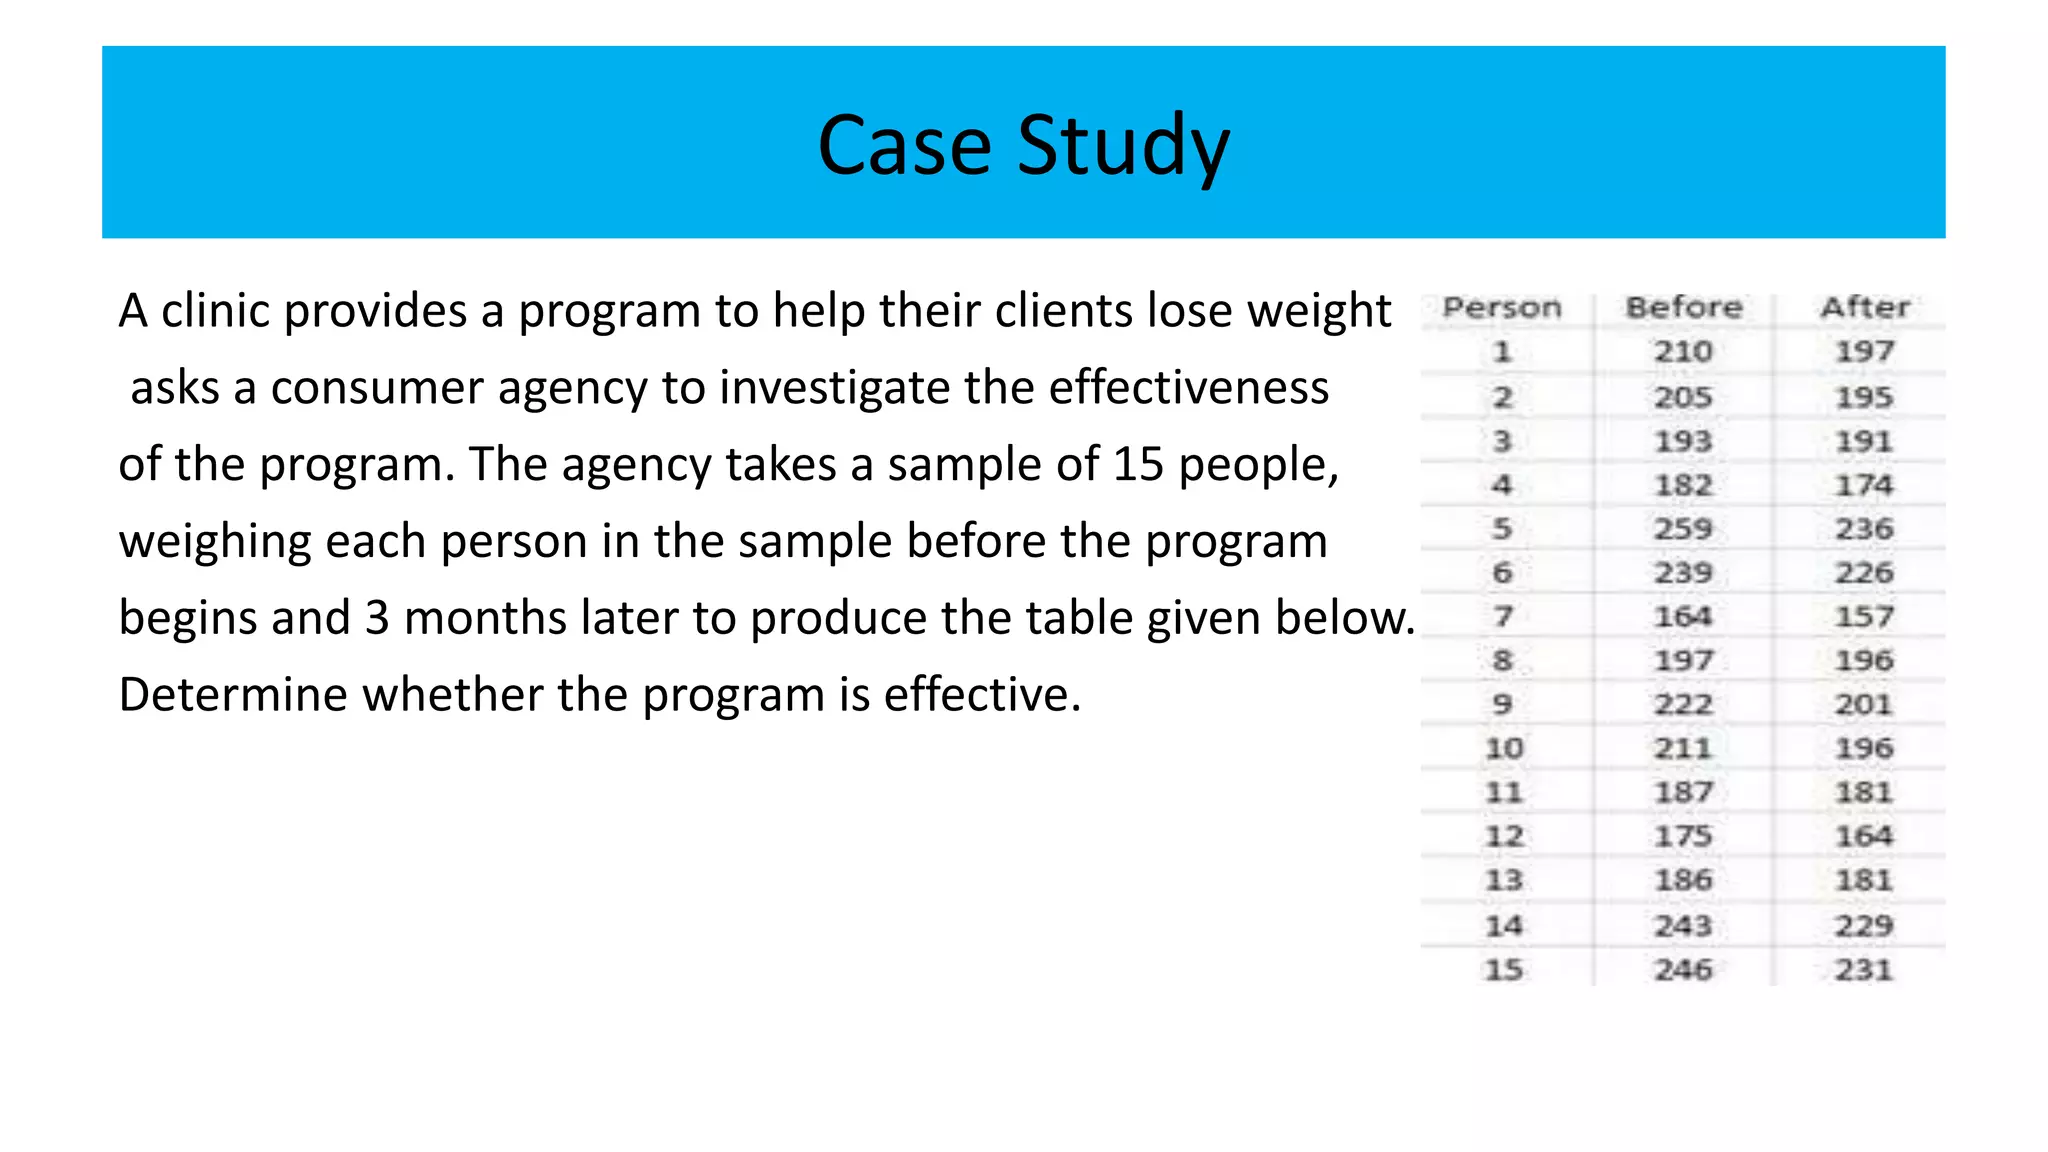
TESTING OF HYPOTHESIS
Parameter and Statistics
• A measure calculated from population data is called
Parameter.
• A measure calculated from sample data is called Statistic.
Parameter Statistic
Size N n
Mean μ x̄
Standard deviation σ s
Proportion P p
Correlation coefficient ρ r
TESTING OF HYPOTHESIS
Statistical Hypothesis
A Statistical hypothesis is an assumption or any logical statement
about the parameter of the population.
E.g.
• India will score on an average 300 runs in the next ODI series.
• The average marks obtained by students at Guj. Uni. in Statistics is
atleast 80.
• Proportion of diabetic patients in Gujarat is not more than 10 %
• Students of Guj. Uni. score better than students from other
universities
Null hypothesis
A statistical hypothesis which is written for the possible
acceptance is called Null hypothesis. It is denoted by H0.
• In Null hypothesis if the parameter assumes specific value then
it is called Simple hypothesis.
E.g. 𝜇 = 280, P=0.10
• In Null hypothesis if the parameter assumes set of values then
it is called Composite hypothesis.
E.g. 𝜇 ≥ 280, P ≤ 0.10
Alternative Hypothesis
A statistical hypothesis which is complementary to the Null
hypothesis is called Alternative hypothesis. It is denoted by H1.
Problem Statement Null hypothesis
(H0)
Alternative
hypothesis (H1)
India will score on an average 300 runs in the next ODI
series
𝜇 = 300 𝜇 ≠ 300
The average marks obtained by students at Guj Uni in
Statistics is atleast 80
𝜇 = 80 𝜇 < 80
Proportion of diabetic patients in Gujarat is not more than
10 %
P = 0.10 P > 0.10
Students of Guj Uni score better than students from other
Universities
𝜇1= 𝜇2 𝜇1> 𝜇2
Testing of Hypothesis
The procedure to decide whether to accept or reject the null
hypothesis is called Testing of hypothesis.
Test Statistics
If the sample size is more than or equal to 30, it is called a large
sample and if it is less than 30, it is called a small sample.
Different test statistic is used for testing of hypothesis based on
the size of the sample.
• For a large sample, test statistic z is used.
• For a small sample, test statistic t is used.
Steps of Testing of Hypothesis
• Step 1: Setting up Null hypothesis
• Step 2: Setting up Alternative hypothesis
• Step3: Calculating test statistics
• Step 4: Determining table value of test statistics
• Step 5: Conclusion
– If test statistics ≤ table value, Null hypothesis is Accepted
– If test statistics > table value, Null hypothesis is Rejected
Small Sample Test
• Test of Single Mean
• Test of significance of difference between two means
(Independent samples)
• Test of significance of difference between two means
(dependent samples)
Test for Single Mean
• Step 1: Null hypothesis H0: 𝜇 = 𝜇0
• Step 2: Alternative hypothesis H1: 𝜇 ≠ 𝜇0 or 𝜇 > 𝜇0 or 𝜇 < 𝜇0
• Step 3: Test statistics
𝑡 =
𝑥−𝜇
𝑠
𝑛−1
Denominator is the Standard Error of sample mean i.e. S.E.( 𝑥)
• Step 4: Table value of t at 𝛼 % level of significance and 𝑛 − 1 d.f.
• Step 5: If t ≤ t table value, H0 is Accepted
If t > t table value, H0 is Rejected
Case Study 1
The price of a popular tennis racket at a national chain store is 1790 Rs. Ronish
bought five of the same racket from online platform for the following prices:
1550 1790 1750 1750 1610
Assuming that the online platform prices of rackets are normally distributed,
determine whether there is sufficient evidence in the sample, at the 5% level of
significance, to conclude that the average price of the racket is less than 1790
Rs. if purchased from online platform.
Test for difference between two means ( Independent Samples)
• Step 1: Null hypothesis H0: 𝜇1= 𝜇2
• Step 2: Alternative hypothesis H1: 𝜇1 ≠ 𝜇2 or 𝜇1 > 𝜇2 or 𝜇1 < 𝜇2
• Step 3: Test statistics
𝑡 =
𝒙 𝟏 − 𝒙 𝟐
𝑺
𝟏
𝒏 𝟏
+
𝟏
𝒏 𝟐
where 𝑆2
=
𝑛1 𝑆1
2
+𝑛2 𝑆2
2
𝑛1+𝑛2−1
Denominator is the Standard Error of difference of sample means i.e. S.E.( 𝒙 𝟏 − 𝒙 𝟐)
• Step 4: Table value of t at 𝛼 % level of significance and 𝑛1 + 𝑛2 − 1 d.f.
• Step 5: If t ≤ t table value, H0 is Accepted
If t > t table value, H0 is Rejected
Case Study
A software company markets a new computer game with two experimental
packaging designs. Design 1 is sent to 11 stores; their average sales the first month
is 52 units with sample standard deviation 12 units. Design 2 is sent to 6 stores;
their average sales the first month is 46 units with sample standard deviation 10
units. Test at 5 % level whether there is significant difference in average monthly
sales between the two package designs.
Test for difference between two means ( Dependent Samples)
• Step 1: Null hypothesis H0: 𝑑 = 0
• Step 2: Alternative hypothesis H1: 𝑑 ≠ 0
• Step 3: Test statistics
𝑧 =
𝑑
𝑠
𝑛−1
Denominator is the Standard Error of sample mean of differences i.e. S.E.( 𝑑)
• Step 4: Table value of t at 𝛼 % level of significance and 𝑛 − 1 d.f.
• Step 5: If t ≤ t table value, H0 is Accepted
If t > t table value, H0 is Rejected
Case Study
A clinic provides a program to help their clients lose weight
asks a consumer agency to investigate the effectiveness
of the program. The agency takes a sample of 15 people,
weighing each person in the sample before the program
begins and 3 months later to produce the table given below.
Determine whether the program is effective.

Small sample test

  • 1.
  • 2.
    Parameter and Statistics •A measure calculated from population data is called Parameter. • A measure calculated from sample data is called Statistic. Parameter Statistic Size N n Mean μ x̄ Standard deviation σ s Proportion P p Correlation coefficient ρ r
  • 3.
  • 4.
    Statistical Hypothesis A Statisticalhypothesis is an assumption or any logical statement about the parameter of the population. E.g. • India will score on an average 300 runs in the next ODI series. • The average marks obtained by students at Guj. Uni. in Statistics is atleast 80. • Proportion of diabetic patients in Gujarat is not more than 10 % • Students of Guj. Uni. score better than students from other universities
  • 5.
    Null hypothesis A statisticalhypothesis which is written for the possible acceptance is called Null hypothesis. It is denoted by H0. • In Null hypothesis if the parameter assumes specific value then it is called Simple hypothesis. E.g. 𝜇 = 280, P=0.10 • In Null hypothesis if the parameter assumes set of values then it is called Composite hypothesis. E.g. 𝜇 ≥ 280, P ≤ 0.10
  • 6.
    Alternative Hypothesis A statisticalhypothesis which is complementary to the Null hypothesis is called Alternative hypothesis. It is denoted by H1.
  • 7.
    Problem Statement Nullhypothesis (H0) Alternative hypothesis (H1) India will score on an average 300 runs in the next ODI series 𝜇 = 300 𝜇 ≠ 300 The average marks obtained by students at Guj Uni in Statistics is atleast 80 𝜇 = 80 𝜇 < 80 Proportion of diabetic patients in Gujarat is not more than 10 % P = 0.10 P > 0.10 Students of Guj Uni score better than students from other Universities 𝜇1= 𝜇2 𝜇1> 𝜇2
  • 8.
    Testing of Hypothesis Theprocedure to decide whether to accept or reject the null hypothesis is called Testing of hypothesis.
  • 9.
    Test Statistics If thesample size is more than or equal to 30, it is called a large sample and if it is less than 30, it is called a small sample. Different test statistic is used for testing of hypothesis based on the size of the sample. • For a large sample, test statistic z is used. • For a small sample, test statistic t is used.
  • 10.
    Steps of Testingof Hypothesis • Step 1: Setting up Null hypothesis • Step 2: Setting up Alternative hypothesis • Step3: Calculating test statistics • Step 4: Determining table value of test statistics • Step 5: Conclusion – If test statistics ≤ table value, Null hypothesis is Accepted – If test statistics > table value, Null hypothesis is Rejected
  • 12.
    Small Sample Test •Test of Single Mean • Test of significance of difference between two means (Independent samples) • Test of significance of difference between two means (dependent samples)
  • 13.
    Test for SingleMean • Step 1: Null hypothesis H0: 𝜇 = 𝜇0 • Step 2: Alternative hypothesis H1: 𝜇 ≠ 𝜇0 or 𝜇 > 𝜇0 or 𝜇 < 𝜇0 • Step 3: Test statistics 𝑡 = 𝑥−𝜇 𝑠 𝑛−1 Denominator is the Standard Error of sample mean i.e. S.E.( 𝑥) • Step 4: Table value of t at 𝛼 % level of significance and 𝑛 − 1 d.f. • Step 5: If t ≤ t table value, H0 is Accepted If t > t table value, H0 is Rejected
  • 14.
    Case Study 1 Theprice of a popular tennis racket at a national chain store is 1790 Rs. Ronish bought five of the same racket from online platform for the following prices: 1550 1790 1750 1750 1610 Assuming that the online platform prices of rackets are normally distributed, determine whether there is sufficient evidence in the sample, at the 5% level of significance, to conclude that the average price of the racket is less than 1790 Rs. if purchased from online platform.
  • 15.
    Test for differencebetween two means ( Independent Samples) • Step 1: Null hypothesis H0: 𝜇1= 𝜇2 • Step 2: Alternative hypothesis H1: 𝜇1 ≠ 𝜇2 or 𝜇1 > 𝜇2 or 𝜇1 < 𝜇2 • Step 3: Test statistics 𝑡 = 𝒙 𝟏 − 𝒙 𝟐 𝑺 𝟏 𝒏 𝟏 + 𝟏 𝒏 𝟐 where 𝑆2 = 𝑛1 𝑆1 2 +𝑛2 𝑆2 2 𝑛1+𝑛2−1 Denominator is the Standard Error of difference of sample means i.e. S.E.( 𝒙 𝟏 − 𝒙 𝟐) • Step 4: Table value of t at 𝛼 % level of significance and 𝑛1 + 𝑛2 − 1 d.f. • Step 5: If t ≤ t table value, H0 is Accepted If t > t table value, H0 is Rejected
  • 16.
    Case Study A softwarecompany markets a new computer game with two experimental packaging designs. Design 1 is sent to 11 stores; their average sales the first month is 52 units with sample standard deviation 12 units. Design 2 is sent to 6 stores; their average sales the first month is 46 units with sample standard deviation 10 units. Test at 5 % level whether there is significant difference in average monthly sales between the two package designs.
  • 17.
    Test for differencebetween two means ( Dependent Samples) • Step 1: Null hypothesis H0: 𝑑 = 0 • Step 2: Alternative hypothesis H1: 𝑑 ≠ 0 • Step 3: Test statistics 𝑧 = 𝑑 𝑠 𝑛−1 Denominator is the Standard Error of sample mean of differences i.e. S.E.( 𝑑) • Step 4: Table value of t at 𝛼 % level of significance and 𝑛 − 1 d.f. • Step 5: If t ≤ t table value, H0 is Accepted If t > t table value, H0 is Rejected
  • 18.
    Case Study A clinicprovides a program to help their clients lose weight asks a consumer agency to investigate the effectiveness of the program. The agency takes a sample of 15 people, weighing each person in the sample before the program begins and 3 months later to produce the table given below. Determine whether the program is effective.