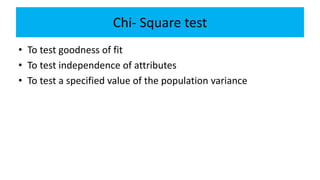
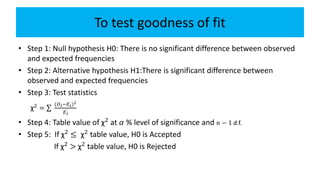
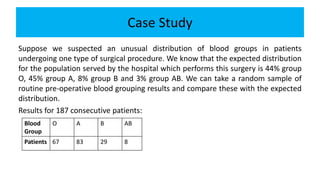
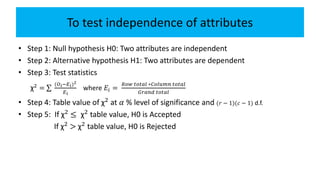
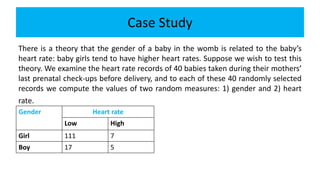
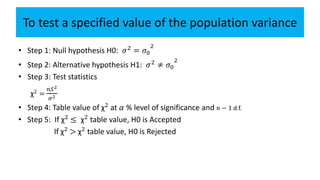
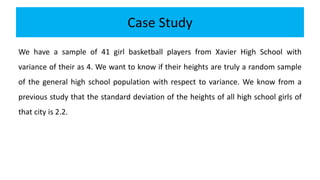
TESTING OF HYPOTHESIS
CHI-SQUARE TESTS
Chi- Square test
• To test goodness of fit
• To test independence of attributes
• To test a specified value of the population variance
To test goodness of fit
• Step 1: Null hypothesis H0: There is no significant difference between observed
and expected frequencies
• Step 2: Alternative hypothesis H1:There is significant difference between
observed and expected frequencies
• Step 3: Test statistics
χ2 =
(𝑂 𝑖−𝐸 𝑖)2
𝐸 𝑖
• Step 4: Table value of χ2
at 𝛼 % level of significance and 𝑛 − 1 d.f.
• Step 5: If χ2
≤ χ2
table value, H0 is Accepted
If χ2 > χ2 table value, H0 is Rejected
Case Study
Suppose we suspected an unusual distribution of blood groups in patients
undergoing one type of surgical procedure. We know that the expected distribution
for the population served by the hospital which performs this surgery is 44% group
O, 45% group A, 8% group B and 3% group AB. We can take a random sample of
routine pre-operative blood grouping results and compare these with the expected
distribution.
Results for 187 consecutive patients:
Blood
Group
O A B AB
Patients 67 83 29 8
To test independence of attributes
• Step 1: Null hypothesis H0: Two attributes are independent
• Step 2: Alternative hypothesis H1: Two attributes are dependent
• Step 3: Test statistics
χ2
=
(𝑂 𝑖−𝐸 𝑖)2
𝐸 𝑖
where 𝐸𝑖 =
𝑅𝑜𝑤 𝑡𝑜𝑡𝑎𝑙 ∗𝐶𝑜𝑙𝑢𝑚𝑛 𝑡𝑜𝑡𝑎𝑙
𝐺𝑟𝑎𝑛𝑑 𝑡𝑜𝑡𝑎𝑙
• Step 4: Table value of χ2
at 𝛼 % level of significance and (𝑟 − 1)(𝑐 − 1) d.f.
• Step 5: If χ2
≤ χ2
table value, H0 is Accepted
If χ2
> χ2
table value, H0 is Rejected
Case Study
There is a theory that the gender of a baby in the womb is related to the baby’s
heart rate: baby girls tend to have higher heart rates. Suppose we wish to test this
theory. We examine the heart rate records of 40 babies taken during their mothers’
last prenatal check-ups before delivery, and to each of these 40 randomly selected
records we compute the values of two random measures: 1) gender and 2) heart
rate.
Gender Heart rate
Low High
Girl 111 7
Boy 17 5
To test a specified value of the population variance
• Step 1: Null hypothesis H0: 𝜎2
= 𝜎0
2
• Step 2: Alternative hypothesis H1: 𝜎2 ≠ 𝜎0
2
• Step 3: Test statistics
χ2
=
𝑛𝑆2
𝜎2
• Step 4: Table value of χ2
at 𝛼 % level of significance and 𝑛 − 1 d.f.
• Step 5: If χ2
≤ χ2
table value, H0 is Accepted
If χ2
> χ2
table value, H0 is Rejected
Case Study
We have a sample of 41 girl basketball players from Xavier High School with
variance of their as 4. We want to know if their heights are truly a random sample
of the general high school population with respect to variance. We know from a
previous study that the standard deviation of the heights of all high school girls of
that city is 2.2.

Testing of hypothesis - Chi-Square test

  • 1.
  • 2.
    Chi- Square test •To test goodness of fit • To test independence of attributes • To test a specified value of the population variance
  • 4.
    To test goodnessof fit • Step 1: Null hypothesis H0: There is no significant difference between observed and expected frequencies • Step 2: Alternative hypothesis H1:There is significant difference between observed and expected frequencies • Step 3: Test statistics χ2 = (𝑂 𝑖−𝐸 𝑖)2 𝐸 𝑖 • Step 4: Table value of χ2 at 𝛼 % level of significance and 𝑛 − 1 d.f. • Step 5: If χ2 ≤ χ2 table value, H0 is Accepted If χ2 > χ2 table value, H0 is Rejected
  • 5.
    Case Study Suppose wesuspected an unusual distribution of blood groups in patients undergoing one type of surgical procedure. We know that the expected distribution for the population served by the hospital which performs this surgery is 44% group O, 45% group A, 8% group B and 3% group AB. We can take a random sample of routine pre-operative blood grouping results and compare these with the expected distribution. Results for 187 consecutive patients: Blood Group O A B AB Patients 67 83 29 8
  • 6.
    To test independenceof attributes • Step 1: Null hypothesis H0: Two attributes are independent • Step 2: Alternative hypothesis H1: Two attributes are dependent • Step 3: Test statistics χ2 = (𝑂 𝑖−𝐸 𝑖)2 𝐸 𝑖 where 𝐸𝑖 = 𝑅𝑜𝑤 𝑡𝑜𝑡𝑎𝑙 ∗𝐶𝑜𝑙𝑢𝑚𝑛 𝑡𝑜𝑡𝑎𝑙 𝐺𝑟𝑎𝑛𝑑 𝑡𝑜𝑡𝑎𝑙 • Step 4: Table value of χ2 at 𝛼 % level of significance and (𝑟 − 1)(𝑐 − 1) d.f. • Step 5: If χ2 ≤ χ2 table value, H0 is Accepted If χ2 > χ2 table value, H0 is Rejected
  • 7.
    Case Study There isa theory that the gender of a baby in the womb is related to the baby’s heart rate: baby girls tend to have higher heart rates. Suppose we wish to test this theory. We examine the heart rate records of 40 babies taken during their mothers’ last prenatal check-ups before delivery, and to each of these 40 randomly selected records we compute the values of two random measures: 1) gender and 2) heart rate. Gender Heart rate Low High Girl 111 7 Boy 17 5
  • 8.
    To test aspecified value of the population variance • Step 1: Null hypothesis H0: 𝜎2 = 𝜎0 2 • Step 2: Alternative hypothesis H1: 𝜎2 ≠ 𝜎0 2 • Step 3: Test statistics χ2 = 𝑛𝑆2 𝜎2 • Step 4: Table value of χ2 at 𝛼 % level of significance and 𝑛 − 1 d.f. • Step 5: If χ2 ≤ χ2 table value, H0 is Accepted If χ2 > χ2 table value, H0 is Rejected
  • 9.
    Case Study We havea sample of 41 girl basketball players from Xavier High School with variance of their as 4. We want to know if their heights are truly a random sample of the general high school population with respect to variance. We know from a previous study that the standard deviation of the heights of all high school girls of that city is 2.2.