Download as PDF, PPTX


![Parameters
Prog. type
Wald
df
Sig.
Intercept
1.689
1.896
1
.169
Write
‐.058
7.320
1
.007
.944
[ses=1]
1.163
5.114
1
.024
3.199
[ses=2]
.630
1.833
1
.176
1.877
[ses=3]
General
B
Exp(B)
0
0
Intercept
12.361
1
.000
Write
‐.114
26.139
1
.000
.893
[ses=1]
Vocation
4.236
.983
2.722
1
.099
2.672
[ses=2]
1.274
6.214
1
.013
3.575
[ses=3]
0
0](https://image.slidesharecdn.com/logisticregression-131205062151-phpapp01/85/Logistic-Regression-Analysis-13-320.jpg)
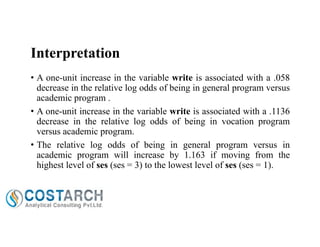


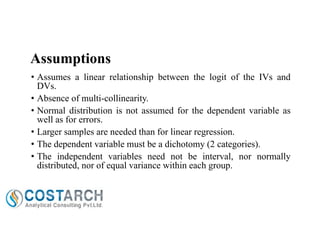
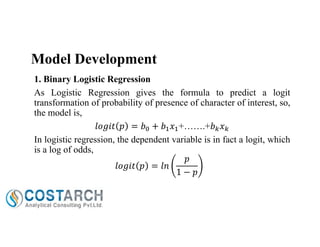
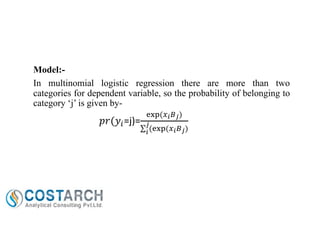
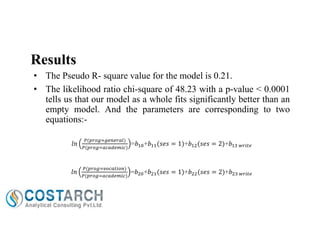
Logistic regression is a statistical method used to predict a binary or categorical dependent variable from continuous or categorical independent variables. It generates coefficients to predict the log odds of an outcome being present or absent. The method assumes a linear relationship between the log odds and independent variables. Multinomial logistic regression extends this to dependent variables with more than two categories. An example analyzes high school student program choices using writing scores and socioeconomic status as predictors. The model fits significantly better than an intercept-only model. Increases in writing score decrease the log odds of general versus academic programs.