Here are the steps to solve the problem:
1. Calculate the cumulative frequency:
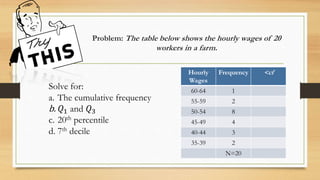
<cf for 60-64 = 1
<cf for 55-59 = 1 + 2 = 3
<cf for 50-54 = 3 + 8 = 11
<cf for 45-49 = 11 + 4 = 15
<cf for 40-44 = 15 + 3 = 18
<cf for 35-39 = 18 + 2 = 20
2. Find Q1, Q3 and 20th percentile:
a. Q1 = 50 + (4)(20)/4 - 11/8 = 47.5
b. Q3 = 50 + (12)(20)/4 - 11/12 = 52.