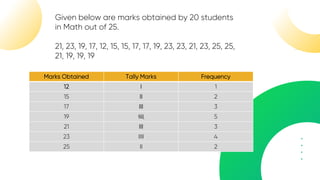
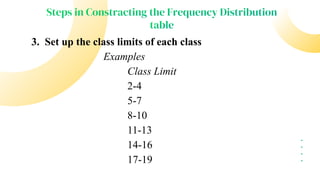
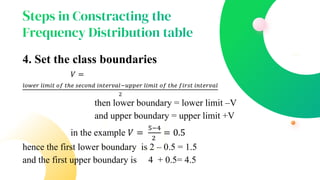
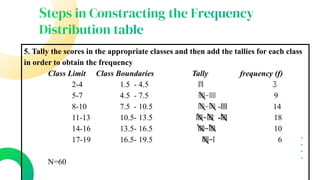
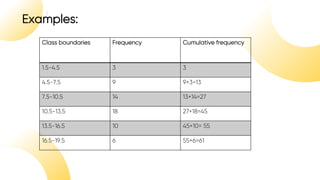
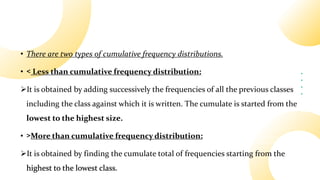
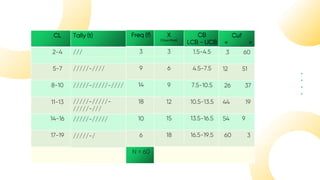
Presentations are communication tools that can be used as speeches, reports, and more. They are often presented before an audience. A frequency distribution shows how often values occur in a data set and can be displayed graphically or in a table. It has columns for the values, tally marks of each value, and the frequency. A cumulative frequency distribution adds up the frequencies of prior classes to show the accumulating total from lowest to highest values. Relative frequency divides each frequency by the total values and converts it to a percentage to compare frequencies.