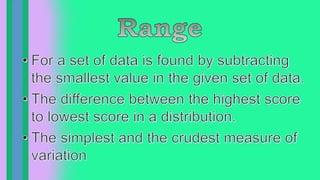
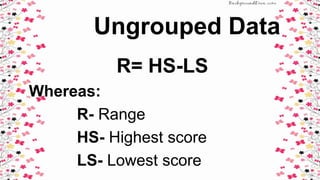
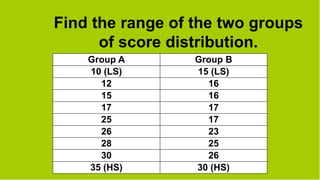
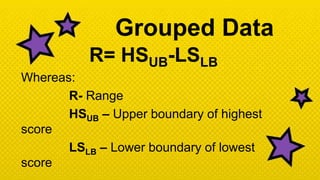
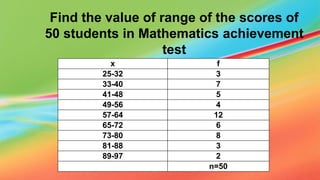
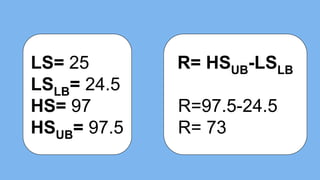
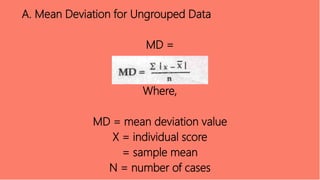
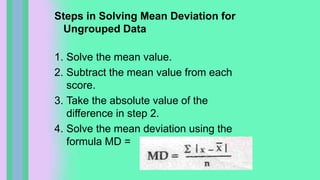
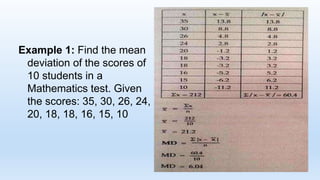
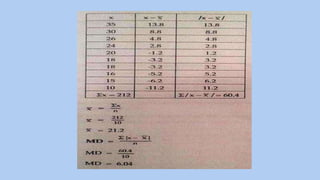
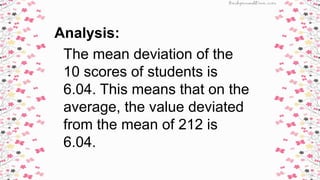
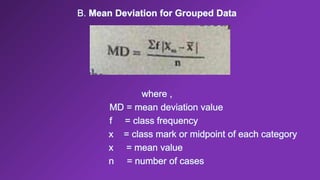
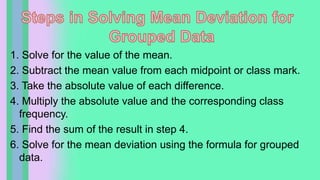
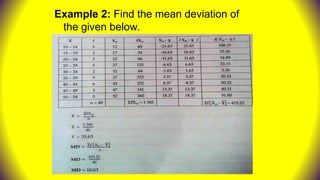
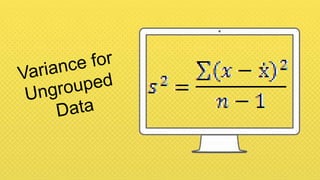
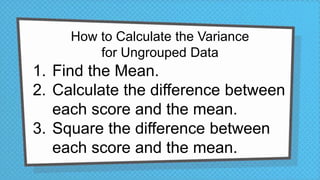
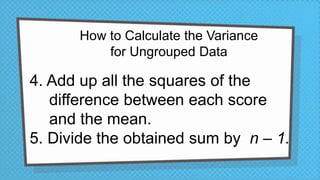
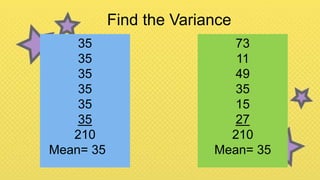
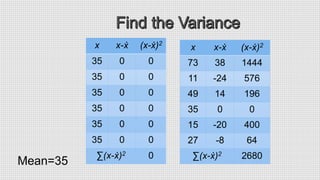
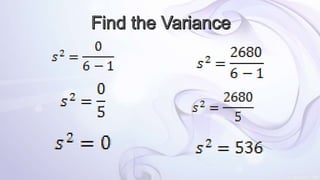
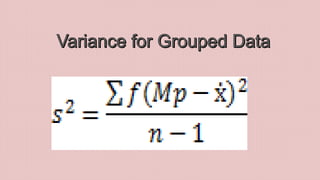
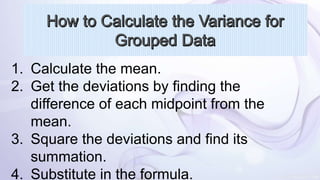
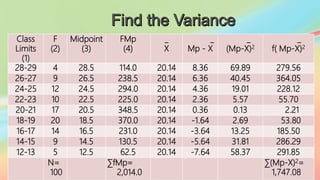
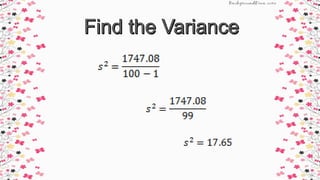
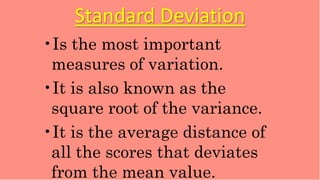
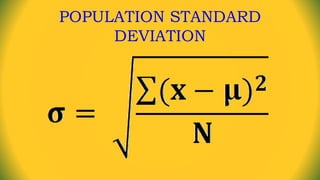
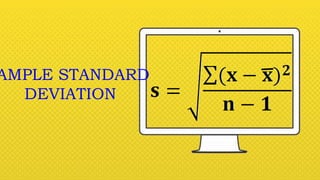
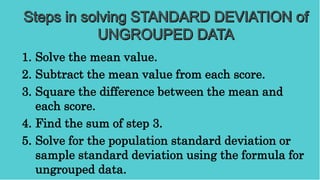
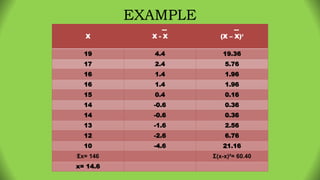
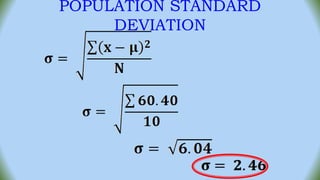
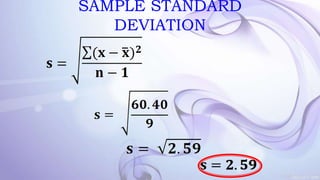
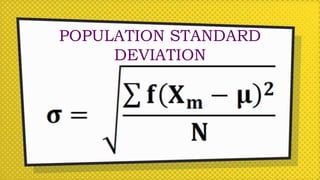
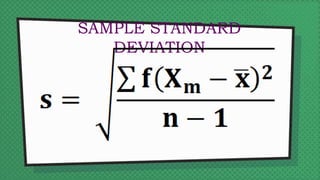
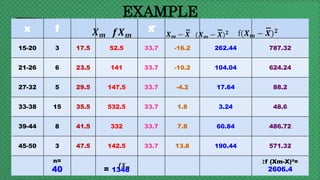
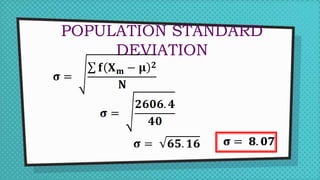
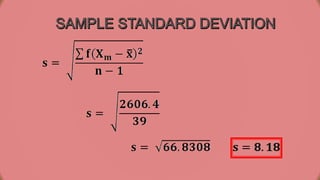
Importance
of Range
Tells you
the
distance
from the
smallest to
largest.
Ungrouped Data
R= HS-LS
Whereas:
R- Range
HS- Highest score
LS- Lowest score
Find the range of the two groups
of score distribution.
Group A Group B
10 (LS) 15 (LS)
12 16
15 16
17 17
25 17
26 23
28 25
30 26
35 (HS) 30 (HS)
Group A
RA= HS-
LS
RA =35-10
RA =25
Group B
RB= HS-LS
RB= 30-15
RB= 15
Grouped Data
R= HSUB-LSLB
Whereas:
R- Range
HSUB – Upper boundary of highest
score
LSLB – Lower boundary of lowest
score
Find the value of range of the scores of
50 students in Mathematics achievement
test
x f
25-32 3
33-40 7
41-48 5
49-56 4
57-64 12
65-72 6
73-80 8
81-88 3
89-97 2
n=50
LS= 25
LSLB= 24.5
HS= 97
HSUB= 97.5
R= HSUB-LSLB
R=97.5-24.5
R= 73
end
Mean Deviation
Measures the average deviation of the
values from the arithmetic mean. It
gives equal weight to the deviation of
every score in the distribution.
A. Mean Deviation for Ungrouped Data
MD =
Where,
MD = mean deviation value
X = individual score
= sample mean
N = number of cases
Steps in Solving Mean Deviation for
Ungrouped Data
1. Solve the mean value.
2. Subtract the mean value from each
score.
3. Take the absolute value of the
difference in step 2.
4. Solve the mean deviation using the
formula MD =
Example 1: Find the mean
deviation of the scores of
10 students in a
Mathematics test. Given
the scores: 35, 30, 26, 24,
20, 18, 18, 16, 15, 10
Analysis:
The mean deviation of the
10 scores of students is
6.04. This means that on the
average, the value deviated
from the mean of 212 is
6.04.
1. Solve for the value of the mean.
2. Subtract the mean value from each midpoint or class mark.
3. Take the absolute value of each difference.
4. Multiply the absolute value and the corresponding class
frequency.
5. Find the sum of the result in step 4.
6. Solve for the mean deviation using the formula for grouped
data.
Example 2: Find the mean deviation of
the given below.
Analysis:
The mean deviation of the
40 scores of students is
0.63. This means that on
the average, the value
deviated from the mean
of 33.63 is 10.63.
 is the square of the standard deviation.
In short, having obtained the value of the
standard deviation, you can already
determine the value of the variance.
One of the most important
measures of variation.It
shows variation at the
mean.
How to Calculate the Variance
for Ungrouped Data
1. Find the Mean.
2. Calculate the difference between
each score and the mean.
3. Square the difference between
each score and the mean.
How to Calculate the Variance
for Ungrouped Data
4. Add up all the squares of the
difference between each score
and the mean.
5. Divide the obtained sum by n – 1.
Find the Variance
35
35
35
35
35
35
210
Mean= 35
73
11
49
35
15
27
210
Mean= 35
x x-ẋ (x-ẋ)2
35 0 0
35 0 0
35 0 0
35 0 0
35 0 0
35 0 0
∑(x-ẋ)2 0
x x-ẋ (x-ẋ)2
73 38 1444
11 -24 576
49 14 196
35 0 0
15 -20 400
27 -8 64
∑(x-ẋ)2 2680
x x-ẋ (x-ẋ)2
35 0 0
35 0 0
35 0 0
35 0 0
35 0 0
35 0 0
∑(x-ẋ)2 0
Mean=35
1. Calculate the mean.
2. Get the deviations by finding the
difference of each midpoint from the
mean.
3. Square the deviations and find its
summation.
4. Substitute in the formula.
Class
Limits
(1)
F
(2)
Midpoint
(3)
FMp
(4)
_
X
_
Mp - X
_
(Mp-X)2
_
f( Mp-X)2
28-29 4 28.5 114.0 20.14 8.36 69.89 279.56
26-27 9 26.5 238.5 20.14 6.36 40.45 364.05
24-25 12 24.5 294.0 20.14 4.36 19.01 228.12
22-23 10 22.5 225.0 20.14 2.36 5.57 55.70
20-21 17 20.5 348.5 20.14 0.36 0.13 2.21
18-19 20 18.5 370.0 20.14 -1.64 2.69 53.80
16-17 14 16.5 231.0 20.14 -3.64 13.25 185.50
14-15 9 14.5 130.5 20.14 -5.64 31.81 286.29
12-13 5 12.5 62.5 20.14 -7.64 58.37 291.85
N=
100
∑fMp=
2,014.0
∑(Mp-X)2=
1,747.08
TANDARD
DEVIATIO
N 
Standard Deviation
•Is the most important
measures of variation.
•It is also known as the
square root of the variance.
•It is the average distance of
all the scores that deviates
from the mean value.
POPULATION STANDARD
DEVIATION
AMPLE STANDARD
DEVIATION
1. Solve the mean value.
2. Subtract the mean value from each score.
3. Square the difference between the mean and
each score.
4. Find the sum of step 3.
5. Solve for the population standard deviation or
sample standard deviation using the formula for
ungrouped data.
EXAMPLE
X X - X (X – X)²
19 4.4 19.36
17 2.4 5.76
16 1.4 1.96
16 1.4 1.96
15 0.4 0.16
14 -0.6 0.36
14 -0.6 0.36
13 -1.6 2.56
12 -2.6 6.76
10 -4.6 21.16
Ʃx= 146 Ʃ(x-x)²= 60.40
x= 14.6
POPULATION STANDARD
DEVIATION
SAMPLE STANDARD
DEVIATION
Formula
of
Standar
d
Deviatio
n of
Groupe
d Data
POPULATION STANDARD
DEVIATION
SAMPLE STANDARD
DEVIATION
Steps in solving the STANDARD
DEVIATION of GROUP DATA
1. Solve the mean value.
2. Subtract the mean value from each midpoint or class
mark.
3. Square the difference between the mean value and
midpoint or class mark.
4. Multiply the squared difference and the corresponding
class frequency.
5. Find the sum of the results in step 4.
6. Solve the population standard deviation or sample
standard deviation using the formula for grouped data.
EXAMPLE
x f x
15-20 3 17.5 52.5 33.7 -16.2 262.44 787.32
21-26 6 23.5 141 33.7 -10.2 104.04 624.24
27-32 5 29.5 147.5 33.7 -4.2 17.64 88.2
33-38 15 35.5 532.5 33.7 1.8 3.24 48.6
39-44 8 41.5 332 33.7 7.8 60.84 486.72
45-50 3 47.5 142.5 33.7 13.8 190.44 571.32
n=
40 = 1348
Ʃf (Xm-X)²=
2606.4
POPULATION STANDARD
DEVIATION
Measures of Spread
Measures of Spread

Measures of Spread

  • 5.
  • 6.
    Ungrouped Data R= HS-LS Whereas: R-Range HS- Highest score LS- Lowest score
  • 7.
    Find the rangeof the two groups of score distribution. Group A Group B 10 (LS) 15 (LS) 12 16 15 16 17 17 25 17 26 23 28 25 30 26 35 (HS) 30 (HS)
  • 8.
    Group A RA= HS- LS RA=35-10 RA =25 Group B RB= HS-LS RB= 30-15 RB= 15
  • 9.
    Grouped Data R= HSUB-LSLB Whereas: R-Range HSUB – Upper boundary of highest score LSLB – Lower boundary of lowest score
  • 10.
    Find the valueof range of the scores of 50 students in Mathematics achievement test x f 25-32 3 33-40 7 41-48 5 49-56 4 57-64 12 65-72 6 73-80 8 81-88 3 89-97 2 n=50
  • 11.
    LS= 25 LSLB= 24.5 HS=97 HSUB= 97.5 R= HSUB-LSLB R=97.5-24.5 R= 73
  • 12.
  • 15.
    Mean Deviation Measures theaverage deviation of the values from the arithmetic mean. It gives equal weight to the deviation of every score in the distribution.
  • 16.
    A. Mean Deviationfor Ungrouped Data MD = Where, MD = mean deviation value X = individual score = sample mean N = number of cases
  • 17.
    Steps in SolvingMean Deviation for Ungrouped Data 1. Solve the mean value. 2. Subtract the mean value from each score. 3. Take the absolute value of the difference in step 2. 4. Solve the mean deviation using the formula MD =
  • 18.
    Example 1: Findthe mean deviation of the scores of 10 students in a Mathematics test. Given the scores: 35, 30, 26, 24, 20, 18, 18, 16, 15, 10
  • 20.
    Analysis: The mean deviationof the 10 scores of students is 6.04. This means that on the average, the value deviated from the mean of 212 is 6.04.
  • 22.
    1. Solve forthe value of the mean. 2. Subtract the mean value from each midpoint or class mark. 3. Take the absolute value of each difference. 4. Multiply the absolute value and the corresponding class frequency. 5. Find the sum of the result in step 4. 6. Solve for the mean deviation using the formula for grouped data.
  • 23.
    Example 2: Findthe mean deviation of the given below.
  • 24.
    Analysis: The mean deviationof the 40 scores of students is 0.63. This means that on the average, the value deviated from the mean of 33.63 is 10.63.
  • 26.
     is thesquare of the standard deviation. In short, having obtained the value of the standard deviation, you can already determine the value of the variance.
  • 27.
    One of themost important measures of variation.It shows variation at the mean.
  • 29.
    How to Calculatethe Variance for Ungrouped Data 1. Find the Mean. 2. Calculate the difference between each score and the mean. 3. Square the difference between each score and the mean.
  • 30.
    How to Calculatethe Variance for Ungrouped Data 4. Add up all the squares of the difference between each score and the mean. 5. Divide the obtained sum by n – 1.
  • 31.
    Find the Variance 35 35 35 35 35 35 210 Mean=35 73 11 49 35 15 27 210 Mean= 35
  • 32.
    x x-ẋ (x-ẋ)2 350 0 35 0 0 35 0 0 35 0 0 35 0 0 35 0 0 ∑(x-ẋ)2 0 x x-ẋ (x-ẋ)2 73 38 1444 11 -24 576 49 14 196 35 0 0 15 -20 400 27 -8 64 ∑(x-ẋ)2 2680 x x-ẋ (x-ẋ)2 35 0 0 35 0 0 35 0 0 35 0 0 35 0 0 35 0 0 ∑(x-ẋ)2 0 Mean=35
  • 35.
    1. Calculate themean. 2. Get the deviations by finding the difference of each midpoint from the mean. 3. Square the deviations and find its summation. 4. Substitute in the formula.
  • 36.
    Class Limits (1) F (2) Midpoint (3) FMp (4) _ X _ Mp - X _ (Mp-X)2 _ f(Mp-X)2 28-29 4 28.5 114.0 20.14 8.36 69.89 279.56 26-27 9 26.5 238.5 20.14 6.36 40.45 364.05 24-25 12 24.5 294.0 20.14 4.36 19.01 228.12 22-23 10 22.5 225.0 20.14 2.36 5.57 55.70 20-21 17 20.5 348.5 20.14 0.36 0.13 2.21 18-19 20 18.5 370.0 20.14 -1.64 2.69 53.80 16-17 14 16.5 231.0 20.14 -3.64 13.25 185.50 14-15 9 14.5 130.5 20.14 -5.64 31.81 286.29 12-13 5 12.5 62.5 20.14 -7.64 58.37 291.85 N= 100 ∑fMp= 2,014.0 ∑(Mp-X)2= 1,747.08
  • 39.
  • 40.
    Standard Deviation •Is themost important measures of variation. •It is also known as the square root of the variance. •It is the average distance of all the scores that deviates from the mean value.
  • 42.
  • 43.
  • 44.
    1. Solve themean value. 2. Subtract the mean value from each score. 3. Square the difference between the mean and each score. 4. Find the sum of step 3. 5. Solve for the population standard deviation or sample standard deviation using the formula for ungrouped data.
  • 45.
    EXAMPLE X X -X (X – X)² 19 4.4 19.36 17 2.4 5.76 16 1.4 1.96 16 1.4 1.96 15 0.4 0.16 14 -0.6 0.36 14 -0.6 0.36 13 -1.6 2.56 12 -2.6 6.76 10 -4.6 21.16 Ʃx= 146 Ʃ(x-x)²= 60.40 x= 14.6
  • 46.
  • 47.
  • 48.
  • 49.
  • 50.
  • 51.
    Steps in solvingthe STANDARD DEVIATION of GROUP DATA 1. Solve the mean value. 2. Subtract the mean value from each midpoint or class mark. 3. Square the difference between the mean value and midpoint or class mark. 4. Multiply the squared difference and the corresponding class frequency. 5. Find the sum of the results in step 4. 6. Solve the population standard deviation or sample standard deviation using the formula for grouped data.
  • 52.
    EXAMPLE x f x 15-203 17.5 52.5 33.7 -16.2 262.44 787.32 21-26 6 23.5 141 33.7 -10.2 104.04 624.24 27-32 5 29.5 147.5 33.7 -4.2 17.64 88.2 33-38 15 35.5 532.5 33.7 1.8 3.24 48.6 39-44 8 41.5 332 33.7 7.8 60.84 486.72 45-50 3 47.5 142.5 33.7 13.8 190.44 571.32 n= 40 = 1348 Ʃf (Xm-X)²= 2606.4
  • 53.