Downloaded 559 times
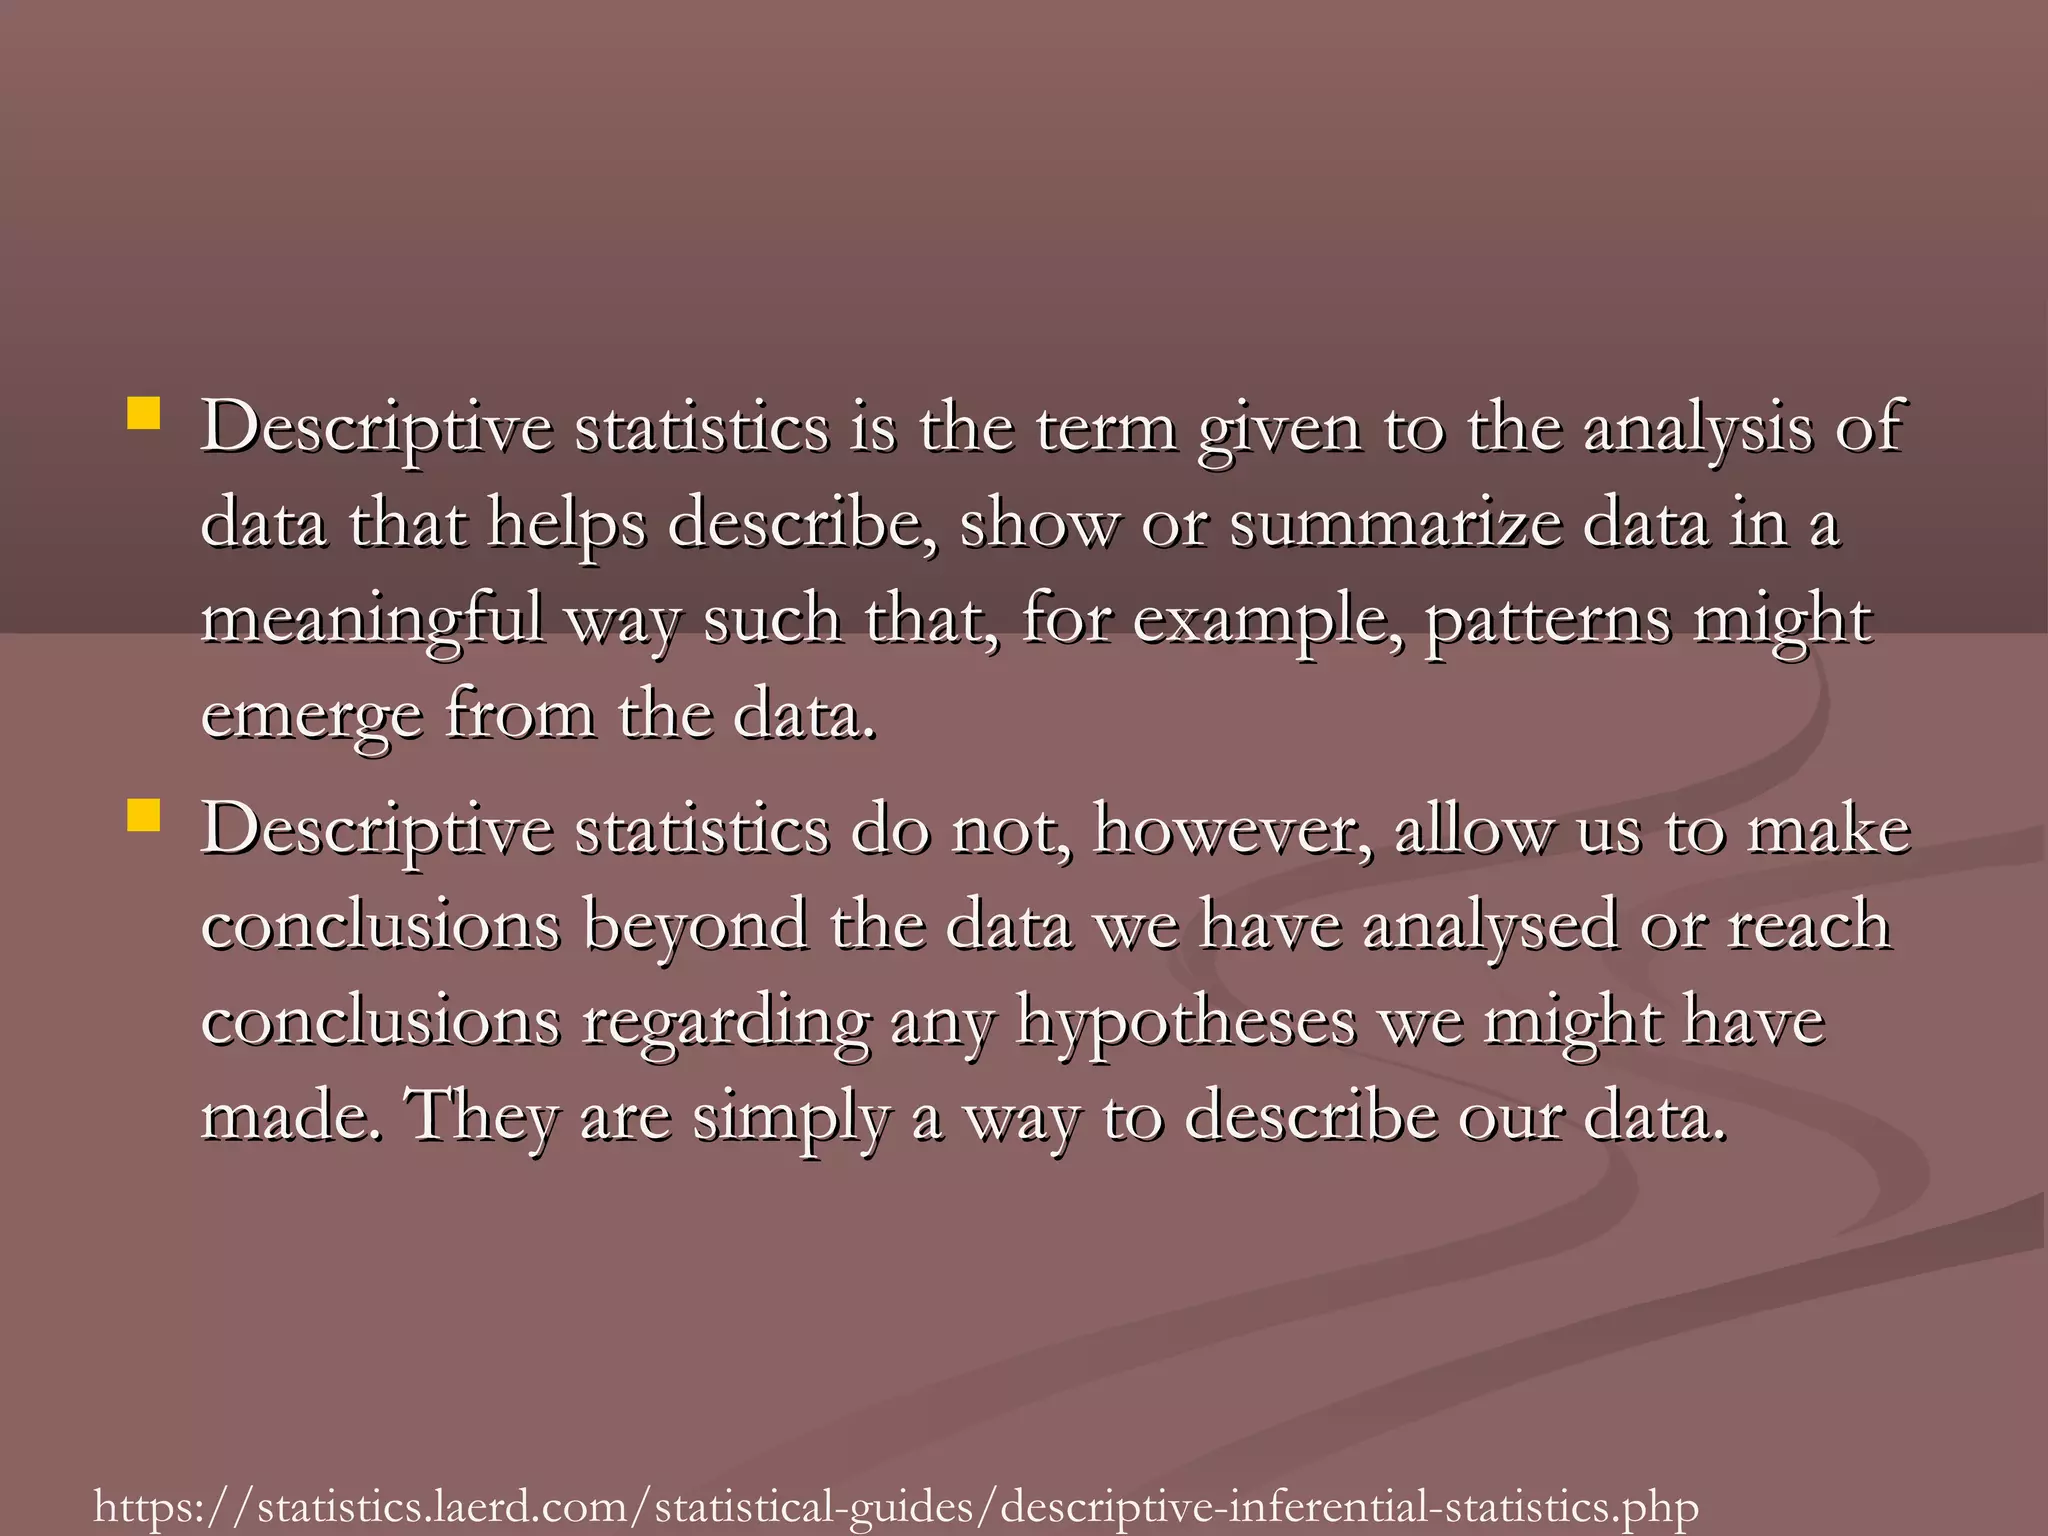
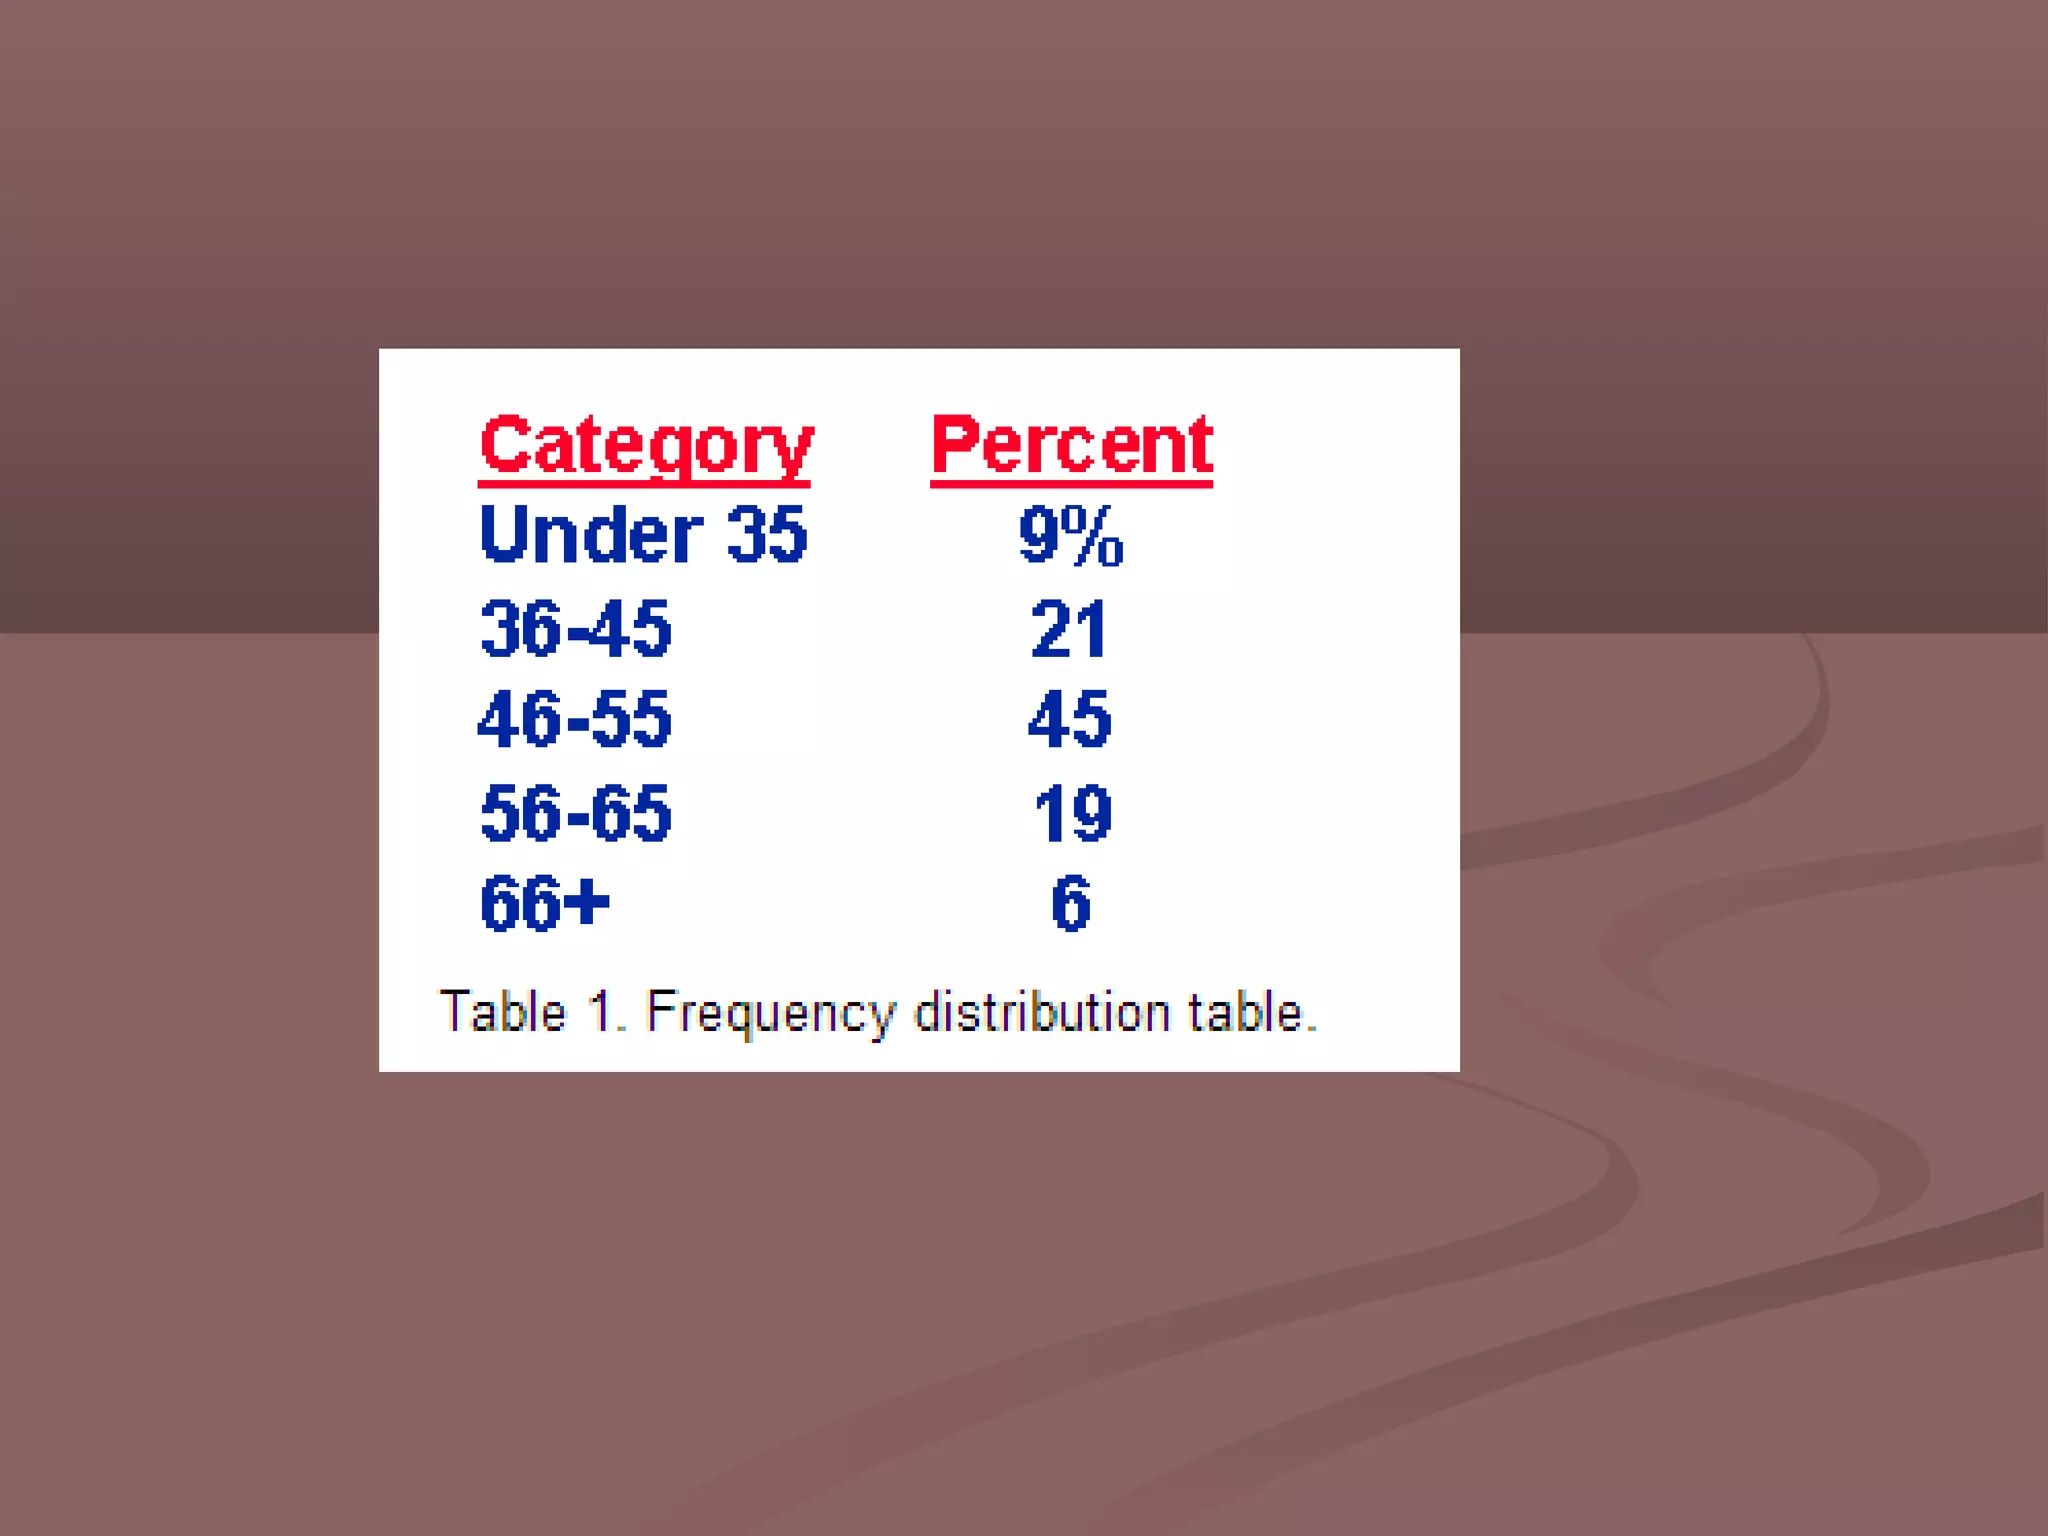
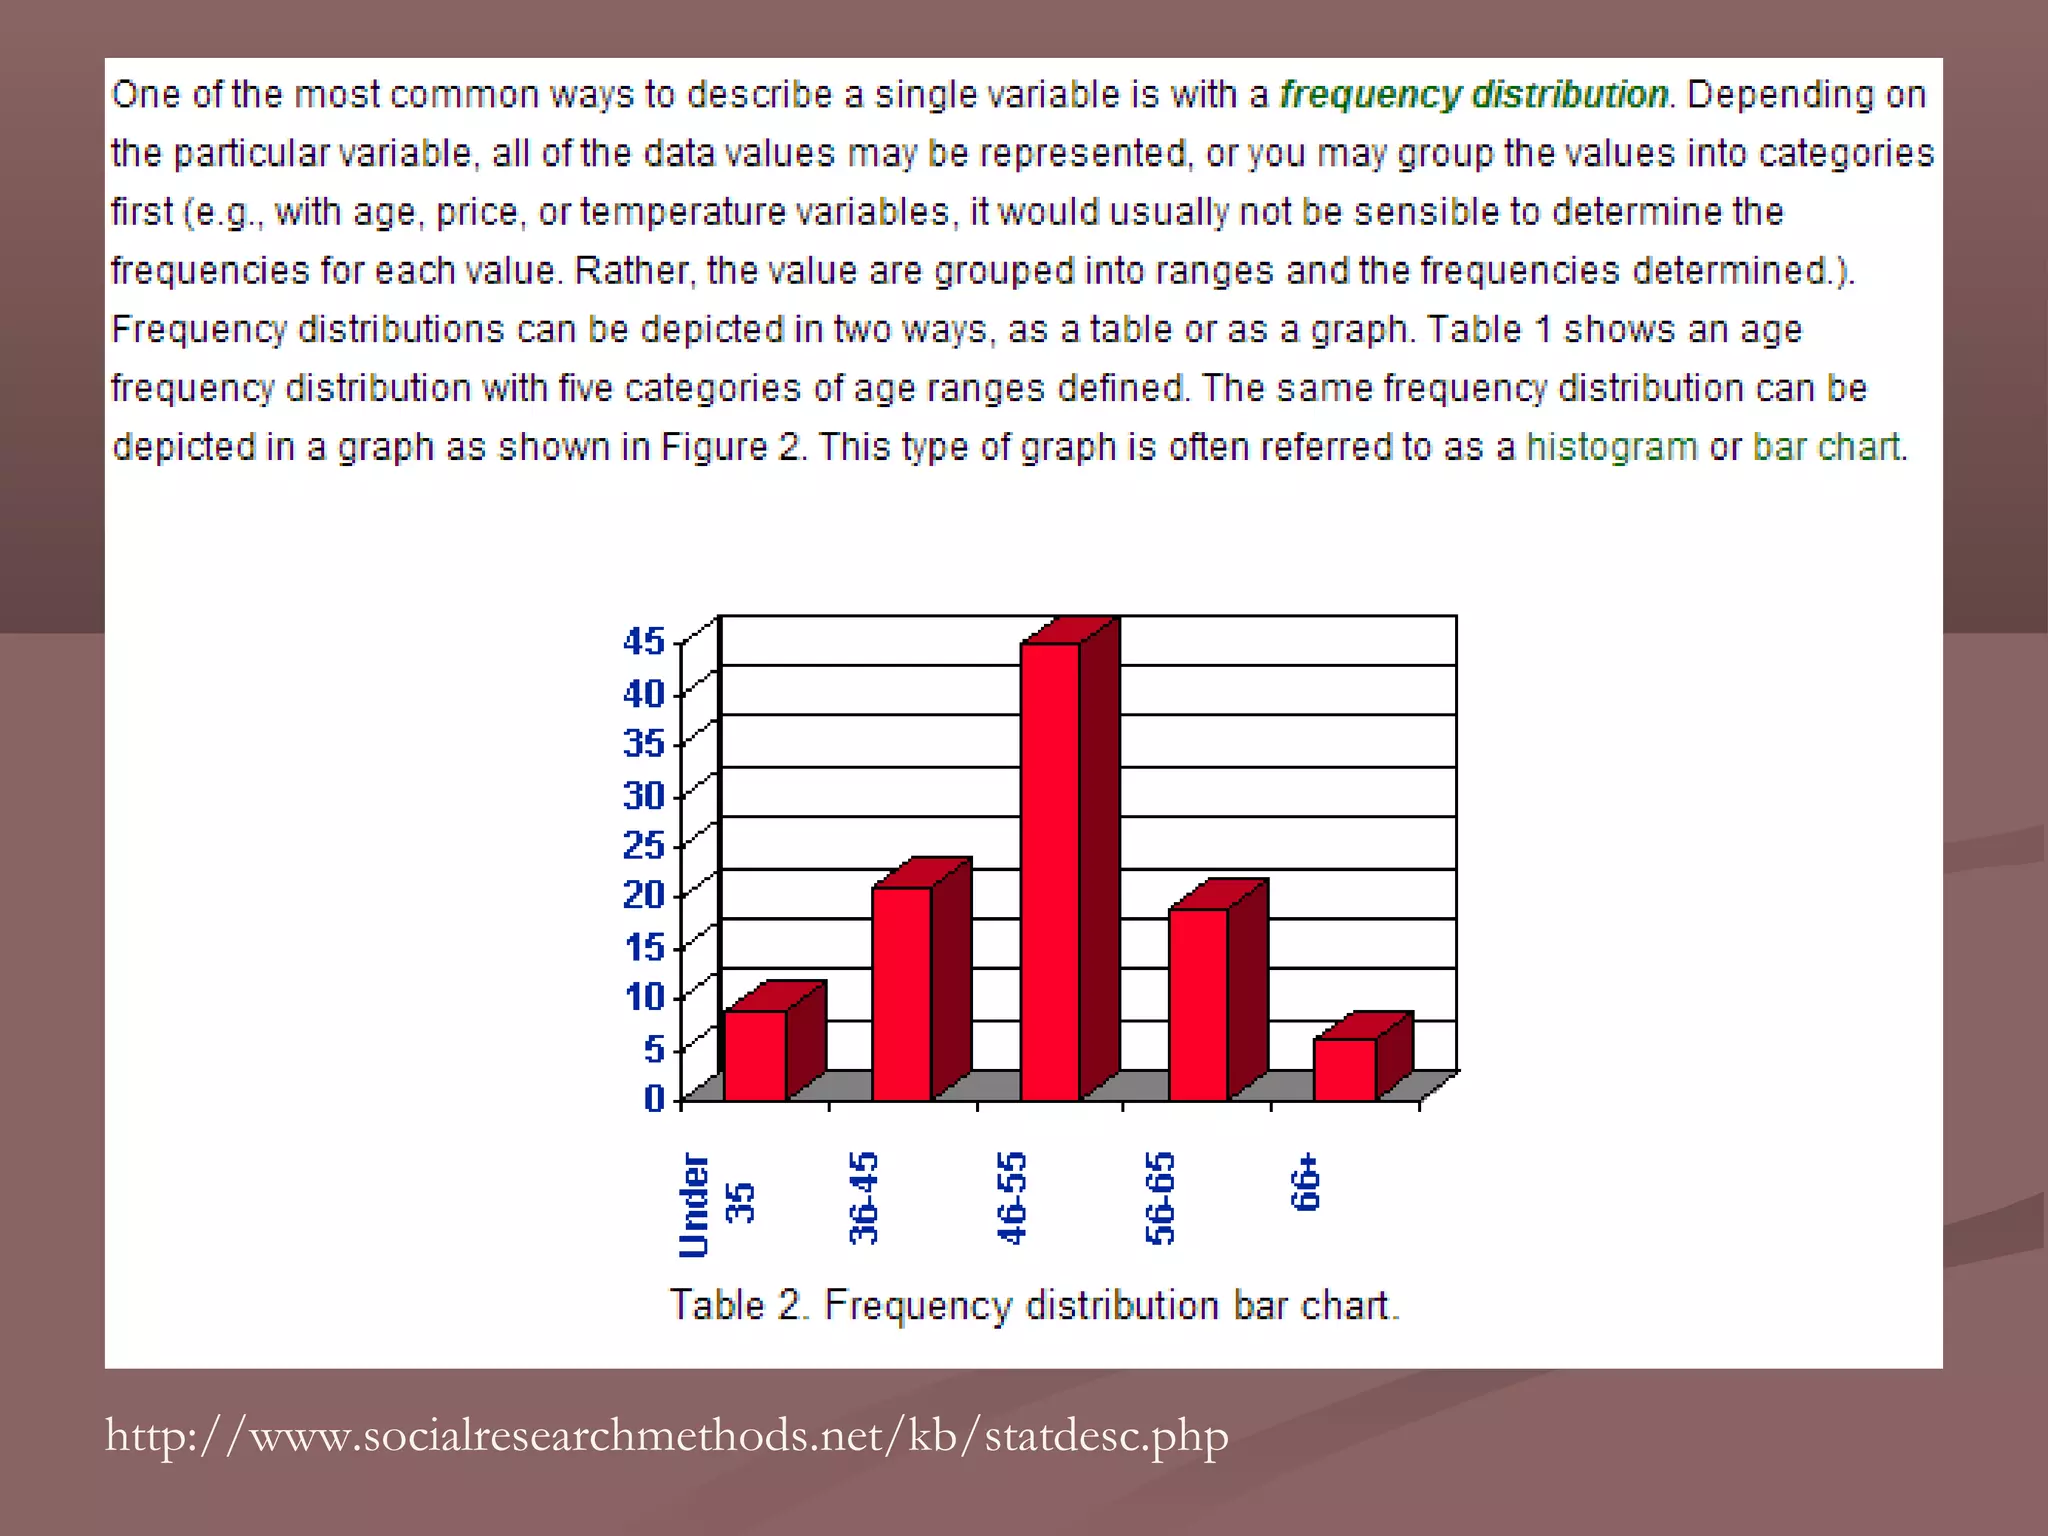

This document discusses descriptive statistics and how they are used to summarize and describe data. Descriptive statistics allow researchers to analyze patterns in data but cannot be used to draw conclusions beyond the sample. Key aspects covered include measures of central tendency like mean, median, and mode to describe the central position in a data set. Measures of dispersion like range and standard deviation are also discussed to quantify how spread out the data values are. Frequency distributions are described as a way to summarize the frequencies of individual data values or ranges.