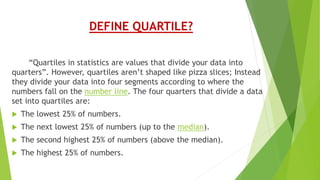
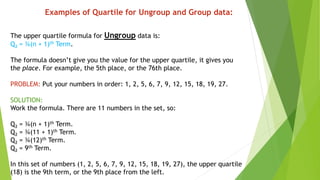
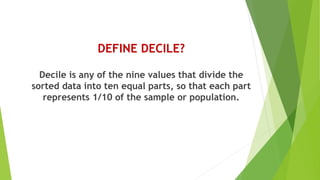
This document defines and discusses quartiles, deciles, and percentiles. Quartiles divide a data set into four equal parts, with the first quartile (Q1) representing the lowest 25% of values. Deciles divide data into ten equal parts. Percentiles indicate the value below which a certain percentage of observations fall. Examples are provided for calculating Q1, Q3, D1 using formulas for grouped and ungrouped data sets. Quartiles, deciles, and percentiles are commonly used to summarize and report on statistical data.


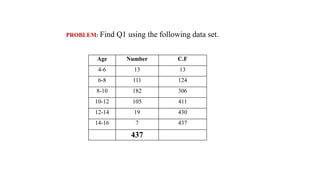


![SOLUTION:
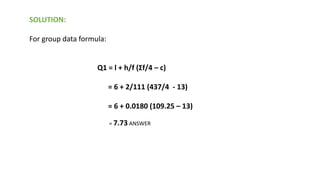
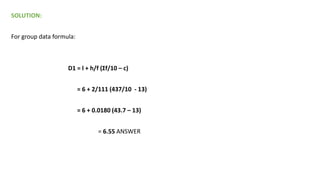
For group data formula:
P50 = l + h/f (50Σf/100 – c)
= 8 + 2/182 [50(437)/100 - 124]
= 8 + 0.0109 (218.5 – 124)
= 9.03 ANSWER](https://image.slidesharecdn.com/saif-011-mba-190529144938/85/quartiles-deciles-percentiles-ppt-15-320.jpg)