Downloaded 834 times


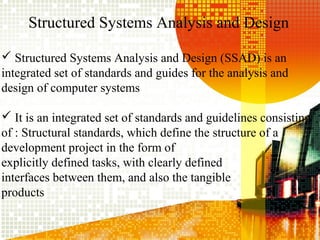

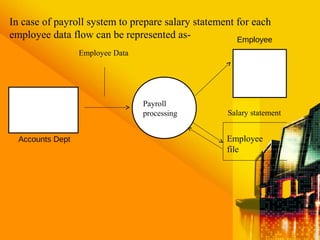
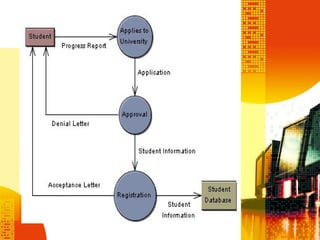


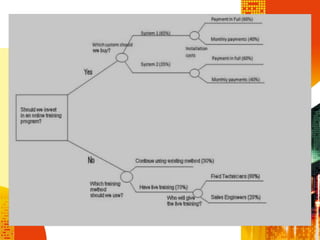

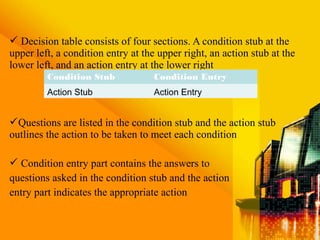

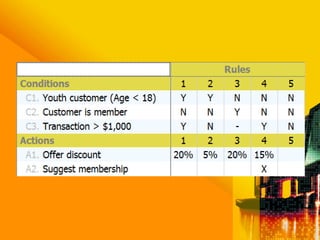
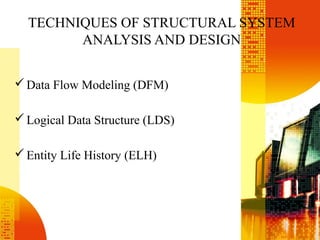


SSAD is an integrated set of standards and guidelines for analyzing and designing computer systems. It includes tools like data flow diagrams, data dictionaries, decision trees, structured English, and decision tables. Some key techniques of SSAD include data flow modeling, logical data structures, and entity life histories. SSAD provides benefits like improved productivity, flexibility, quality and on-time delivery, while also ensuring user needs are met. However, it also has disadvantages like large costs and time requirements for training and its document standards.


![Getting Started with Apache Spark: Big Data Made Simple [Free Meetup]](https://cdn.slidesharecdn.com/ss_thumbnails/apachesparkgettingstarted-260203175547-8361bcc3-thumbnail.jpg?width=640&height=640&fit=bounds)


