3. Tools ofStructured
Analysis
BCA- TY – CHAPTER 3
2.
Structured Analysis
Itis a set of techniques and graphical tools that allow the
analyst to develop a new kind of system that is
understandable to the user .
It is a development method that allows the analyst to
understand the system and its activities in a logical way.
It has following attributes:
1. It is graphic which specifies the presentation of
application.
2. It divides the processes so that it gives a clear picture of
system flow.
3. It is logical rather than physical i.e., the elements of
system do not depend on vendor or hardware.
4. It is an approach that works from high-level overviews to
lower-level details.
3.
Why do weuse these tools? :
Use of graphics whenever possible to help communicate better
with the user.
Differentiate between logical and physical system .
Build a logical system model to familiarize the user with system
characteristics and interrelationships before implementation .
4.
Major steps inStructured Analysis
Studying the current business environment
Modeling the old logical system
Modeling a new logical system
Modeling a new physical environment
Evaluating alternatives
Selecting the best design
Creating structured
5.
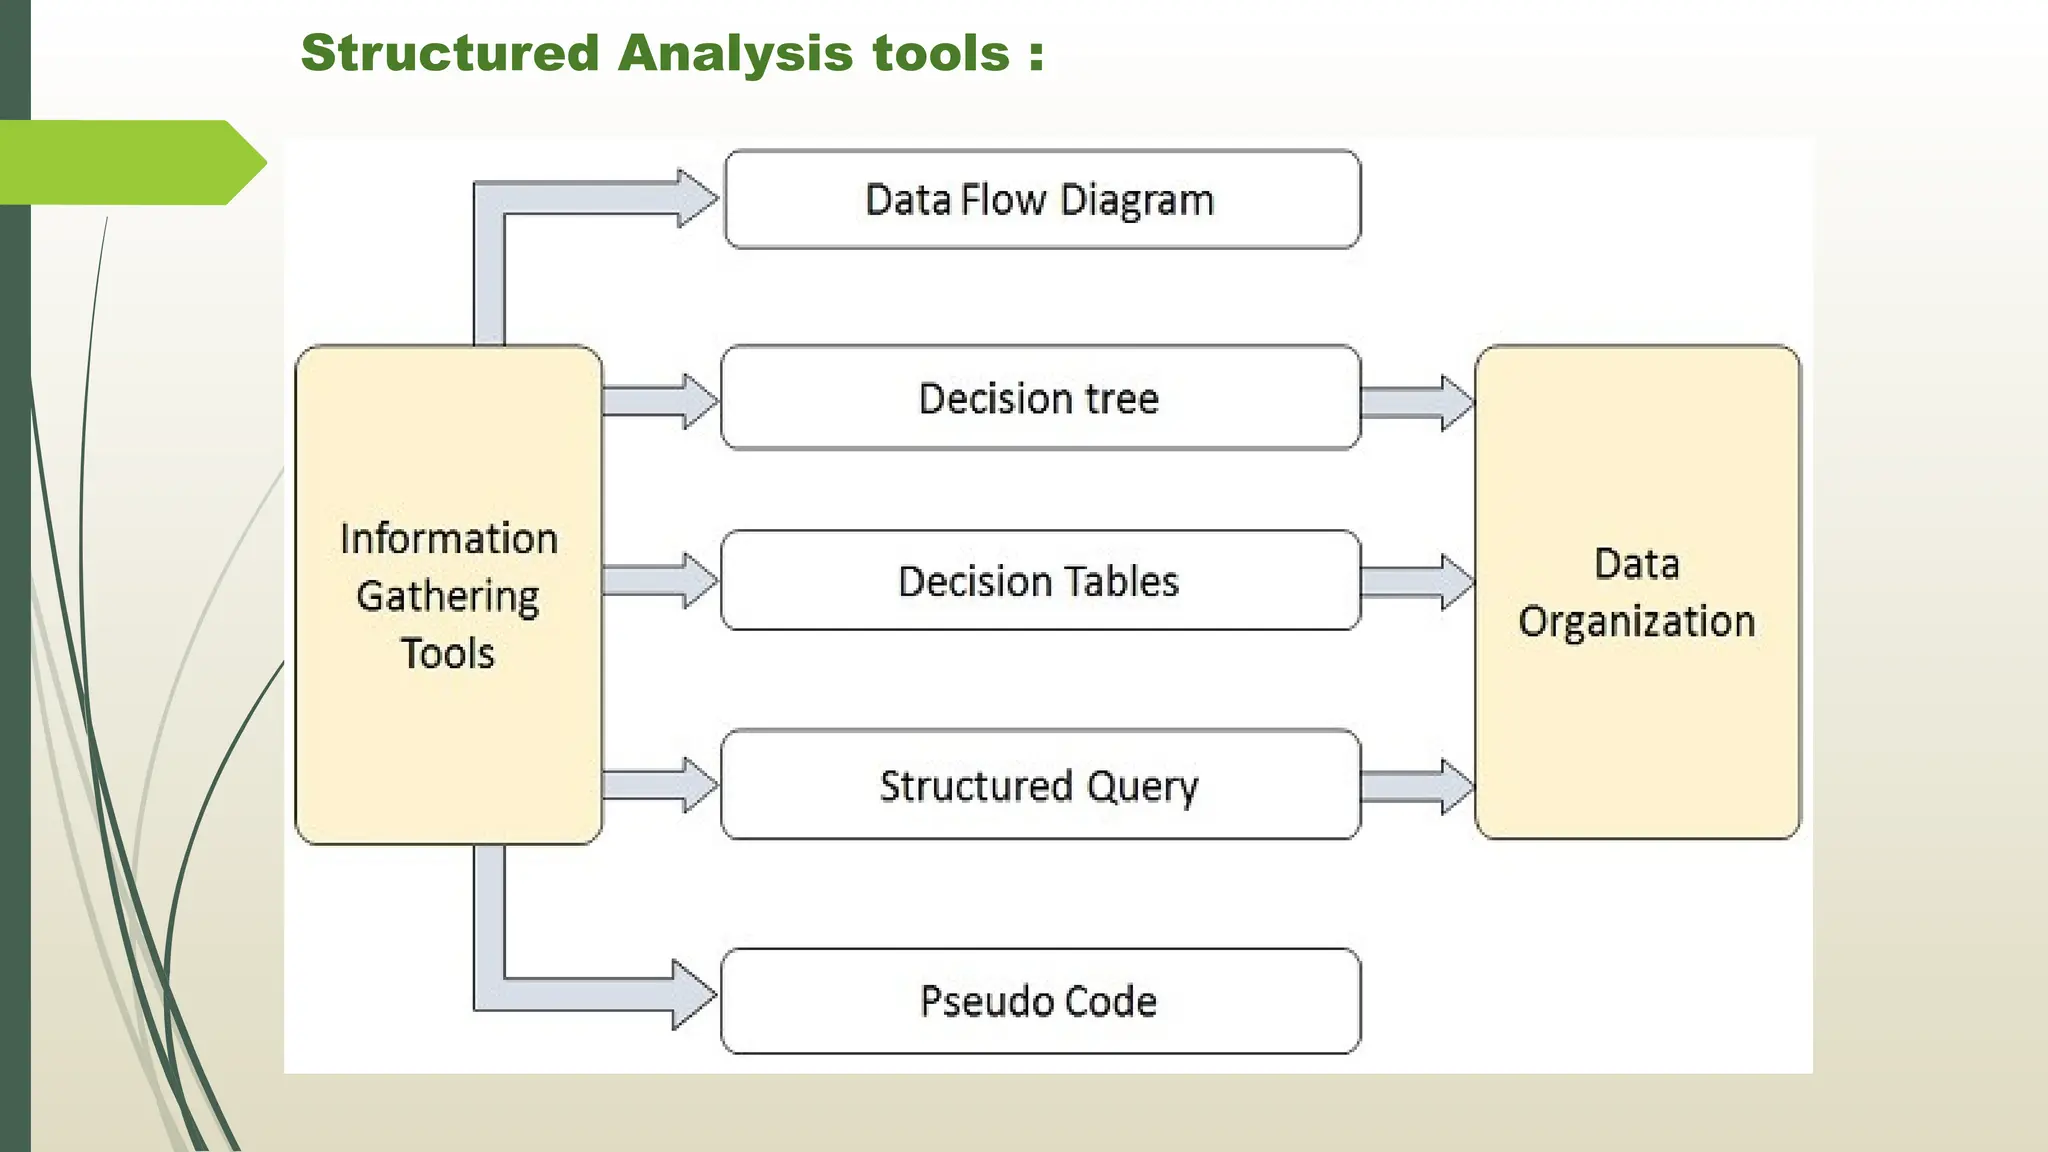
Structured Analysis tools:
During Structured Analysis, various tools and techniques are
used for system development. They are:
1. Data Flow Diagrams
2. Data Dictionary
3. Decision Trees
4. Decision Tables
5. Structured English
6. Pseudocode
Data model
LogicalData Model :
- After obtaining the business requirements, the logical model
describes the data to a great extent, but it does not take part in
implementing the database
Physical Data Model :
- A physical data model is a model that helps to implement the
database. In other words, it represents the way of building the
database.
- Moreover, the physical data model gives an abstraction of the
database and helps to generate the schema.
-
8.
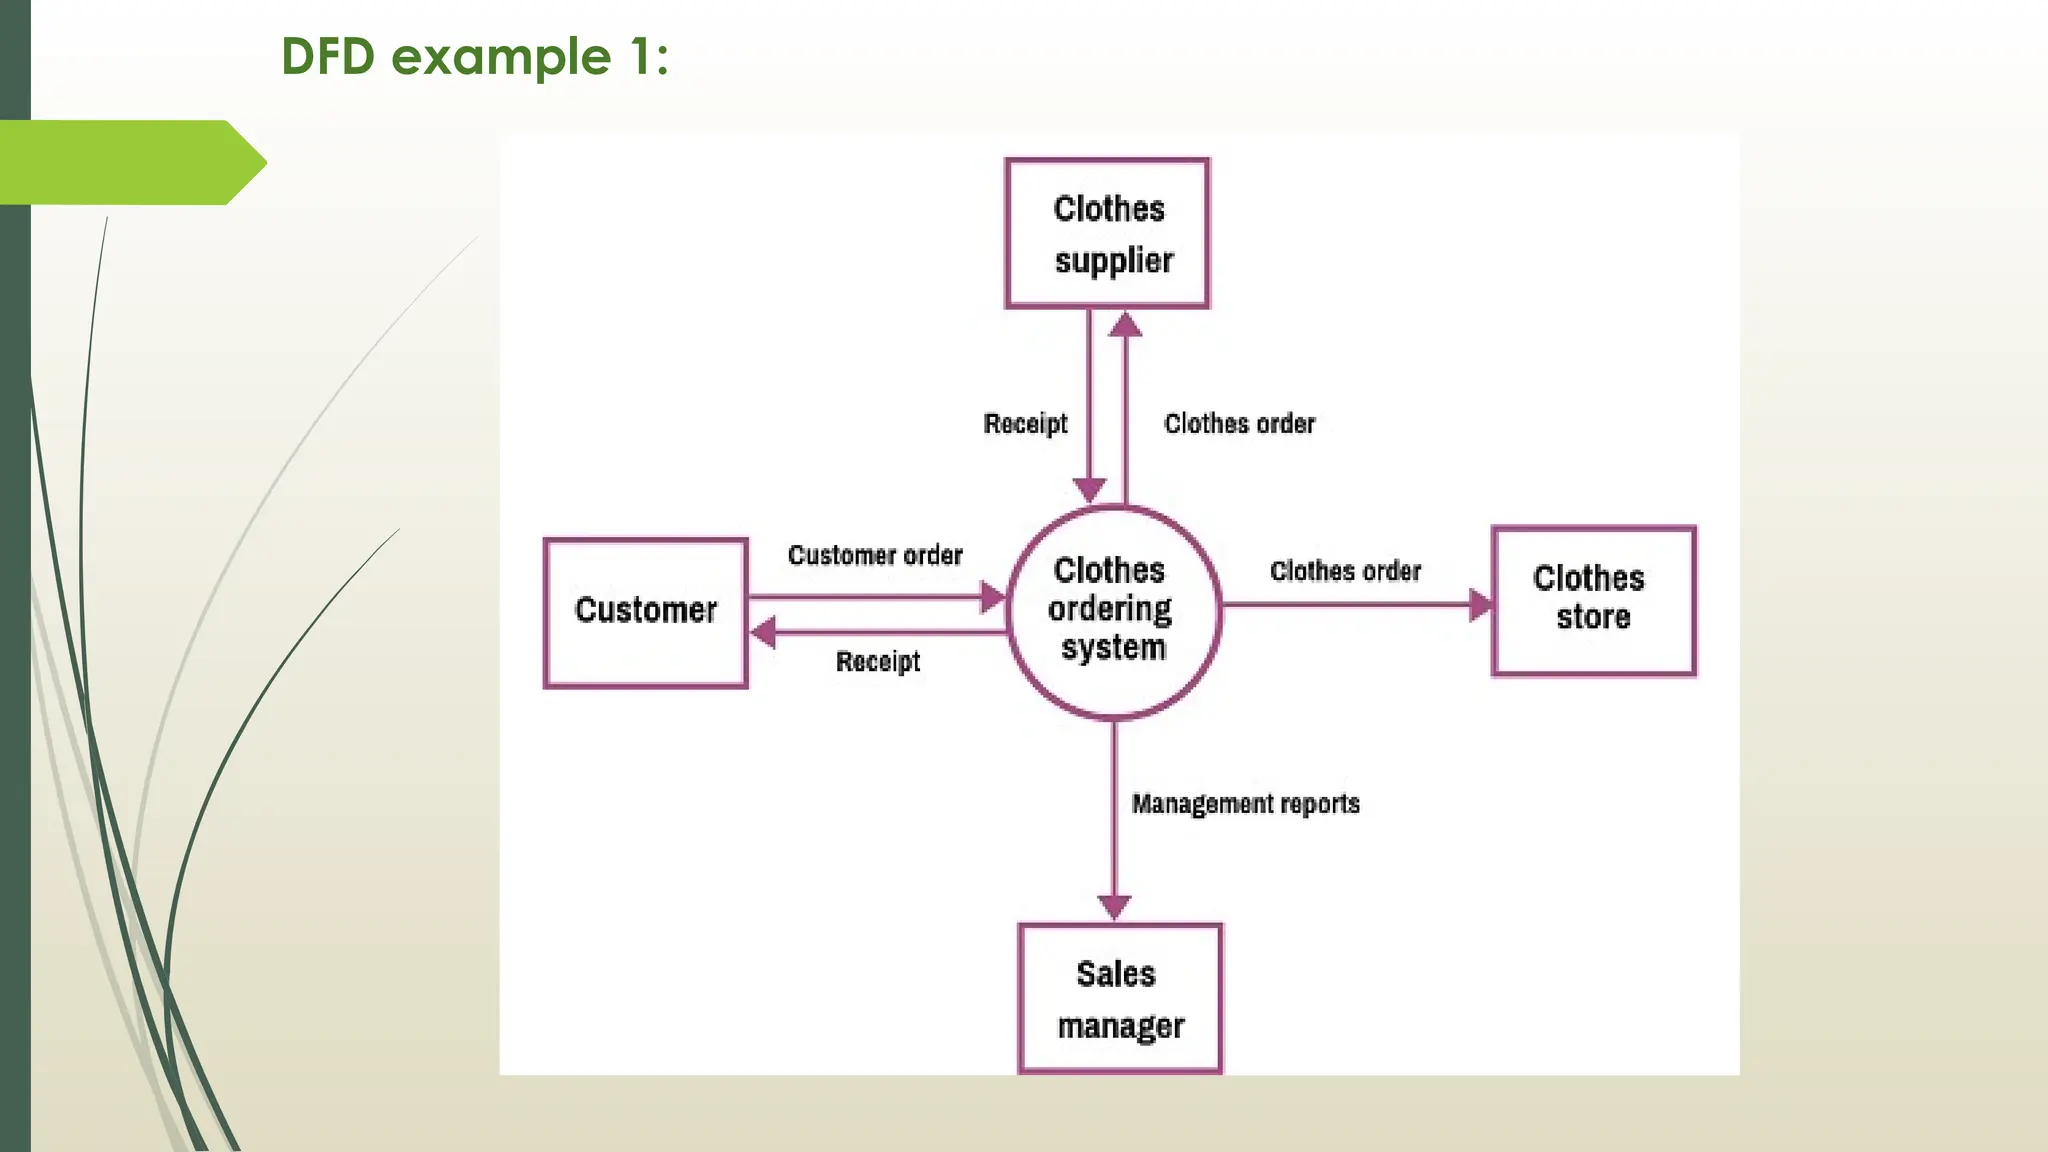
Data Flow Diagram[DFD]
Data flow diagram is graphical representation of flow of data
in an information system.
It is capable of depicting (to show)incoming data flow,
outgoing data flow and stored data.
DFD does not mention anything about how data flows
through the system.
DFDs depict flow of data in the system at various levels
DFD does not contain any control or branch elements
Data Flow diagrams are very popular because they help us
to visualize the major steps and data involved in
software-system processes.
9.
DFD
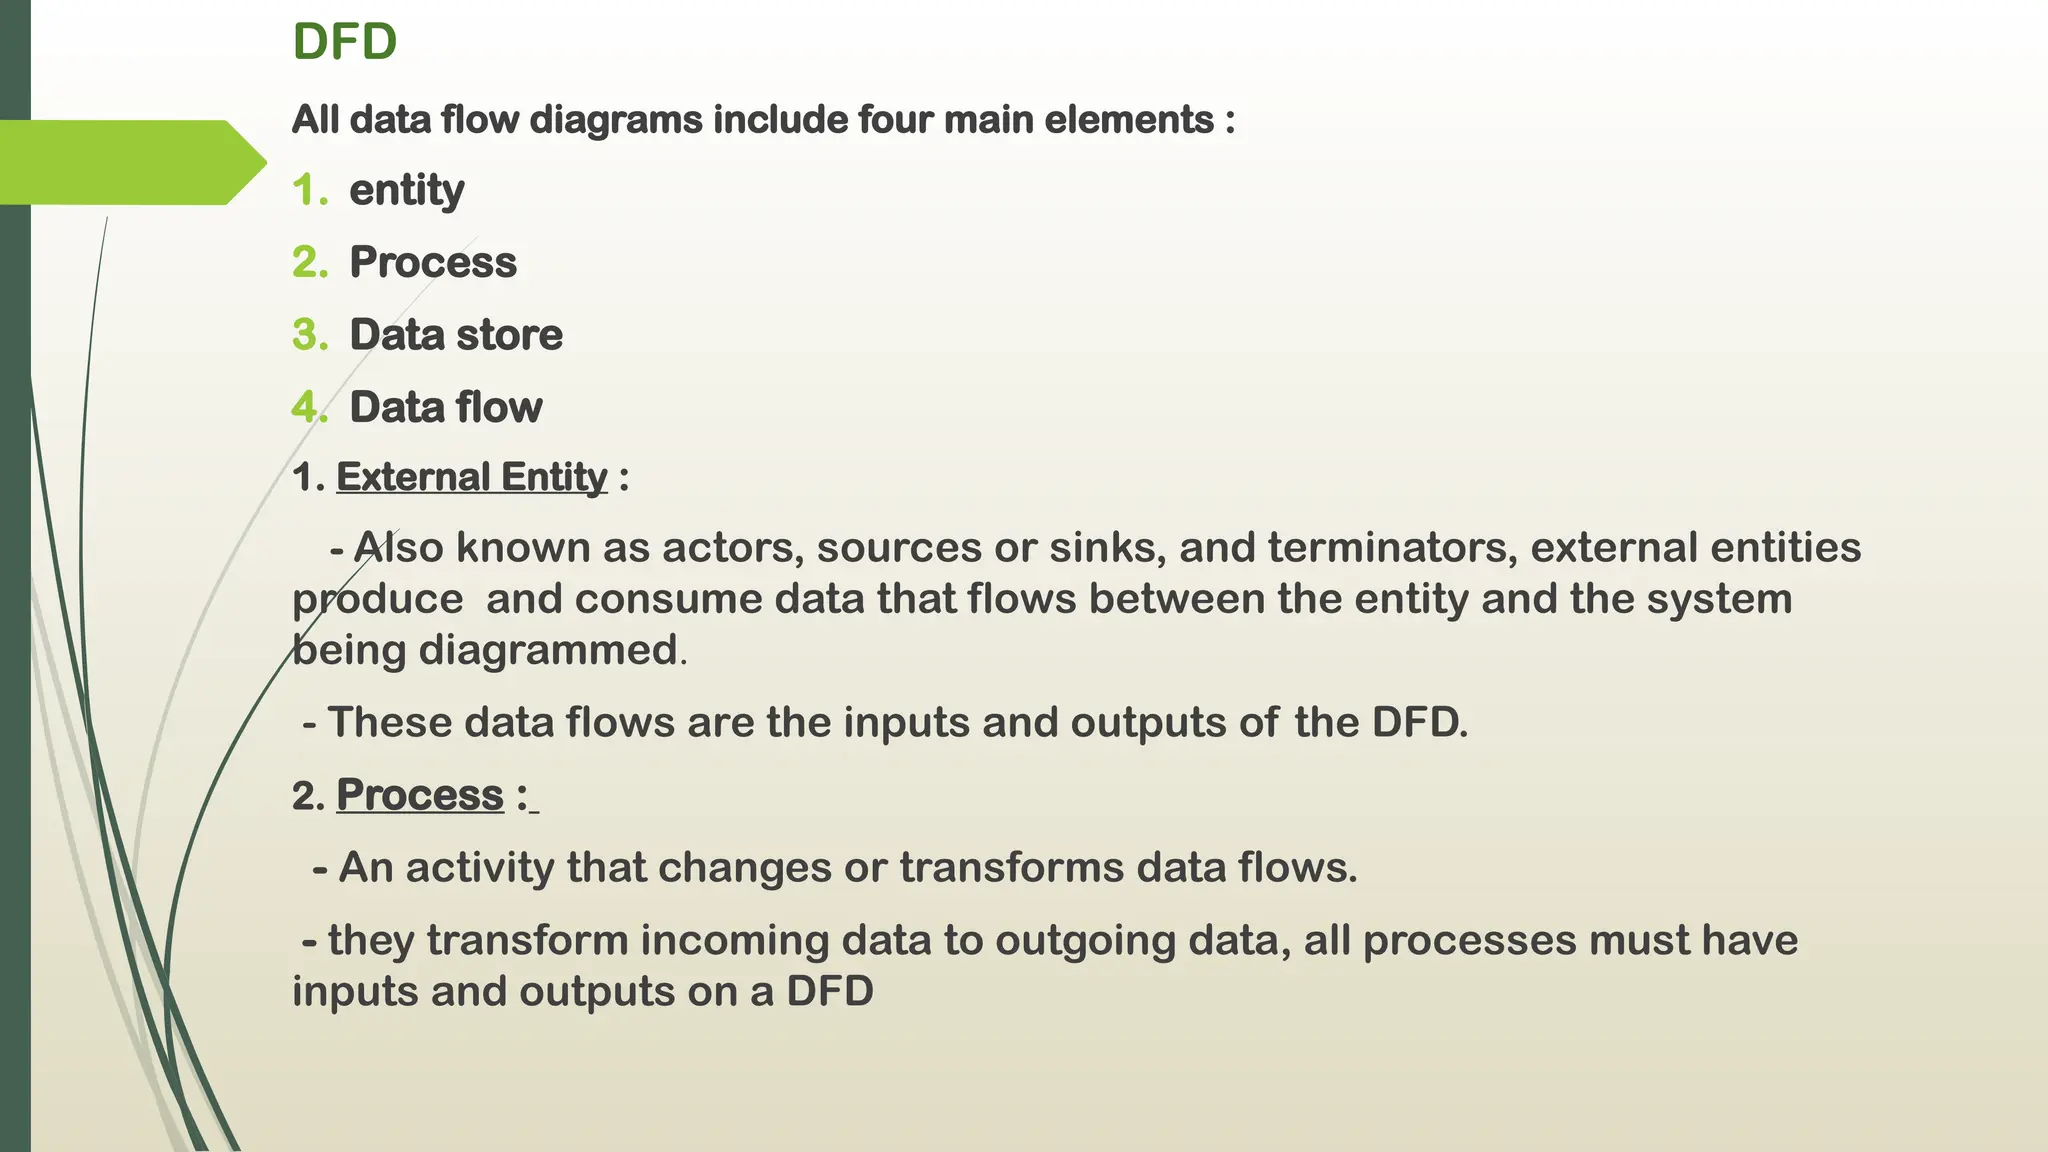
All data flowdiagrams include four main elements :
1. entity
2. Process
3. Data store
4. Data flow
1. External Entity :
- Also known as actors, sources or sinks, and terminators, external entities
produce and consume data that flows between the entity and the system
being diagrammed.
- These data flows are the inputs and outputs of the DFD.
2. Process :
- An activity that changes or transforms data flows.
- they transform incoming data to outgoing data, all processes must have
inputs and outputs on a DFD
10.
DFD
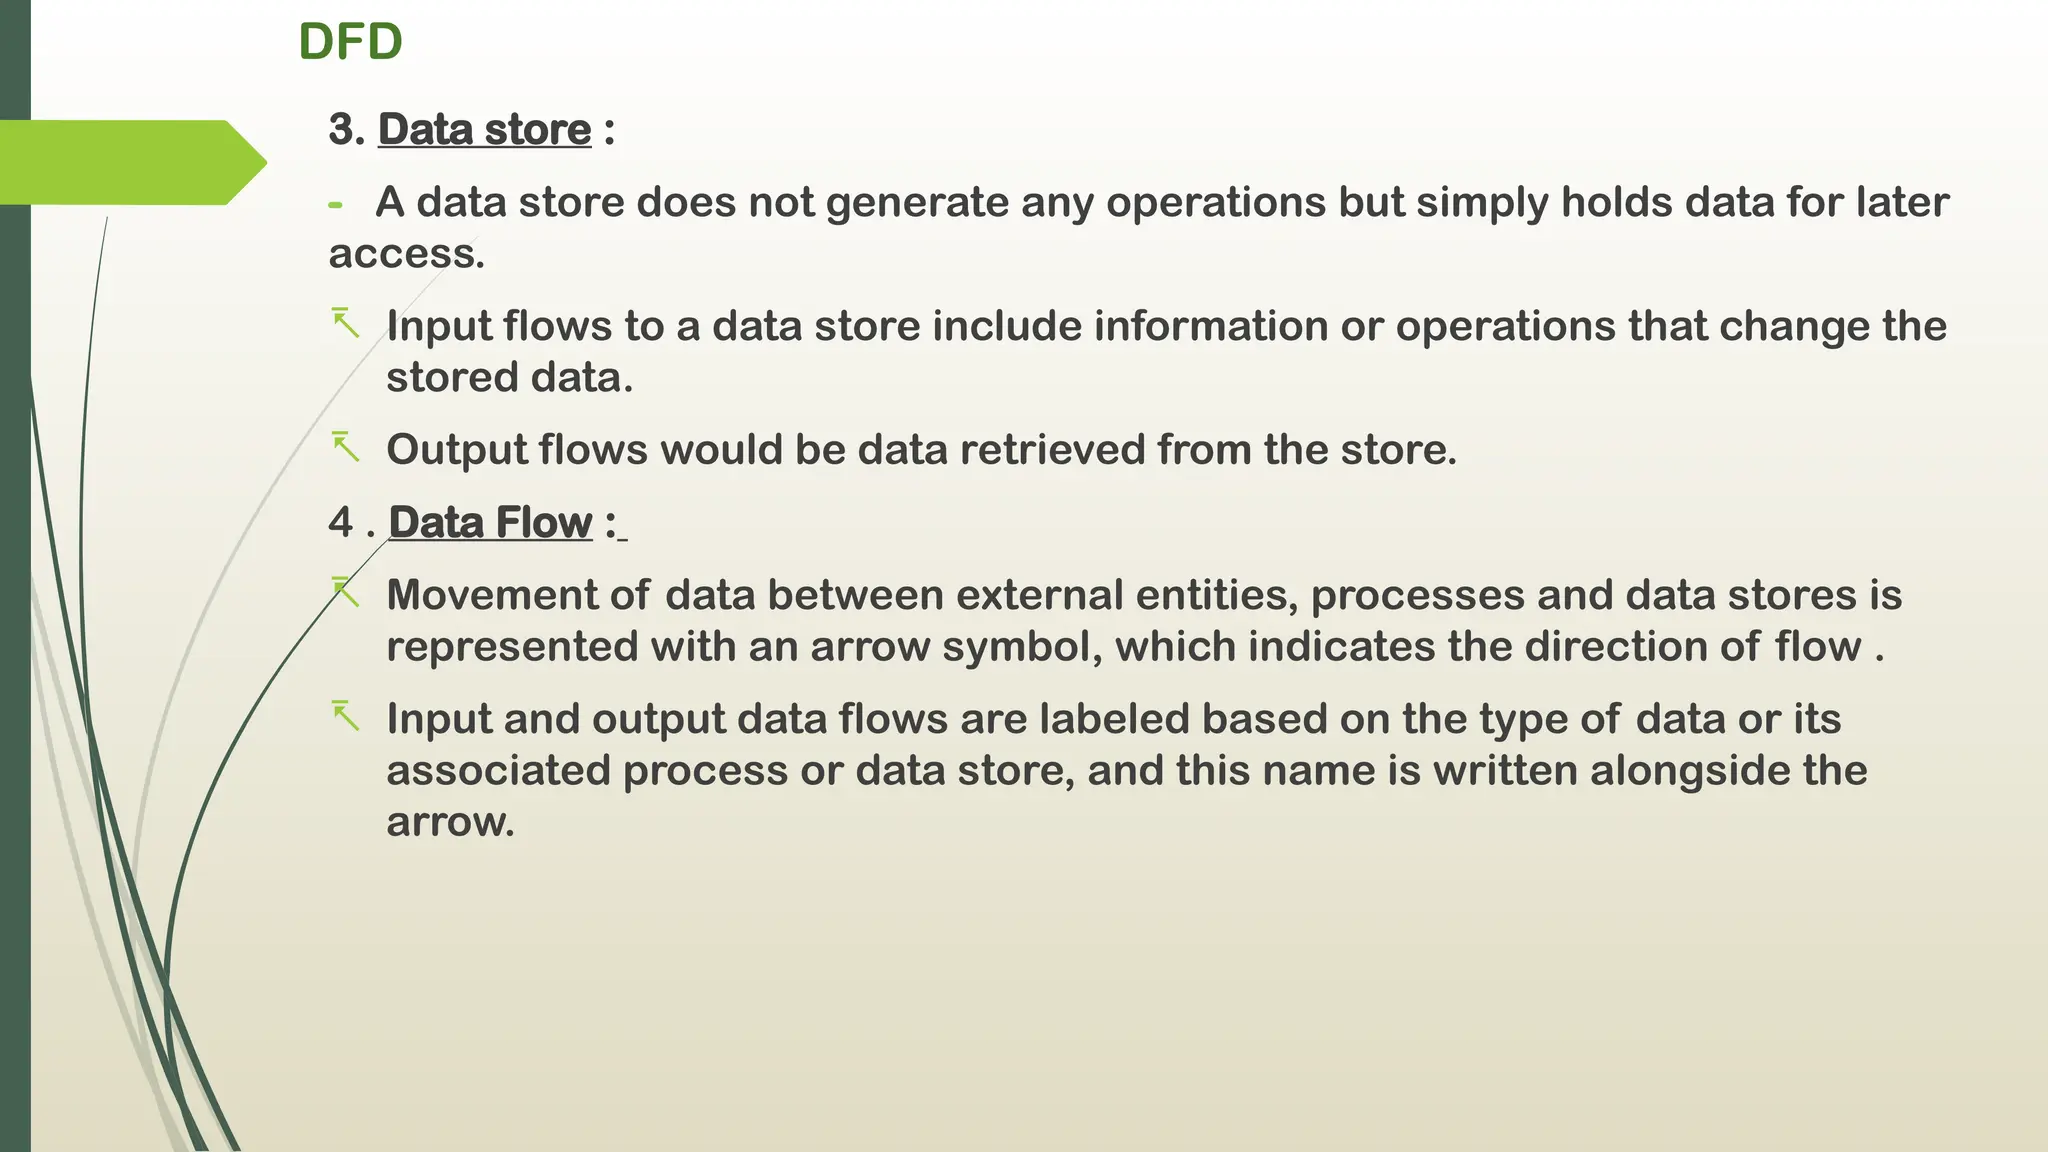
3. Data store:
- A data store does not generate any operations but simply holds data for later
access.
- Input flows to a data store include information or operations that change the
stored data.
- Output flows would be data retrieved from the store.
4 . Data Flow :
- Movement of data between external entities, processes and data stores is
represented with an arrow symbol, which indicates the direction of flow .
- Input and output data flows are labeled based on the type of data or its
associated process or data store, and this name is written alongside the
arrow.
11.
DFD
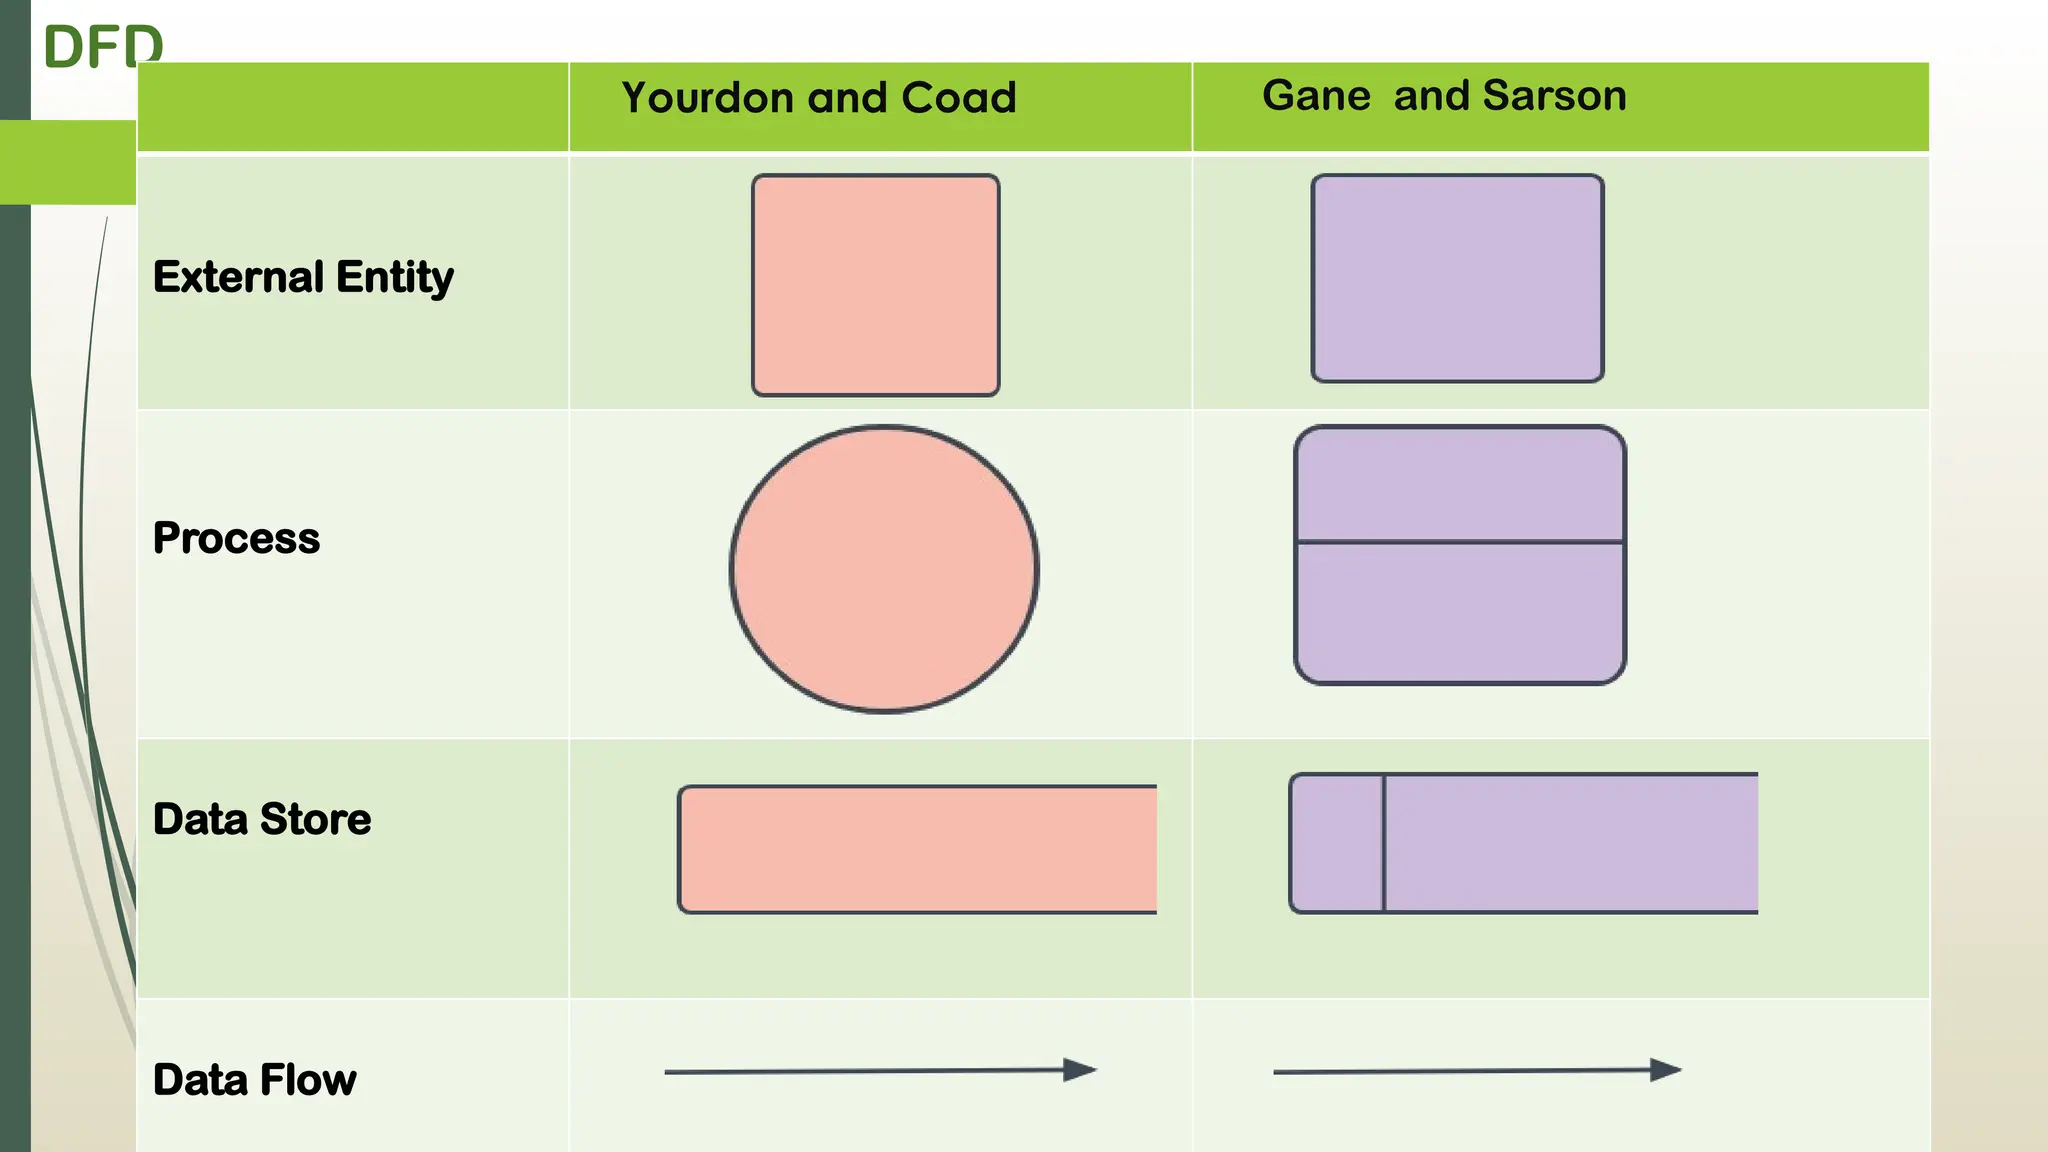
Yourdon and CoadGane and Sarson
External Entity
Process
Data Store
Data Flow
DFD
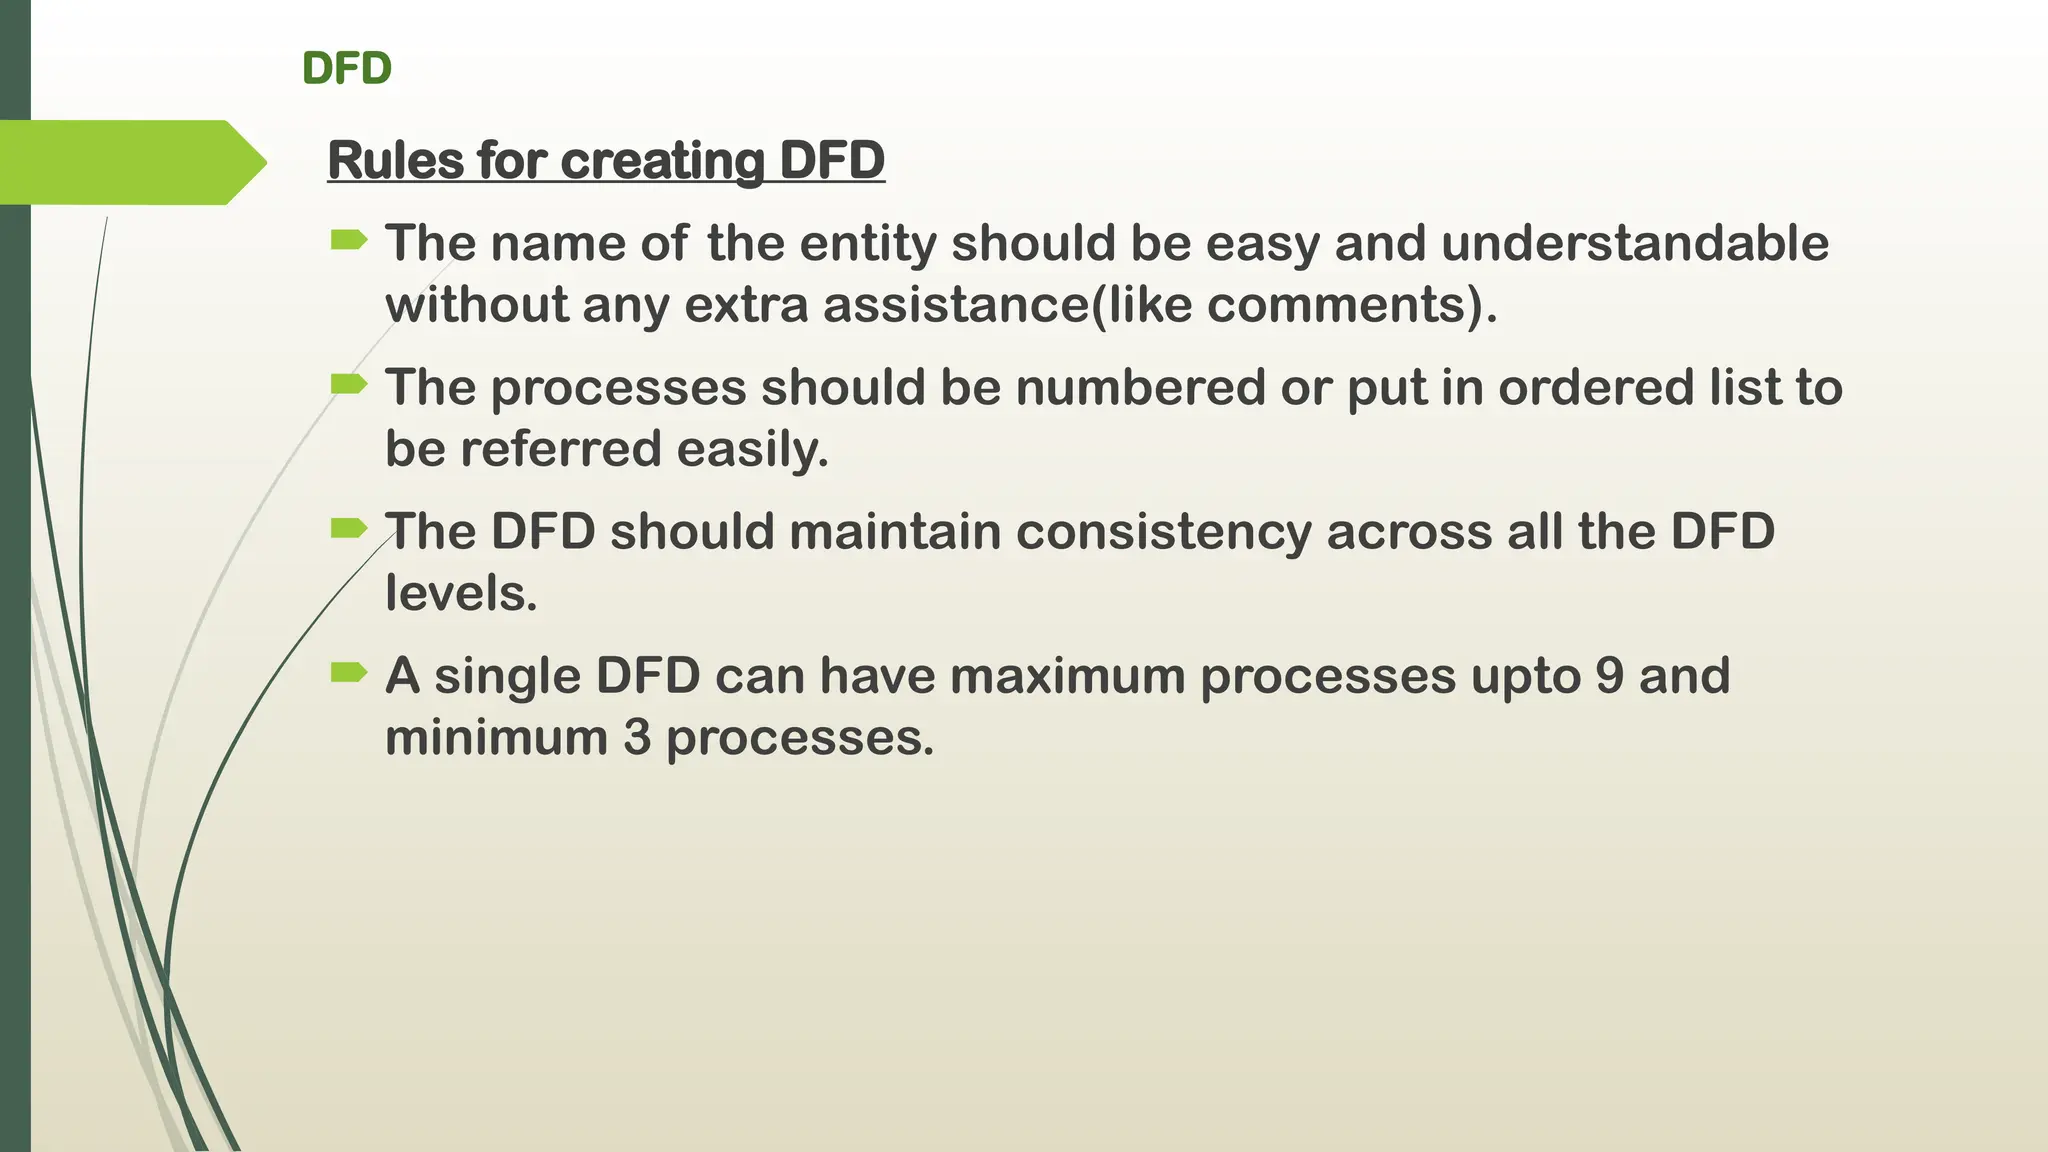
Rules for creatingDFD
The name of the entity should be easy and understandable
without any extra assistance(like comments).
The processes should be numbered or put in ordered list to
be referred easily.
The DFD should maintain consistency across all the DFD
levels.
A single DFD can have maximum processes upto 9 and
minimum 3 processes.
16.
DFD
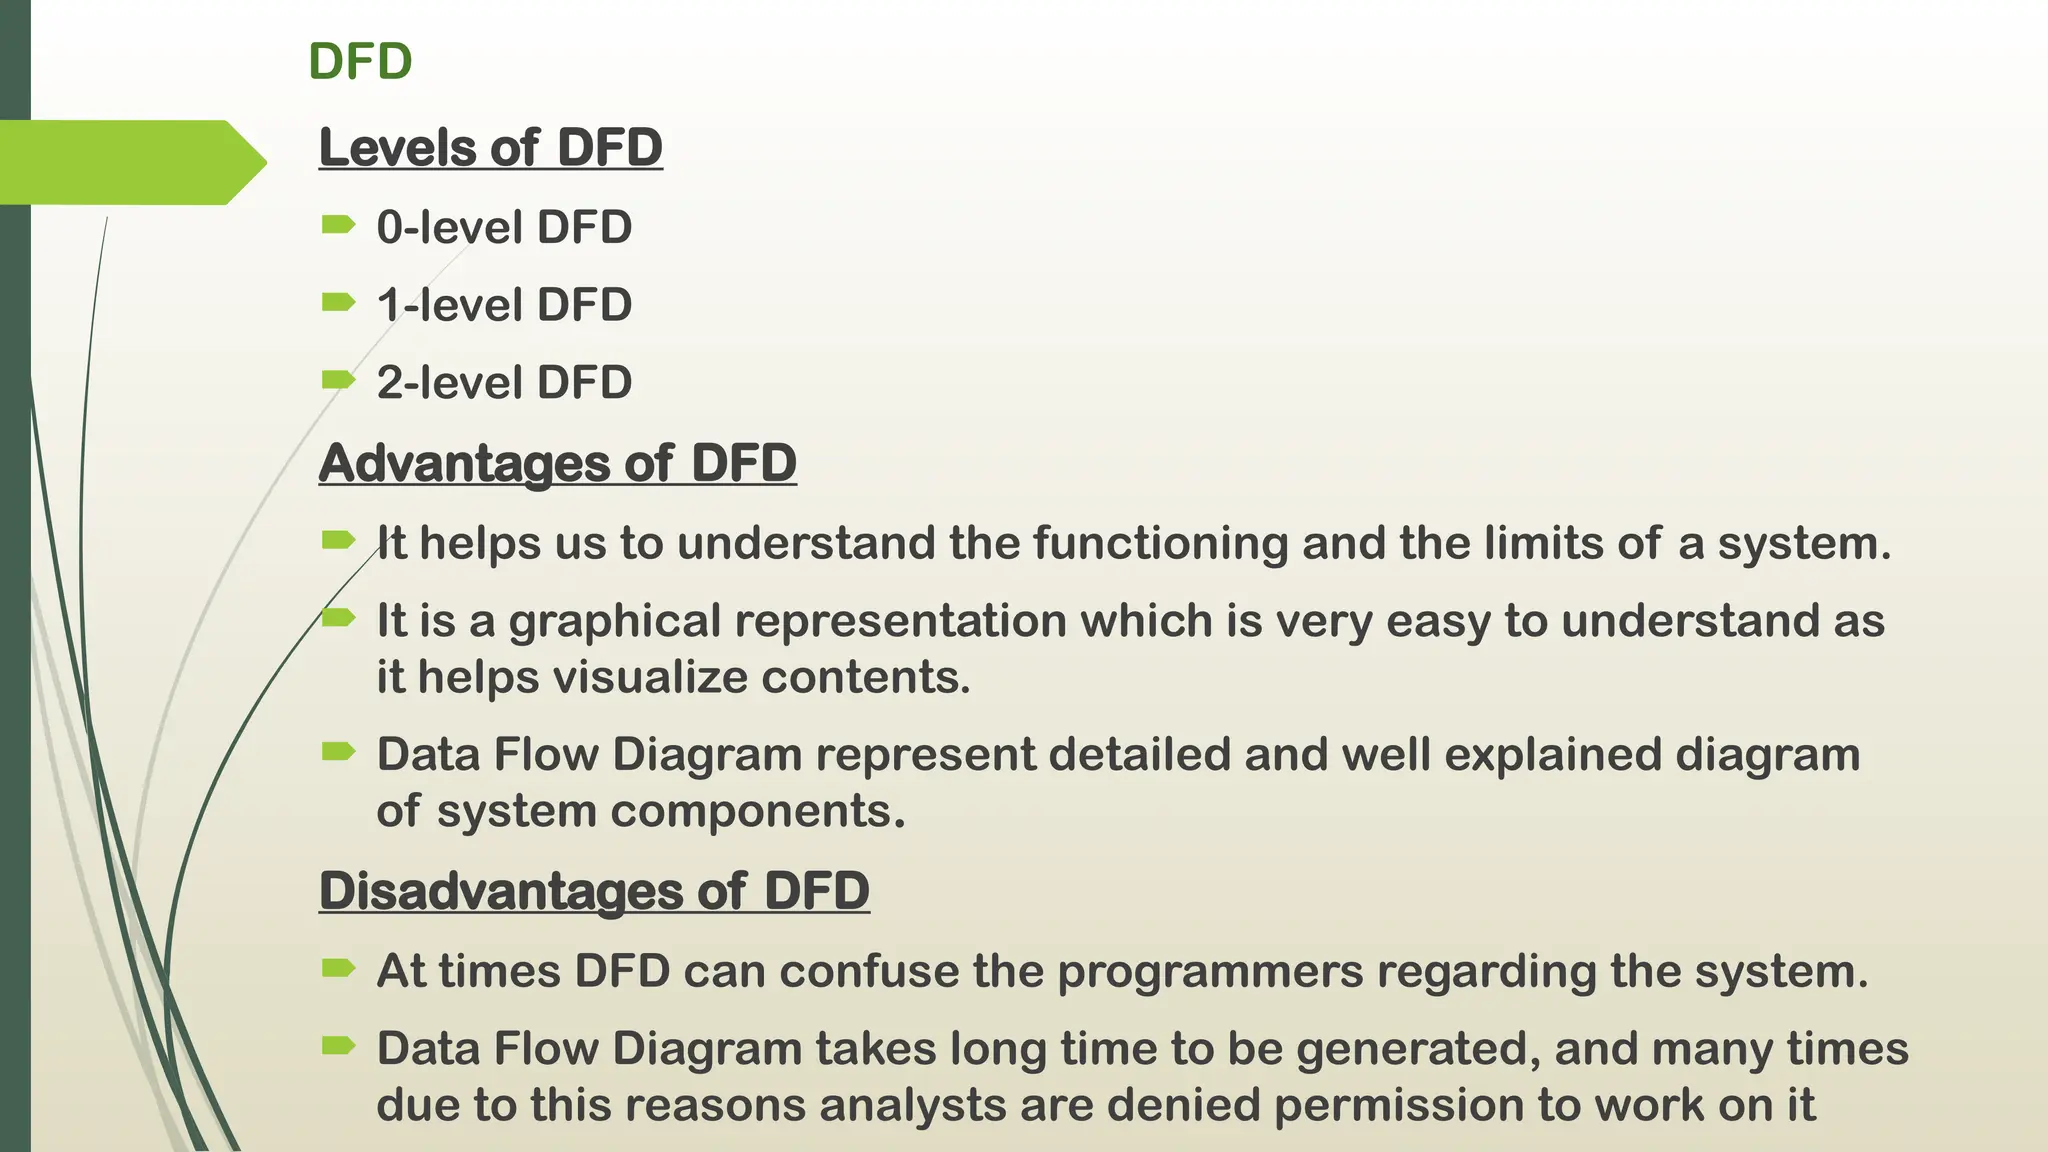
Levels of DFD
0-level DFD
1-level DFD
2-level DFD
Advantages of DFD
It helps us to understand the functioning and the limits of a system.
It is a graphical representation which is very easy to understand as
it helps visualize contents.
Data Flow Diagram represent detailed and well explained diagram
of system components.
Disadvantages of DFD
At times DFD can confuse the programmers regarding the system.
Data Flow Diagram takes long time to be generated, and many times
due to this reasons analysts are denied permission to work on it
17.
DFD
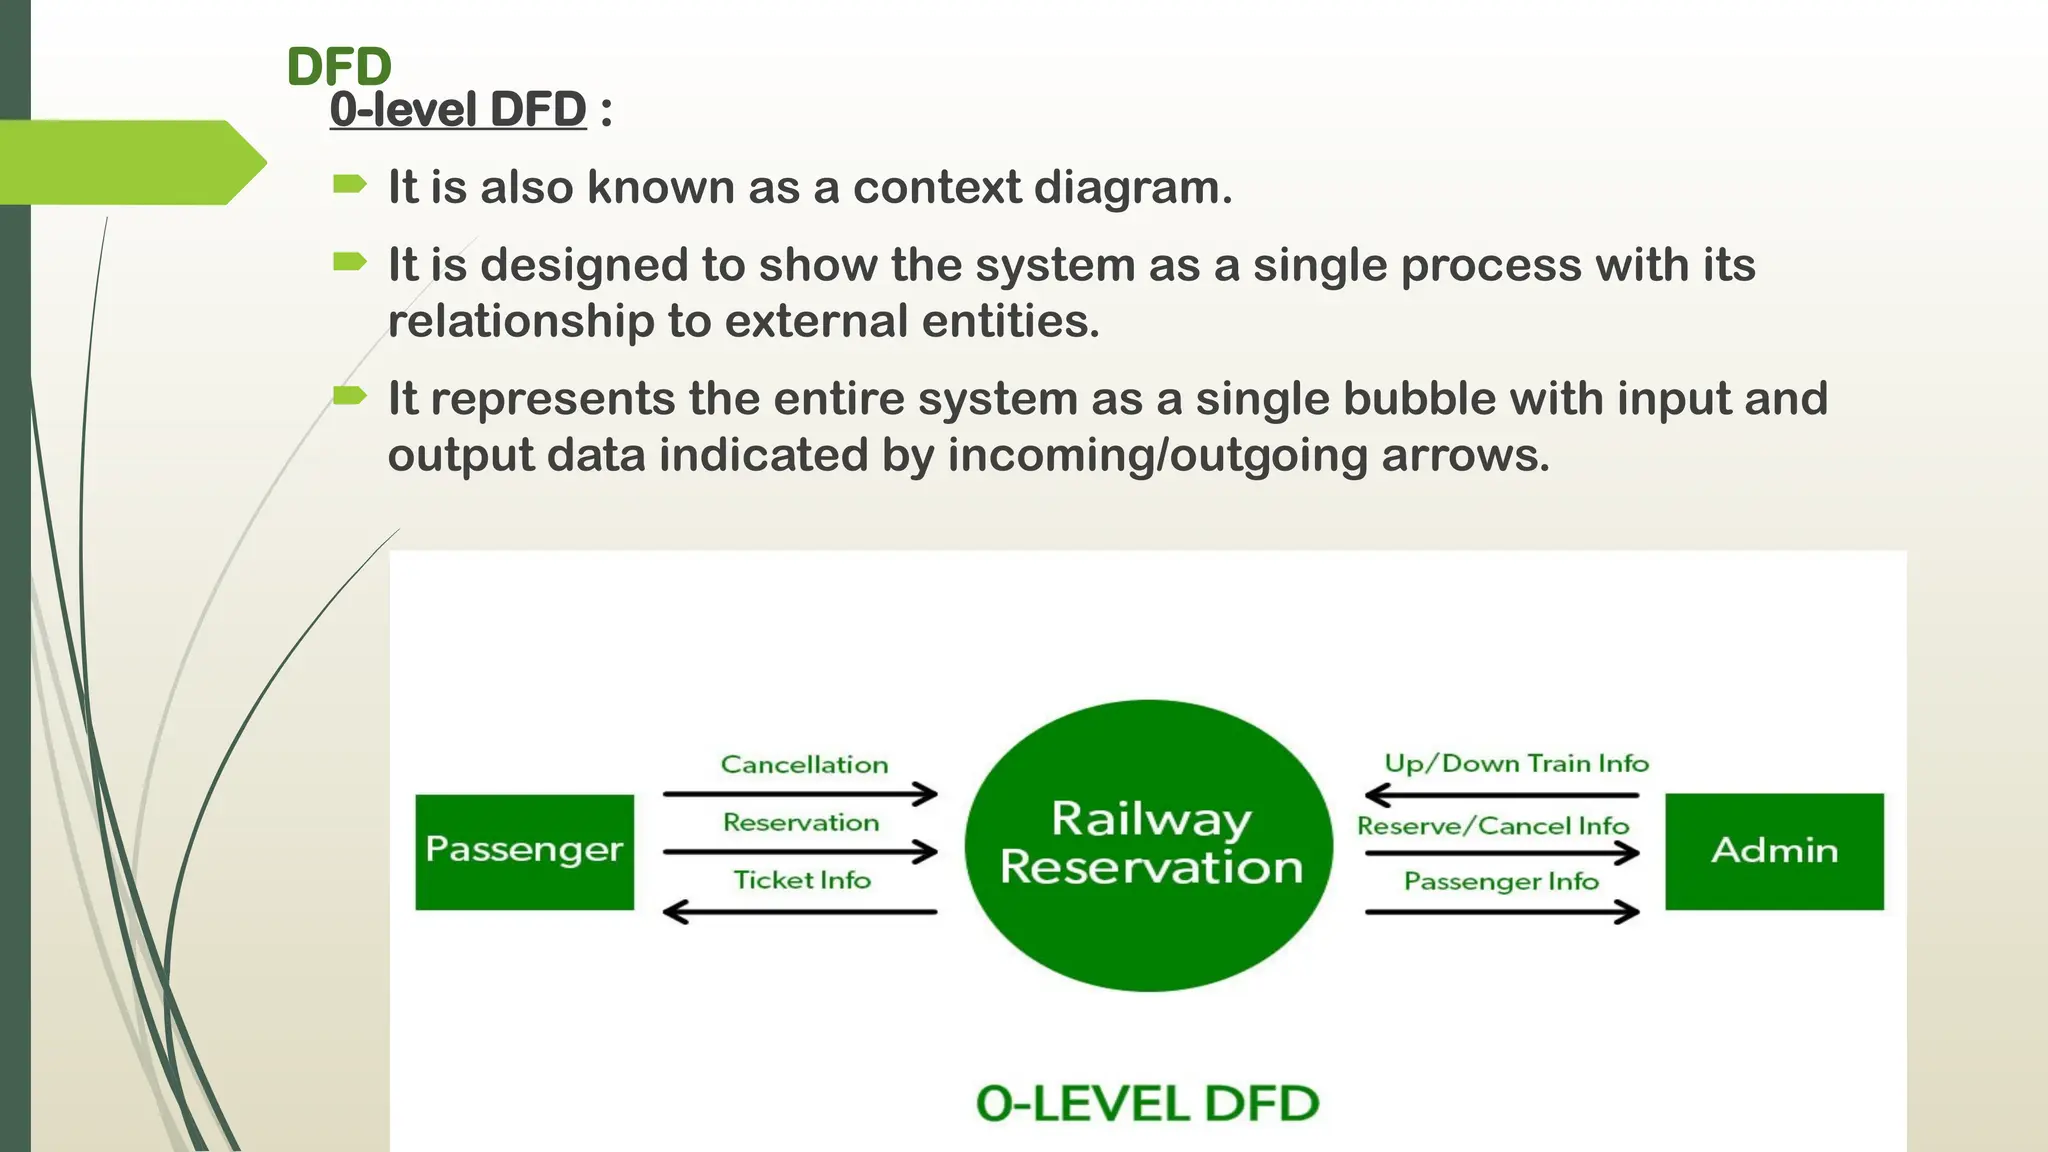
0-level DFD :
It is also known as a context diagram.
It is designed to show the system as a single process with its
relationship to external entities.
It represents the entire system as a single bubble with input and
output data indicated by incoming/outgoing arrows.
18.
DFD
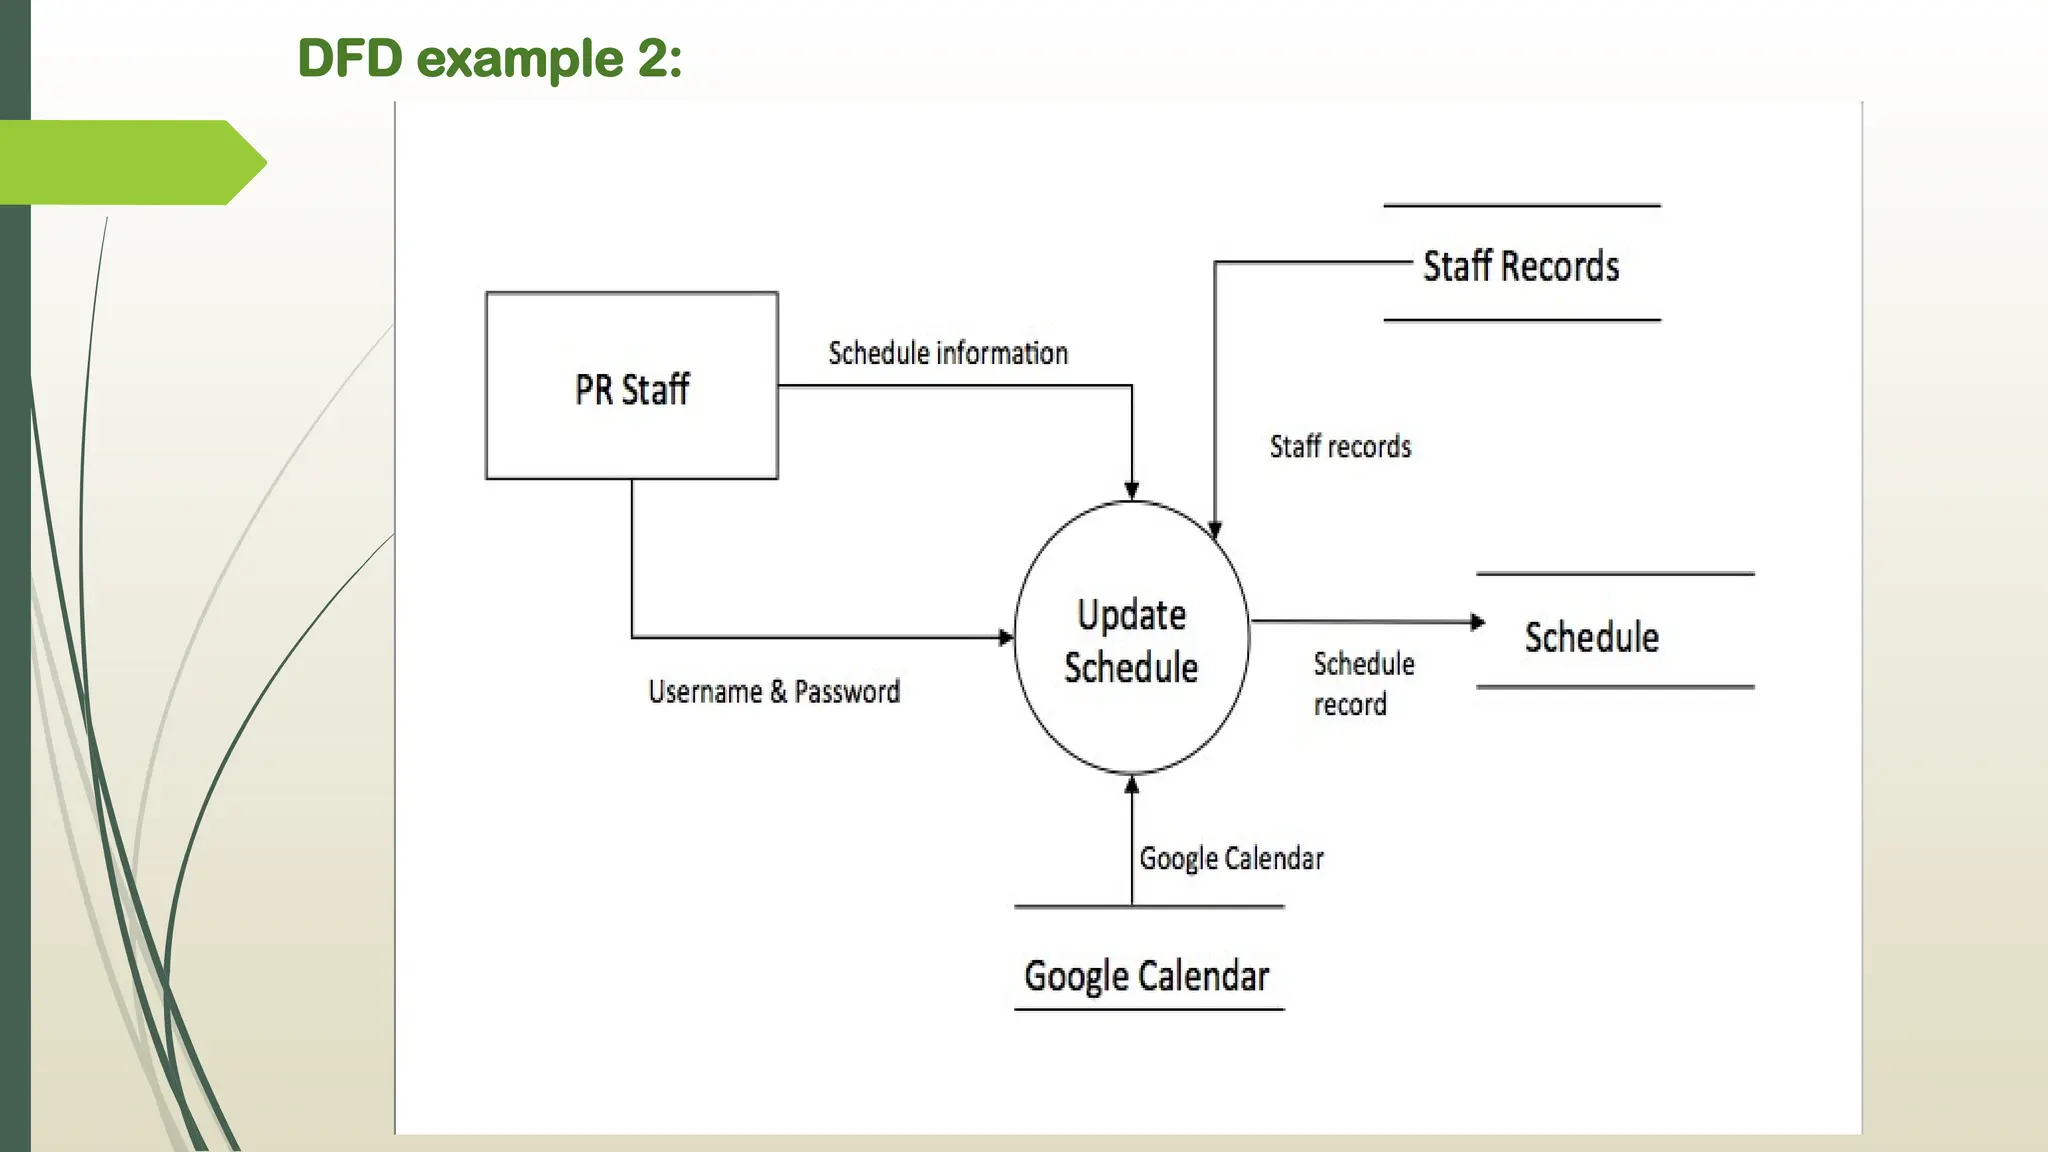
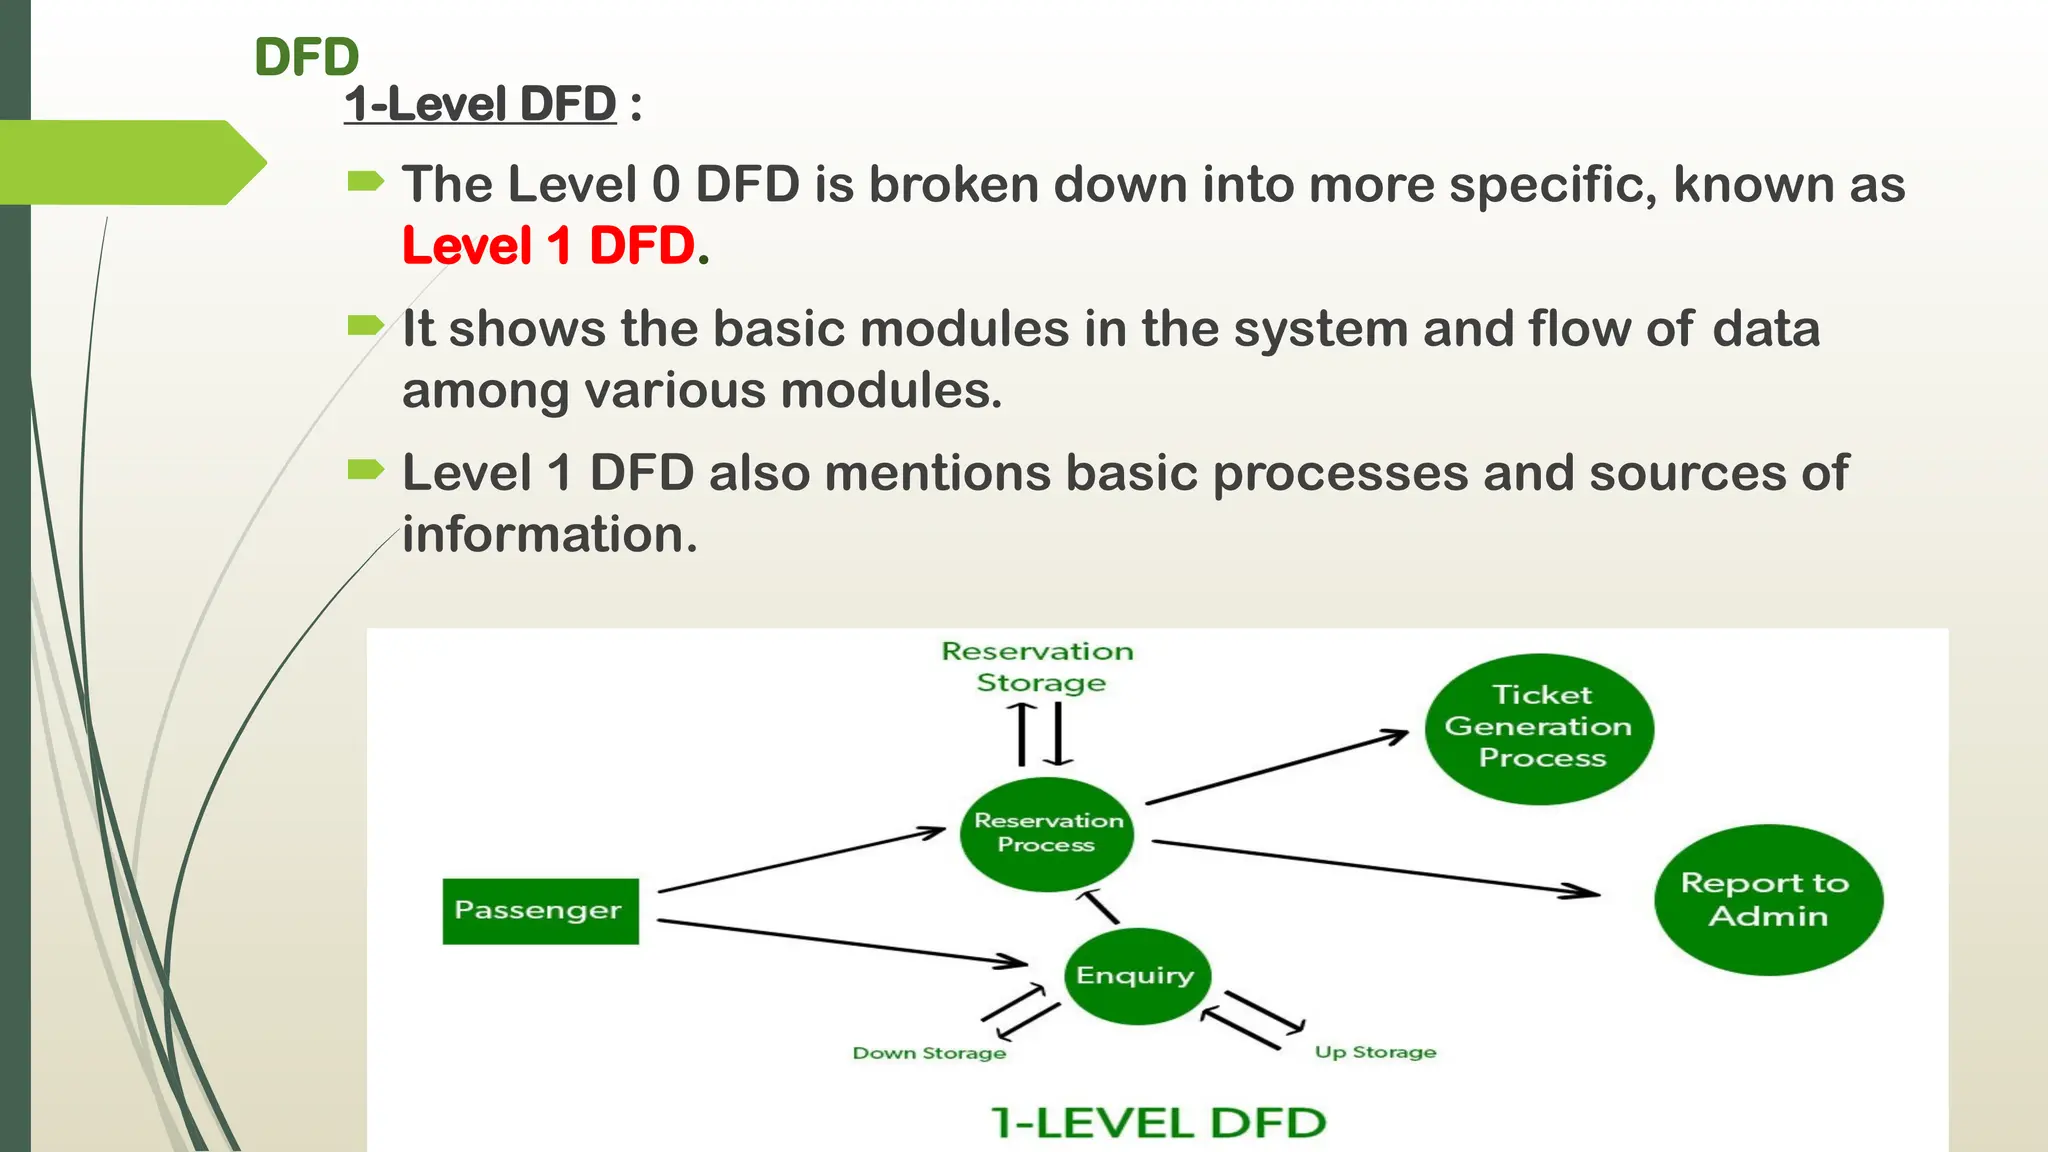
1-Level DFD :
The Level 0 DFD is broken down into more specific, known as
Level 1 DFD.
It shows the basic modules in the system and flow of data
among various modules.
Level 1 DFD also mentions basic processes and sources of
information.
19.
DFD
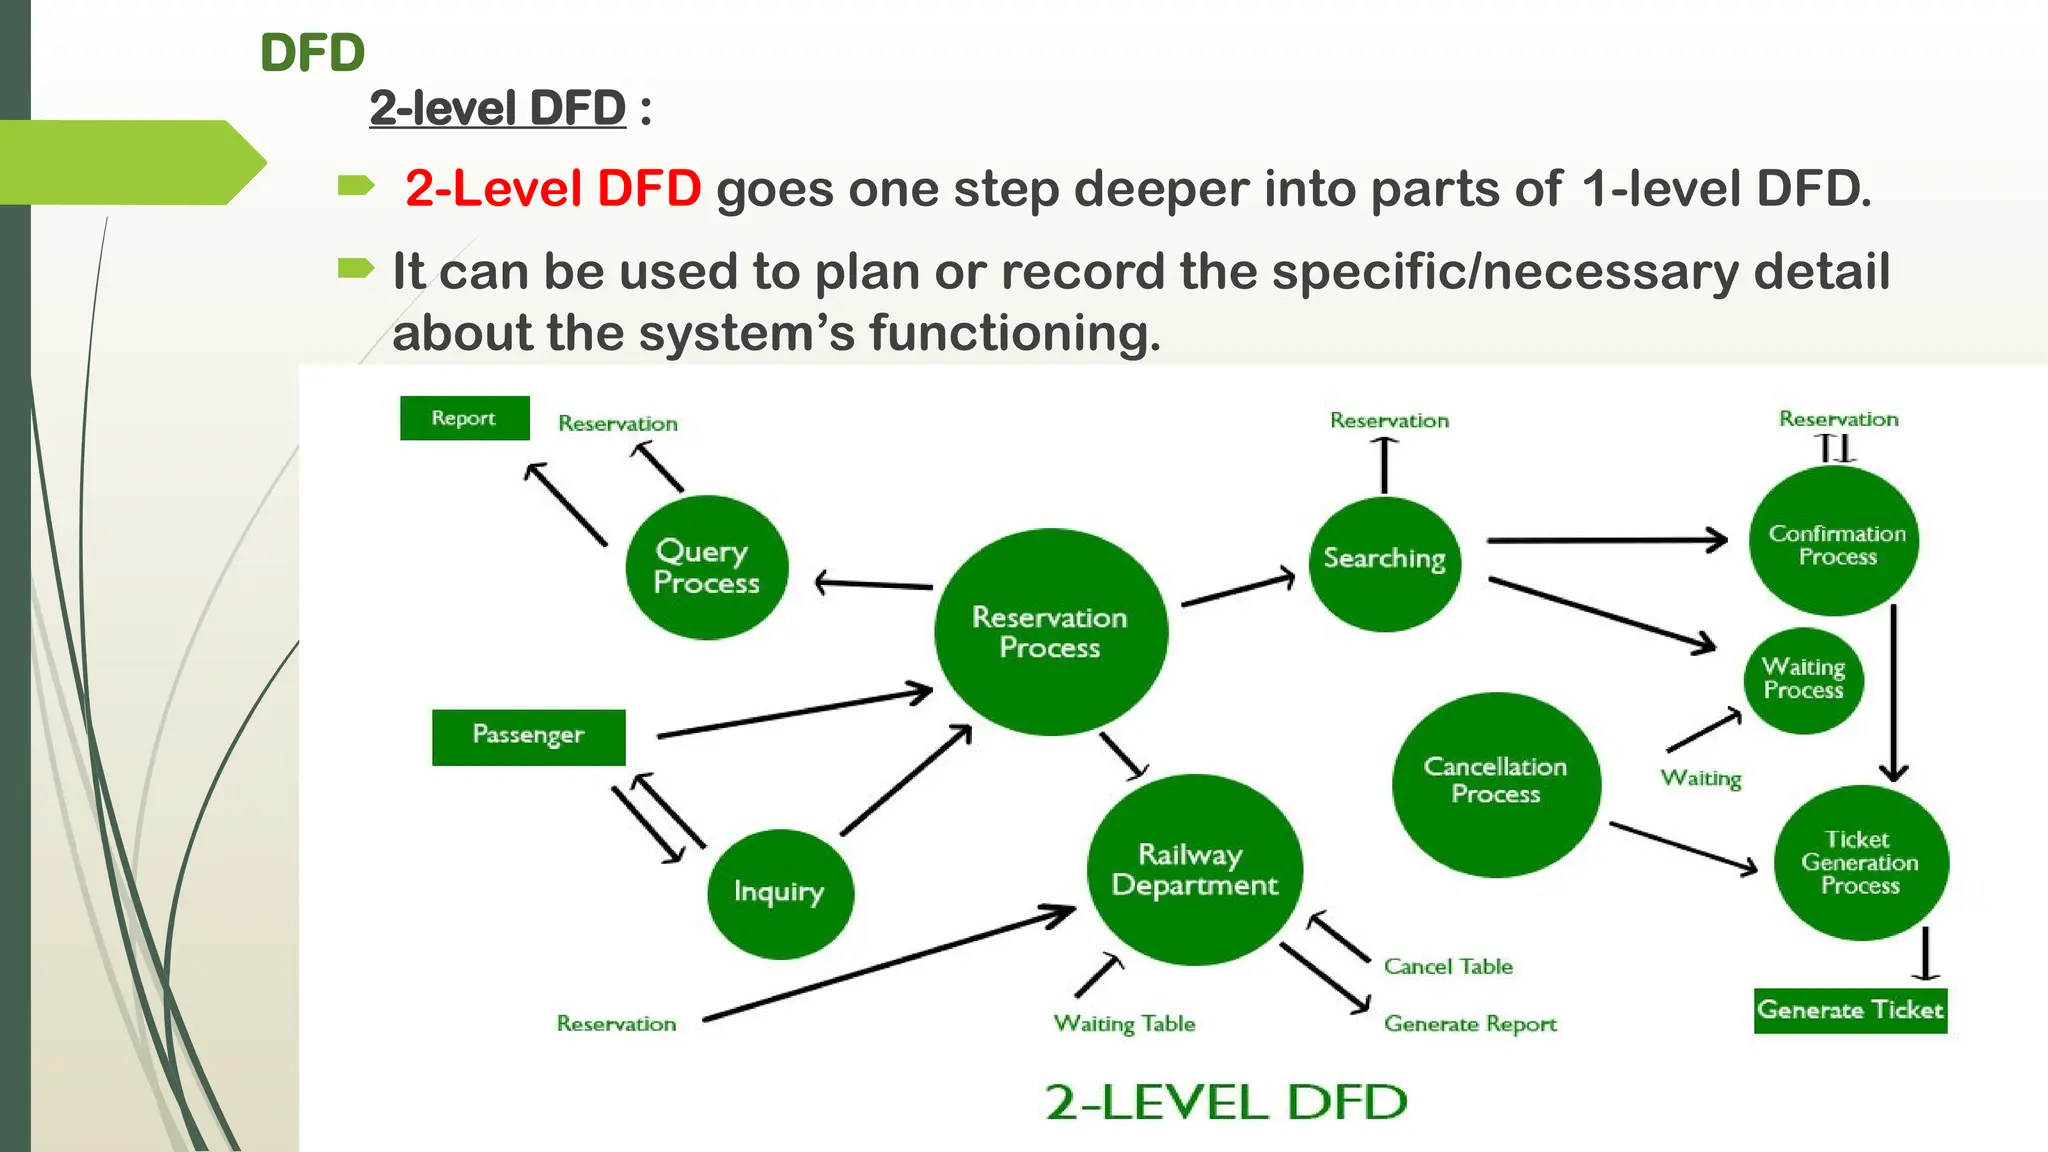
2-level DFD :
2-Level DFD goes one step deeper into parts of 1-level DFD.
It can be used to plan or record the specific/necessary detail
about the system’s functioning.
20.
Data Dictionary
Adata dictionary is a collection of the names, definitions, and
attributes for data elements and models.
The data in a data dictionary is the metadata about the
database.{ metadata i.e data about the database}
The data dictionary is very important as it contains
information such as what is in the database,
- who is allowed to access it,
- where is the database physically stored etc.
The users of the database normally don't interact with the data
dictionary, it is only handled by the database administrators.
21.
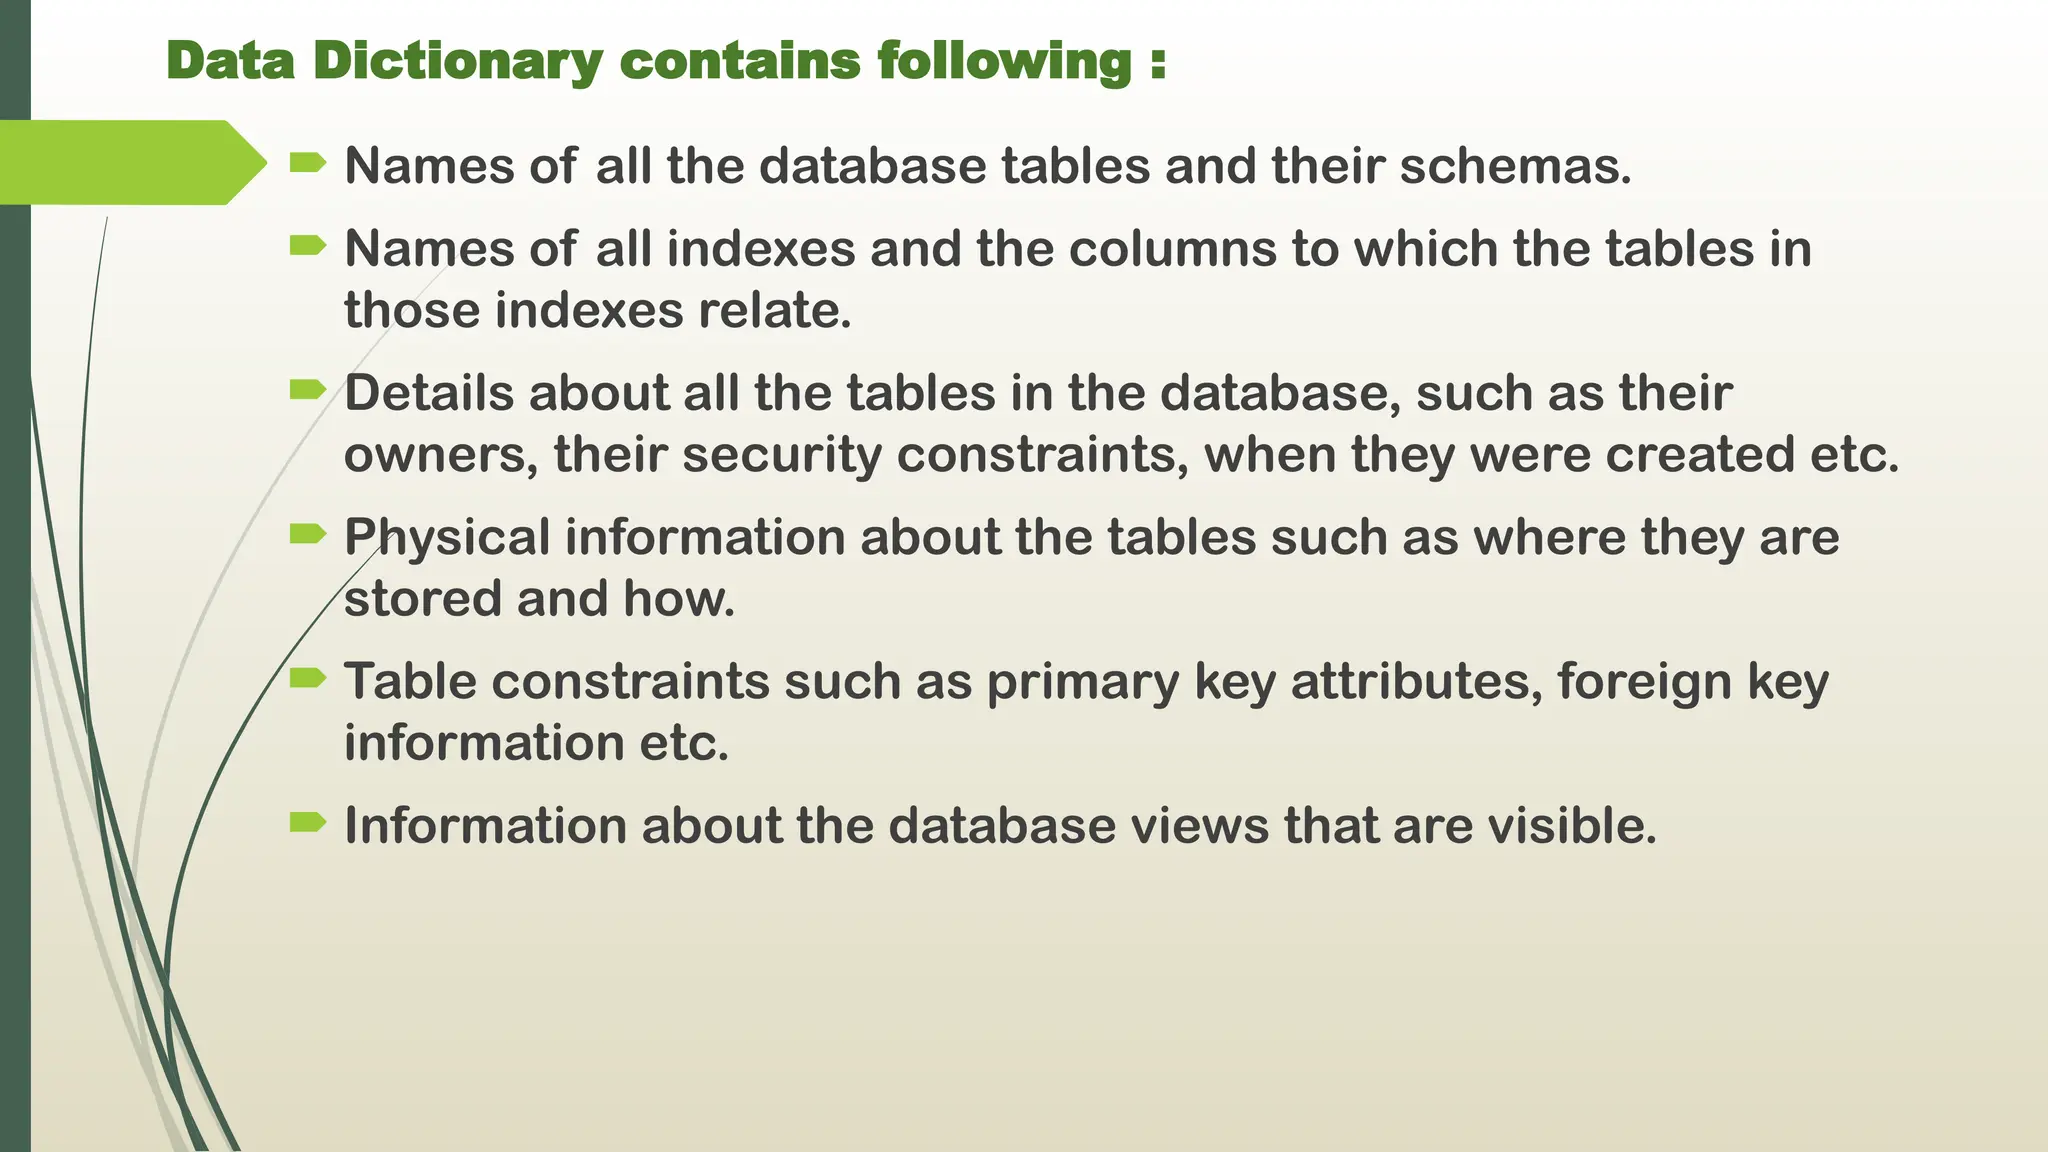
Data Dictionary containsfollowing :
Names of all the database tables and their schemas.
Names of all indexes and the columns to which the tables in
those indexes relate.
Details about all the tables in the database, such as their
owners, their security constraints, when they were created etc.
Physical information about the tables such as where they are
stored and how.
Table constraints such as primary key attributes, foreign key
information etc.
Information about the database views that are visible.
22.
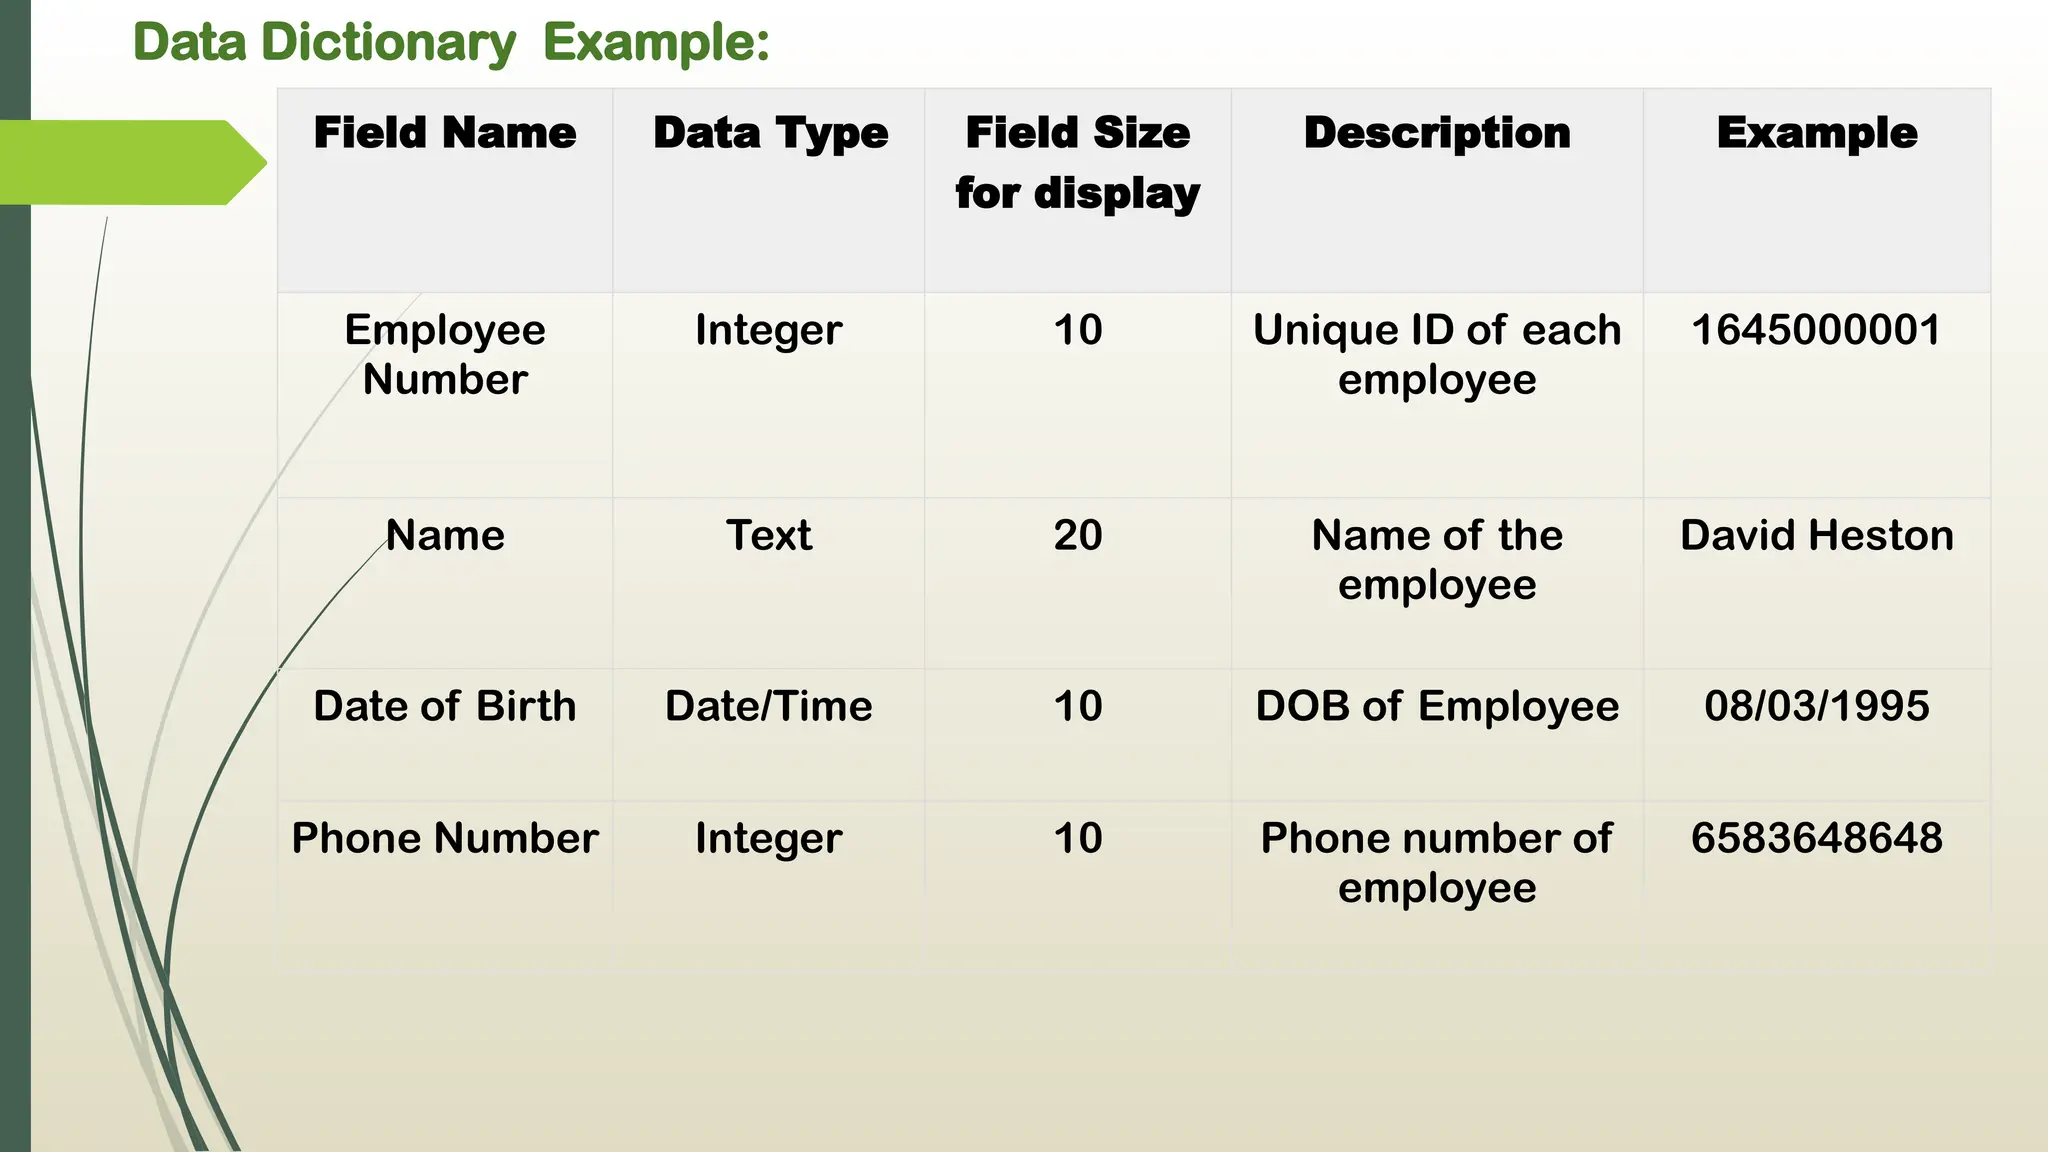
Data Dictionary Example:
FieldName Data Type Field Size
for display
Description Example
Employee
Number
Integer 10 Unique ID of each
employee
1645000001
Name Text 20 Name of the
employee
David Heston
Date of Birth Date/Time 10 DOB of Employee 08/03/1995
Phone Number Integer 10 Phone number of
employee
6583648648
23.
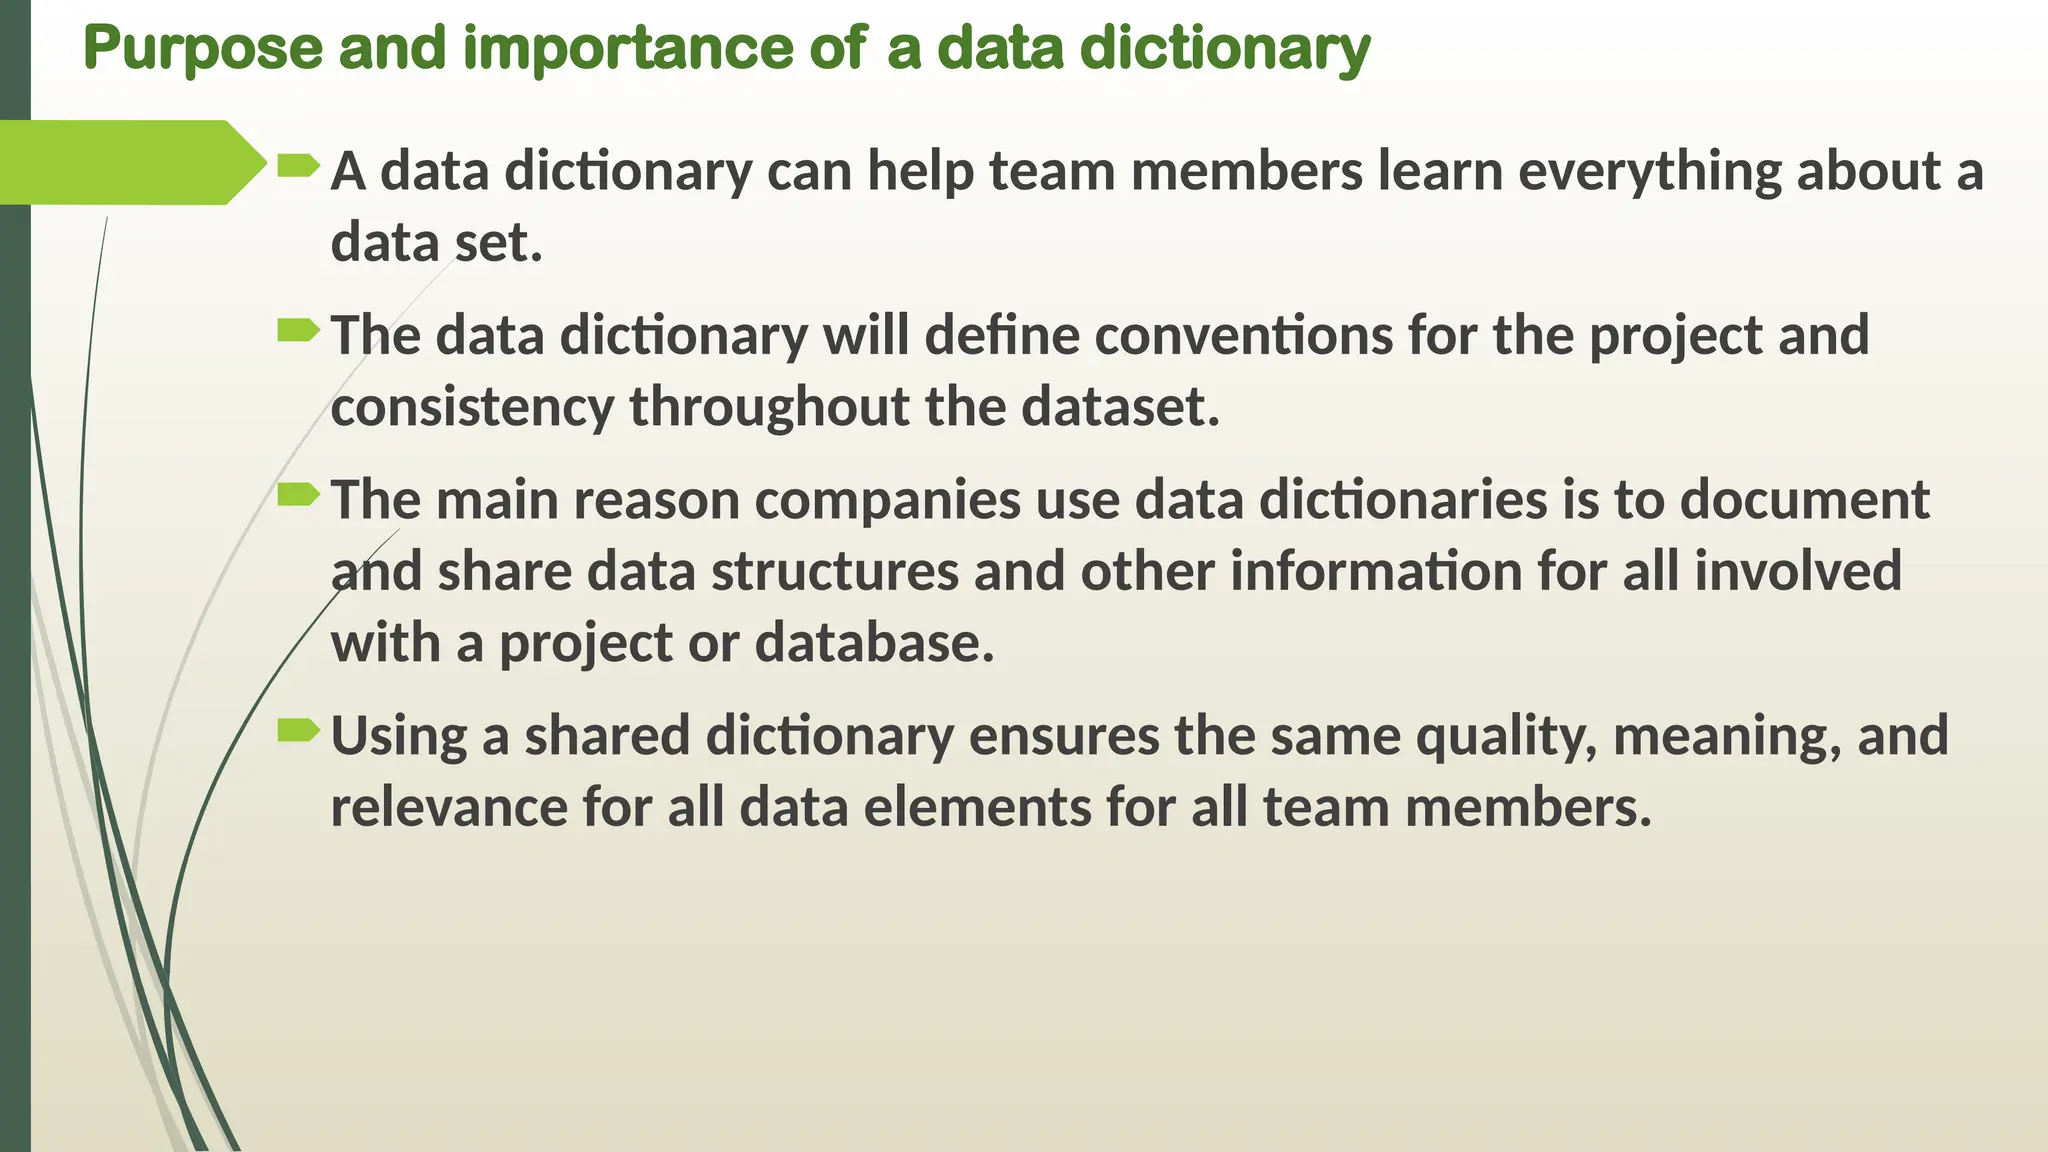
Purpose and importanceof a data dictionary
A data dictionary can help team members learn everything about a
data set.
The data dictionary will define conventions for the project and
consistency throughout the dataset.
The main reason companies use data dictionaries is to document
and share data structures and other information for all involved
with a project or database.
Using a shared dictionary ensures the same quality, meaning, and
relevance for all data elements for all team members.
24.
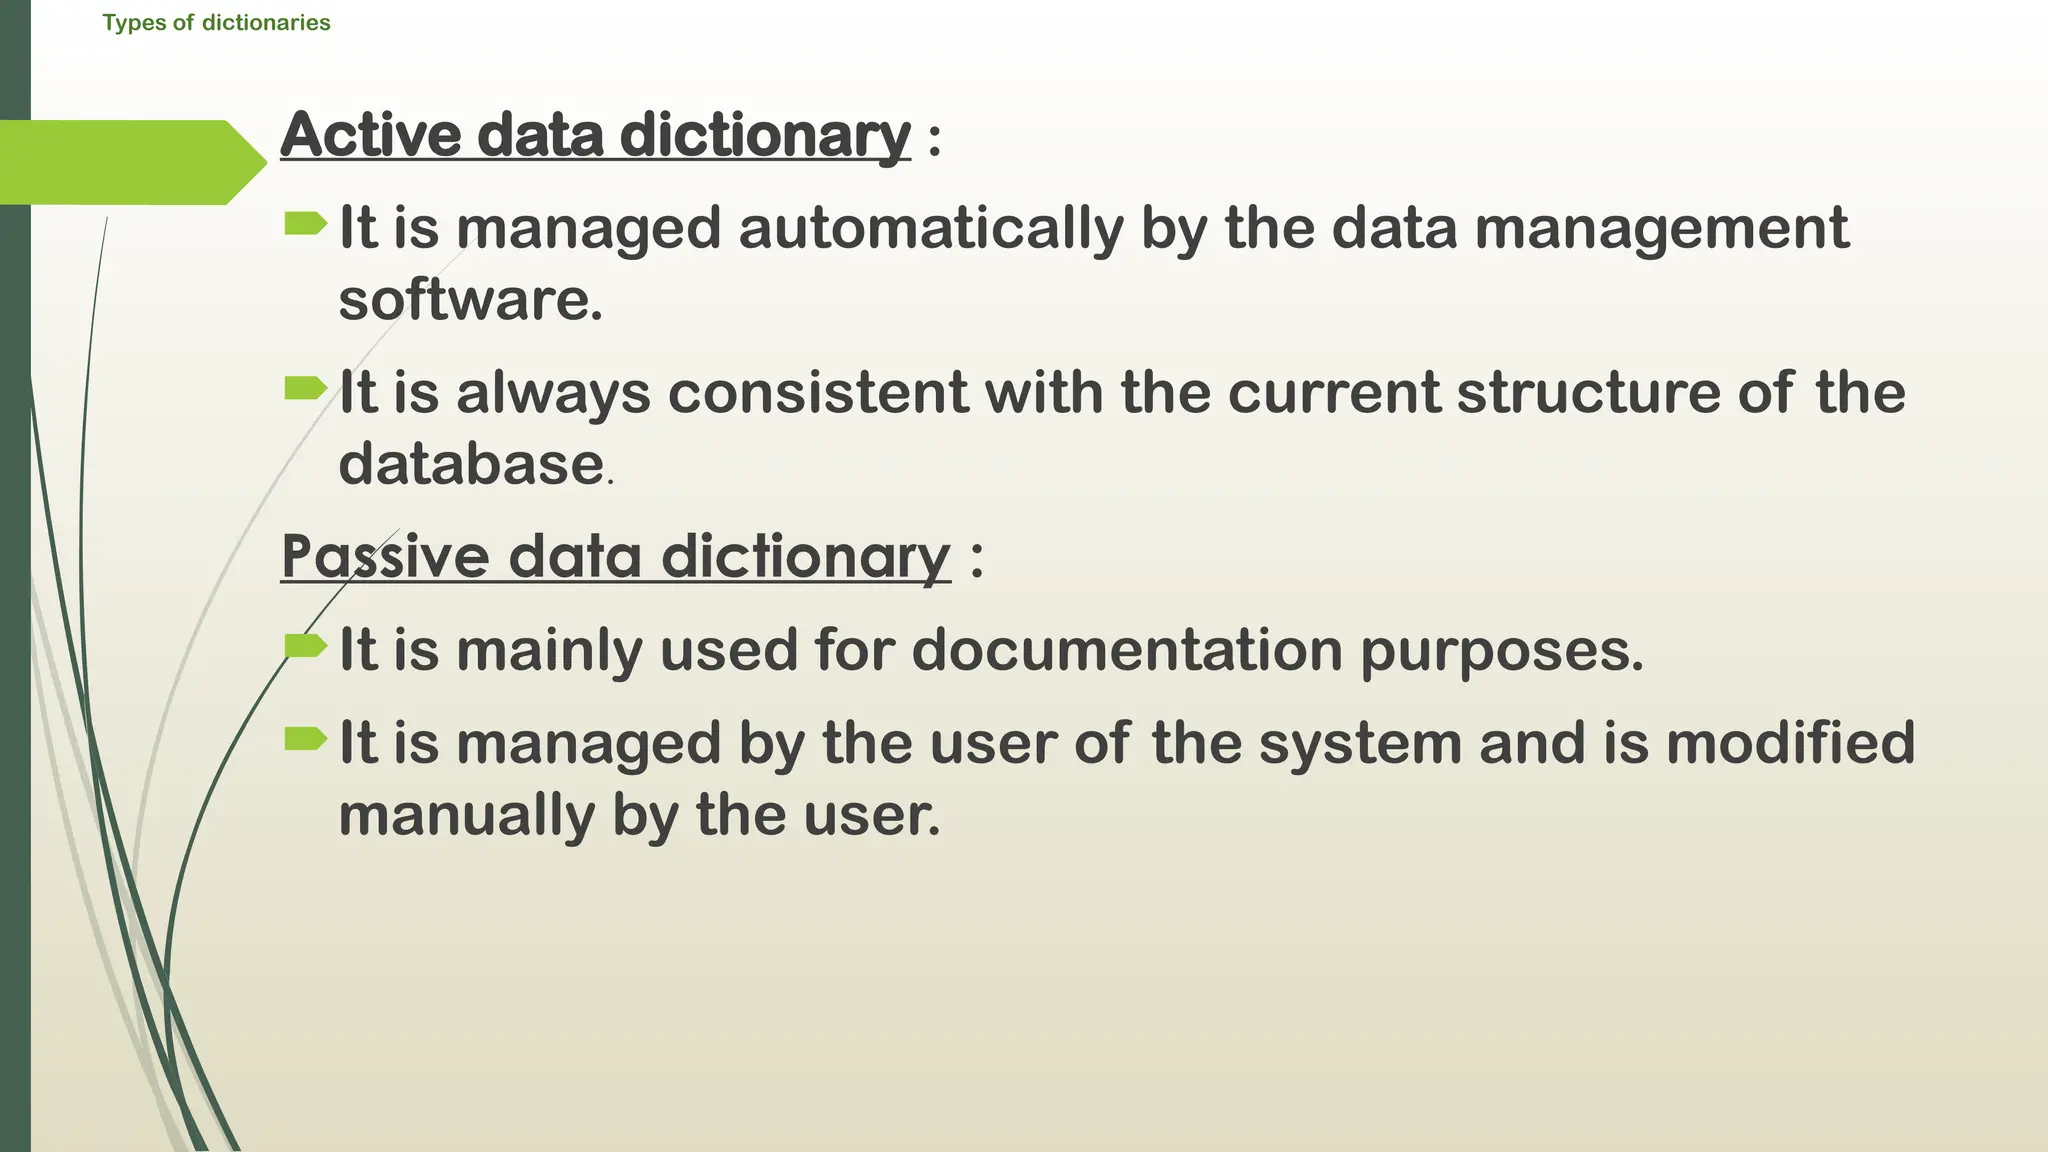
Types of dictionaries
Activedata dictionary :
It is managed automatically by the data management
software.
It is always consistent with the current structure of the
database.
Passive data dictionary :
It is mainly used for documentation purposes.
It is managed by the user of the system and is modified
manually by the user.
25.
How to Createa Data Dictionary ?
Many businesses rely on database management systems
(DBMS), and these systems most often have built-in active data
dictionaries.
Documentation can be generated with SQL, Server, Oracle, or
MYSQL.
To create a passive data dictionary, analysts will need to build
one separately from a DBMS since passive dictionaries aren’t
managed by a management system.
SQL, Server, and Oracle can be used to build a dictionary, and
there’s even a template in Excel.
26.
IPO CHARTS :
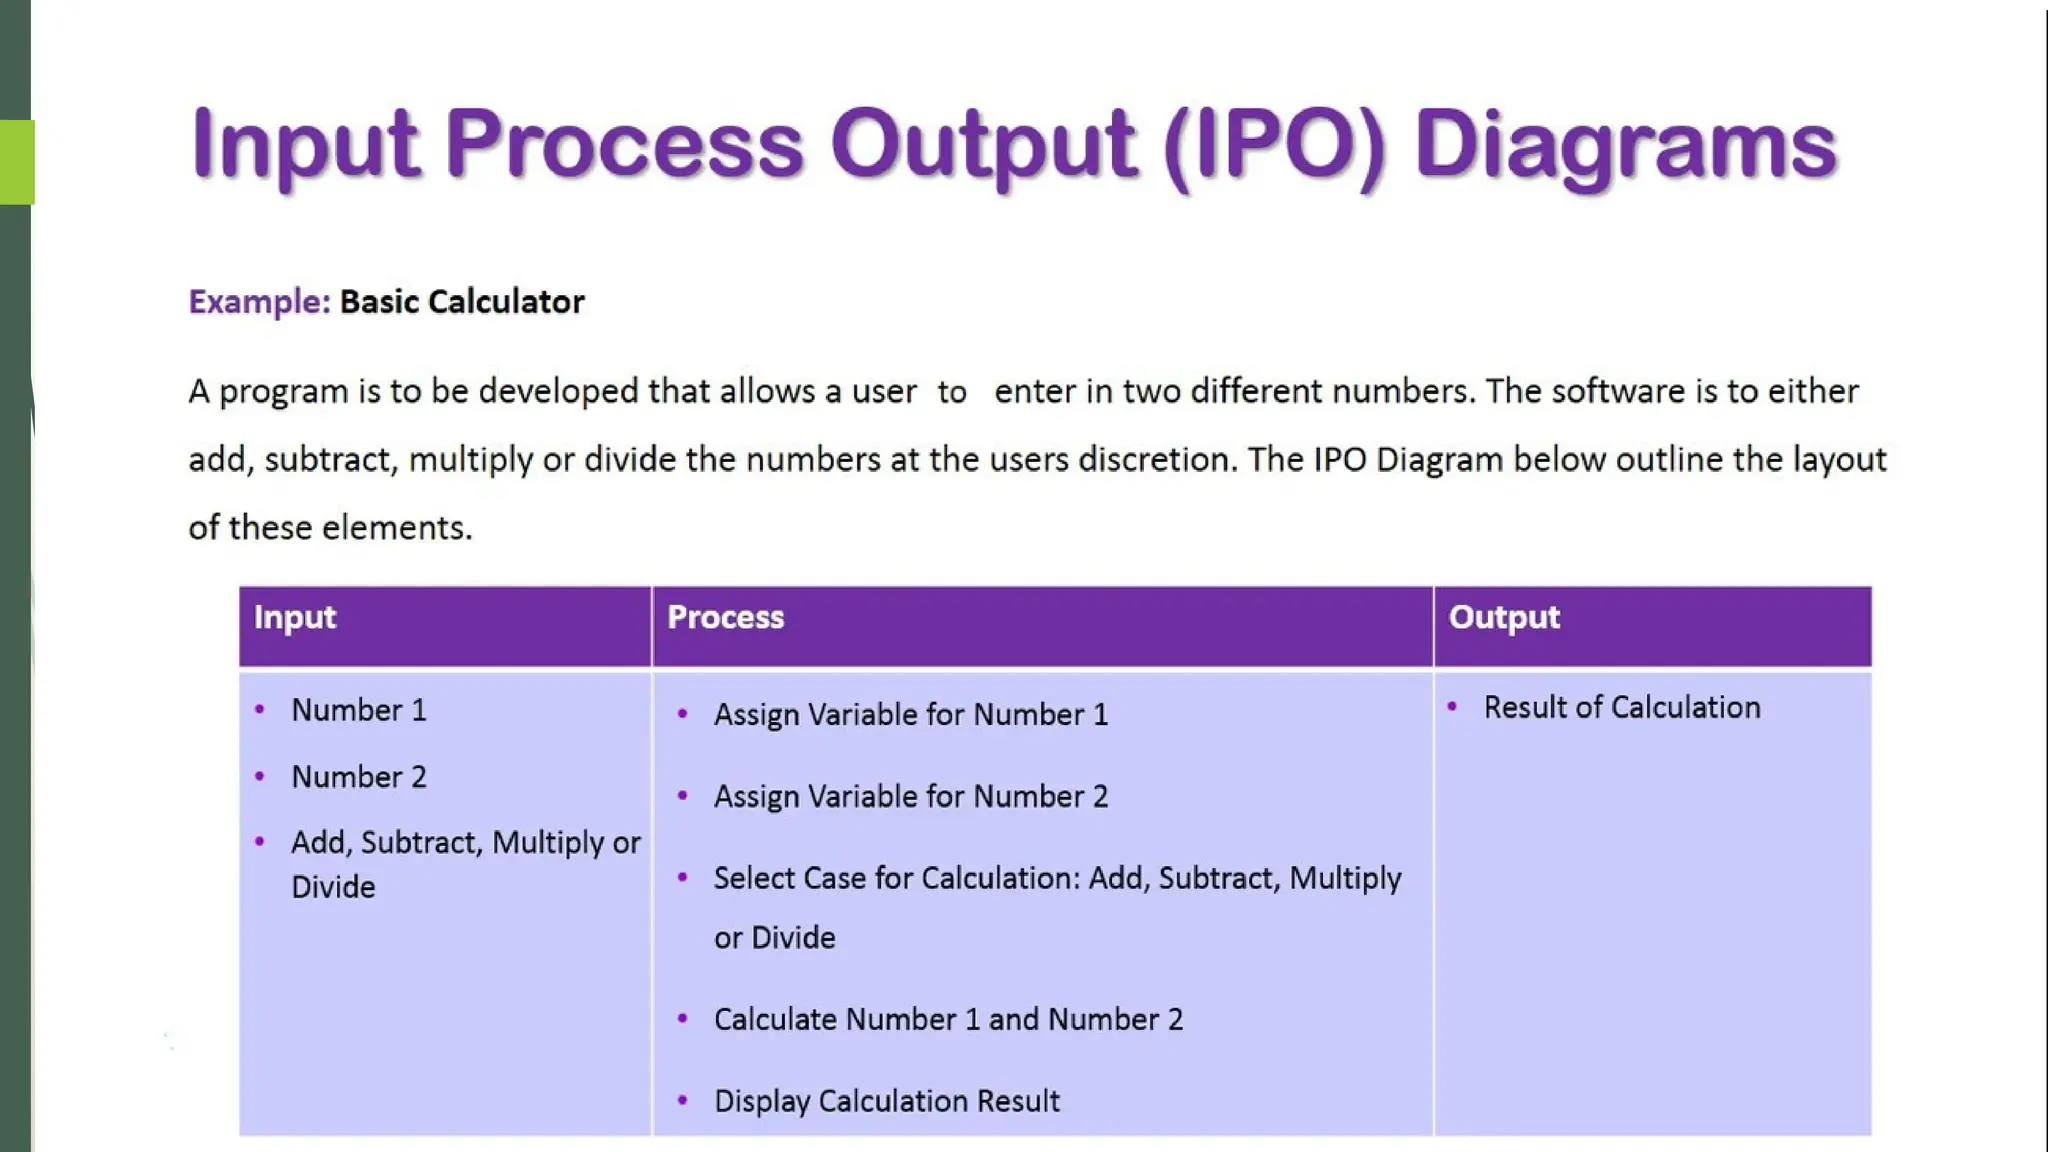
An IPO (Input-Process-Output) Diagram is a very high-level
diagram .
It is used to describe business processes with the description
of each component in word.
It shows a process key inputs and resulting outputs after a set
of operations. IPO diagrams are widely used in software
engineering applications.
Components of IPO :
1. Input
2. Process
3. Output
4. Variation
27.
IPO CHARTS :
Inputs
I. It Represent everything that enters the system to be
processed or transformed to achieve the desired outcome.
II. Inputs can be raw materials, information, data or even an
outputs from another process.
Process
I. It Represent the set of operations, calculations and steps
required to transform the given inputs into the desired
outcome.
II. Process could involve human labor, machines or a combination
of both.
28.
IPO
Outputs
I. Representthe final result. Outputs can be finished goods,
products, data or new information.
II. In some occasions, outcomes can be inputs for different
processes as well.
Variations
- Some academics and professionals use a modified version the
simple IPO Diagram,
- which consists in adding two additional components: controls
and enablers.
- Both components connect to the ‘Process’ box from the
original diagram and help provide more specifications of the
process being analyzed.
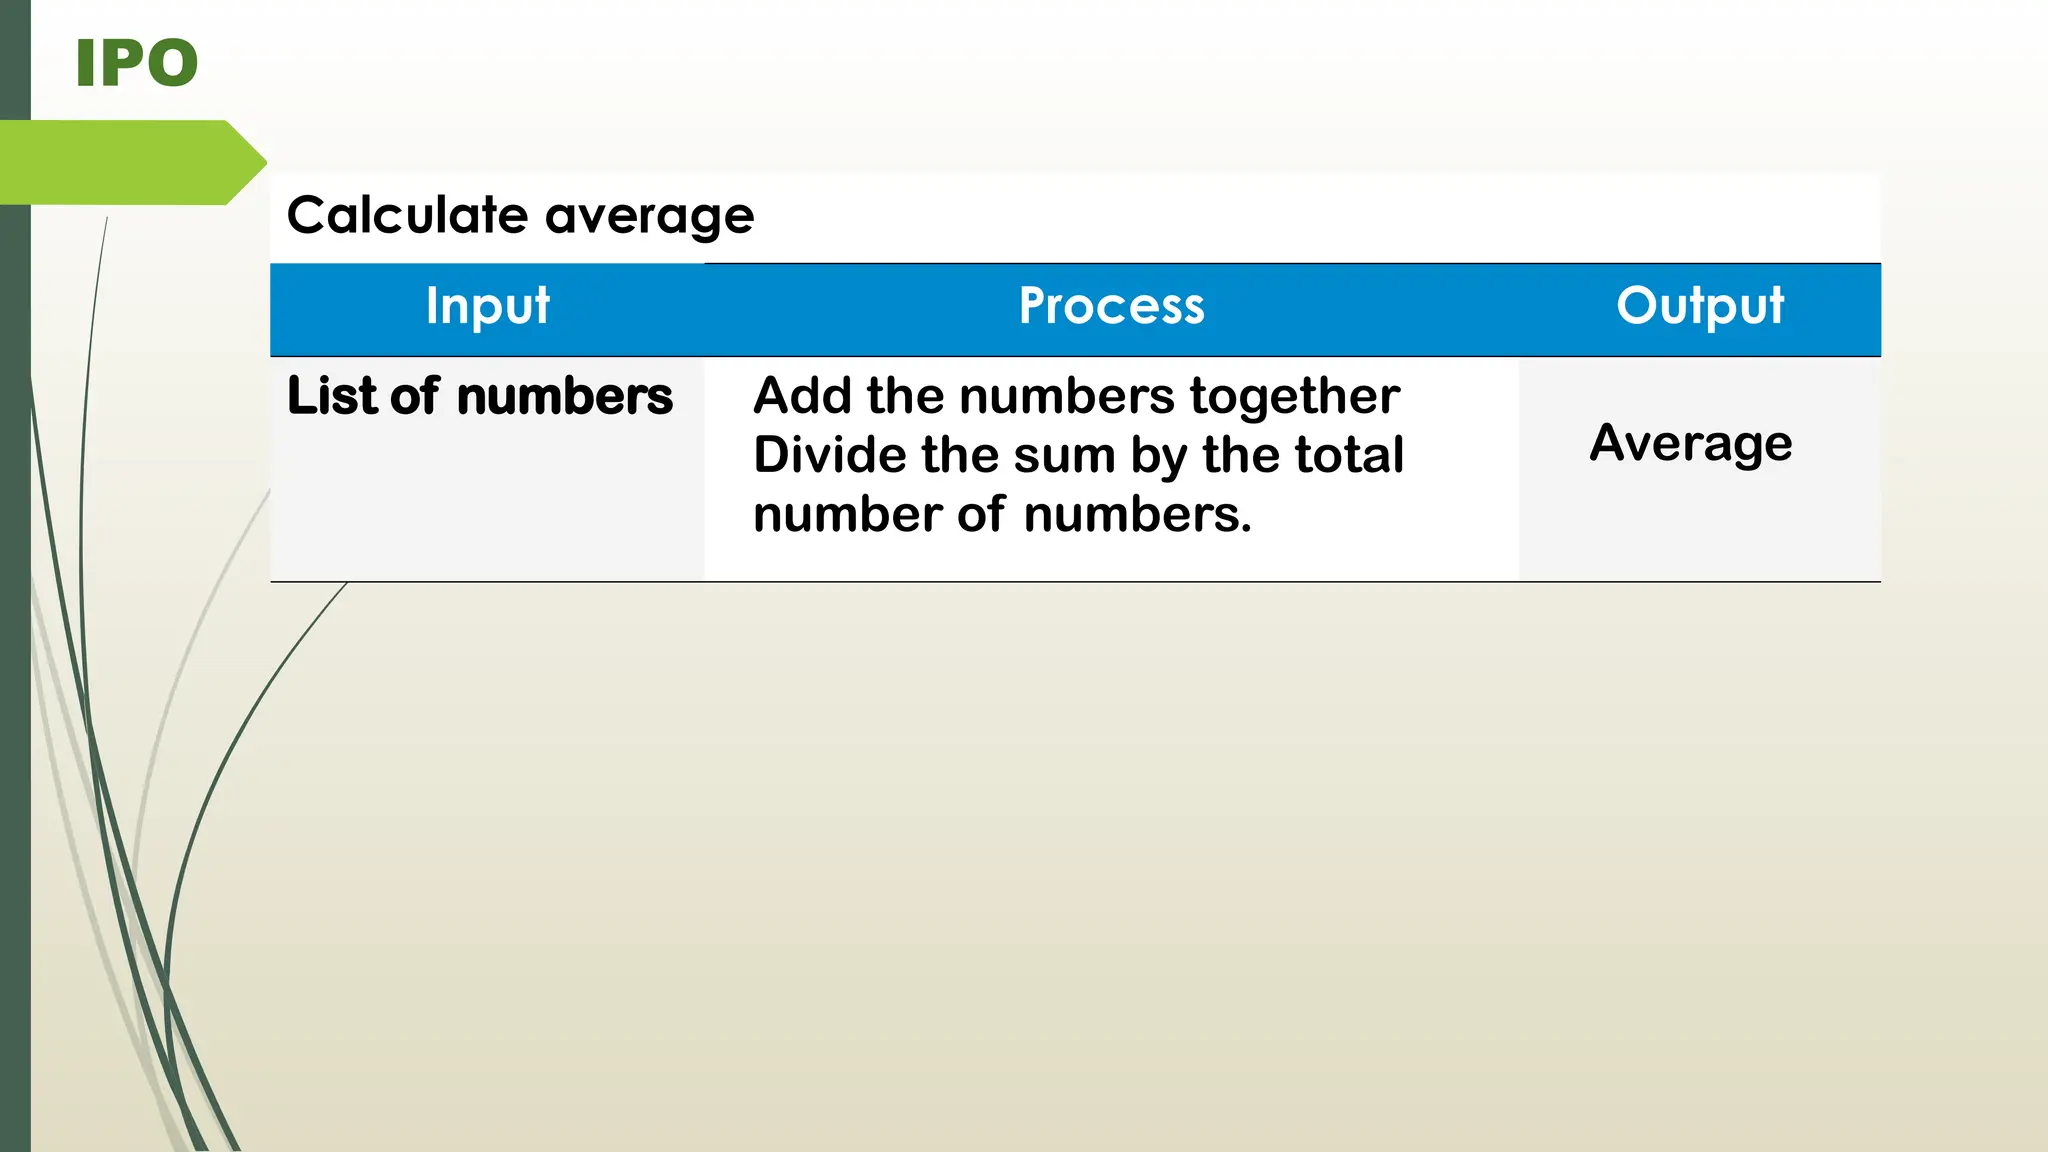
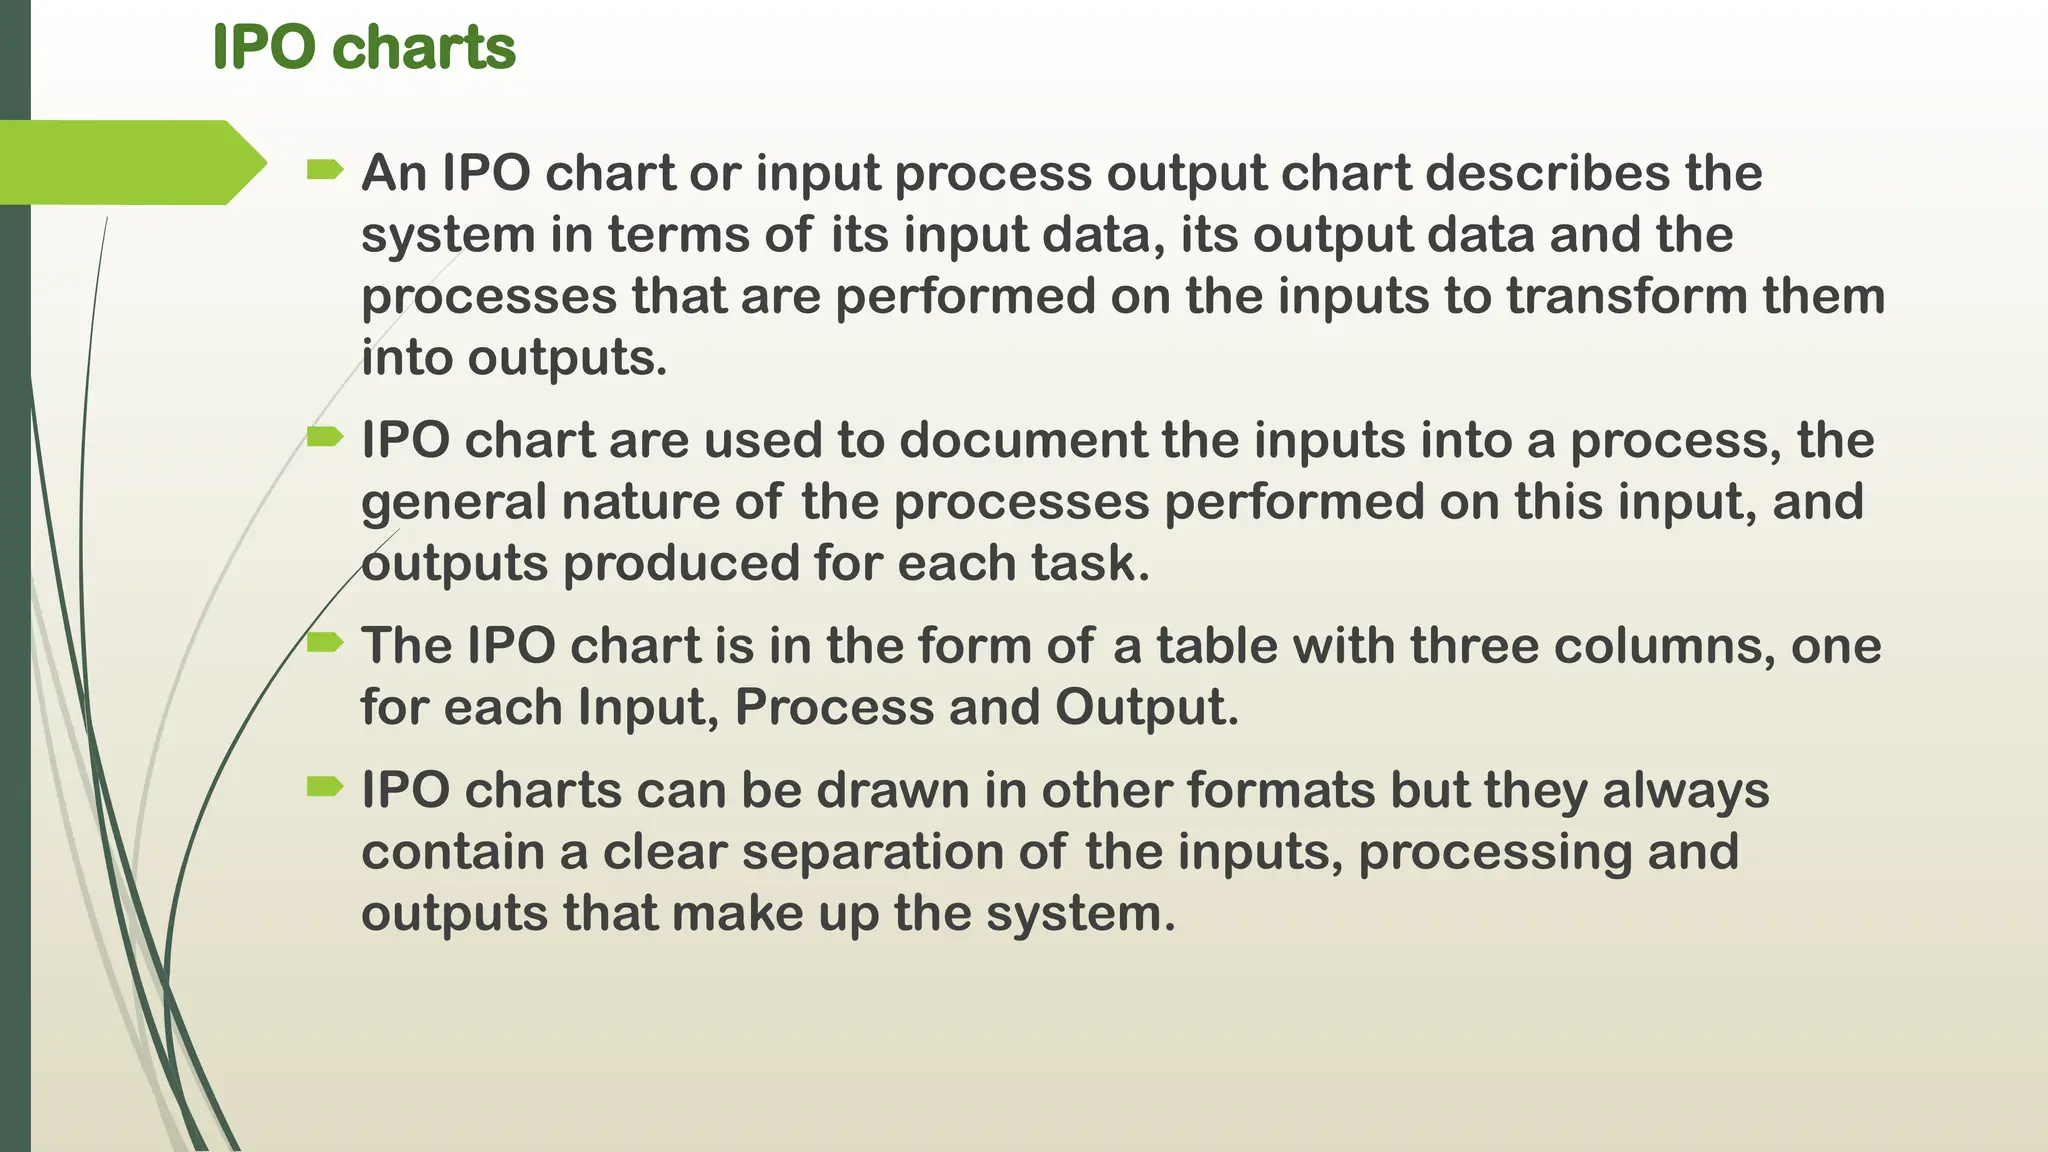
IPO charts
AnIPO chart or input process output chart describes the
system in terms of its input data, its output data and the
processes that are performed on the inputs to transform them
into outputs.
IPO chart are used to document the inputs into a process, the
general nature of the processes performed on this input, and
outputs produced for each task.
The IPO chart is in the form of a table with three columns, one
for each Input, Process and Output.
IPO charts can be drawn in other formats but they always
contain a clear separation of the inputs, processing and
outputs that make up the system.
32.
HIPO Charts
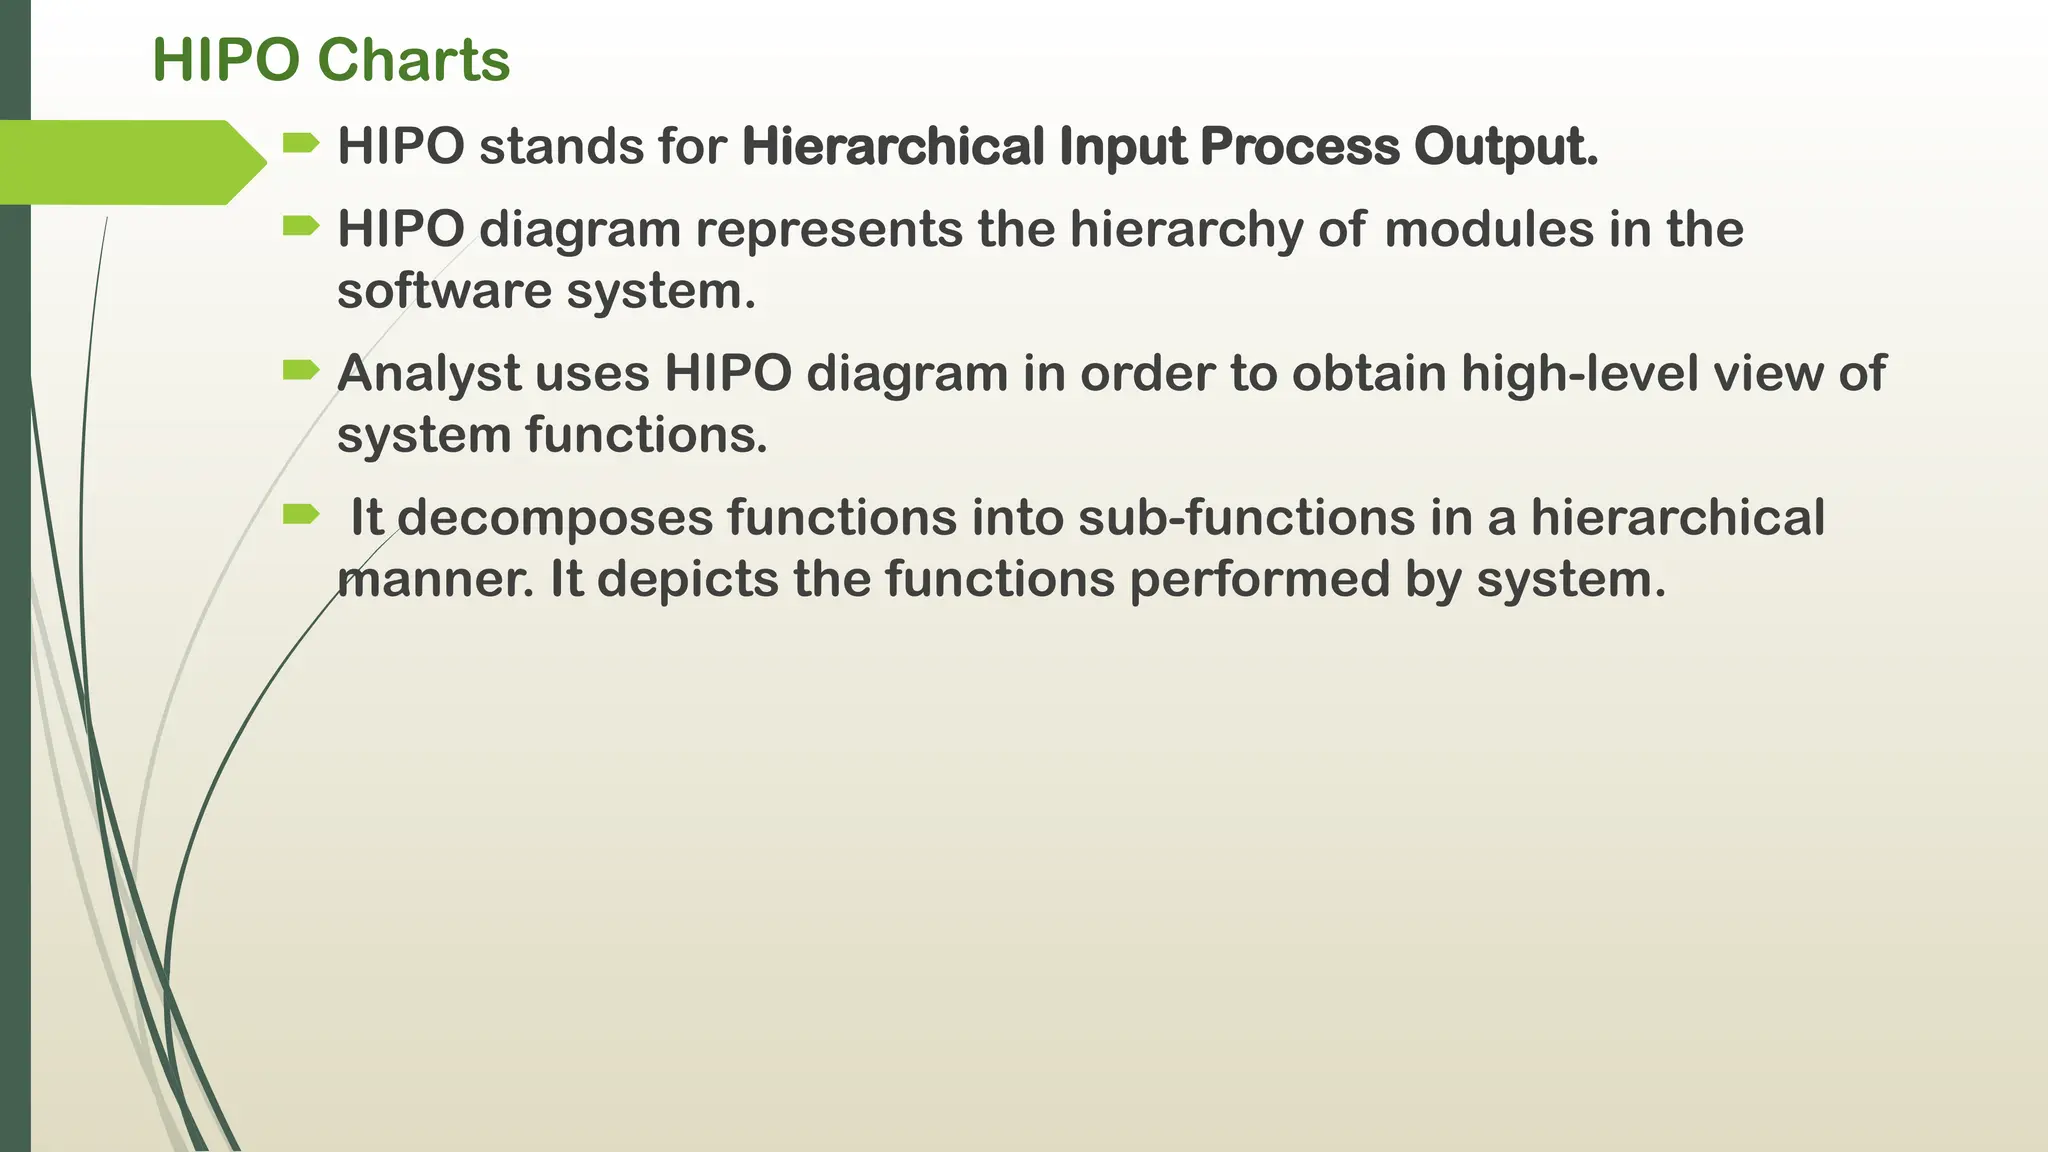
HIPOstands for Hierarchical Input Process Output.
HIPO diagram represents the hierarchy of modules in the
software system.
Analyst uses HIPO diagram in order to obtain high-level view of
system functions.
It decomposes functions into sub-functions in a hierarchical
manner. It depicts the functions performed by system.
33.
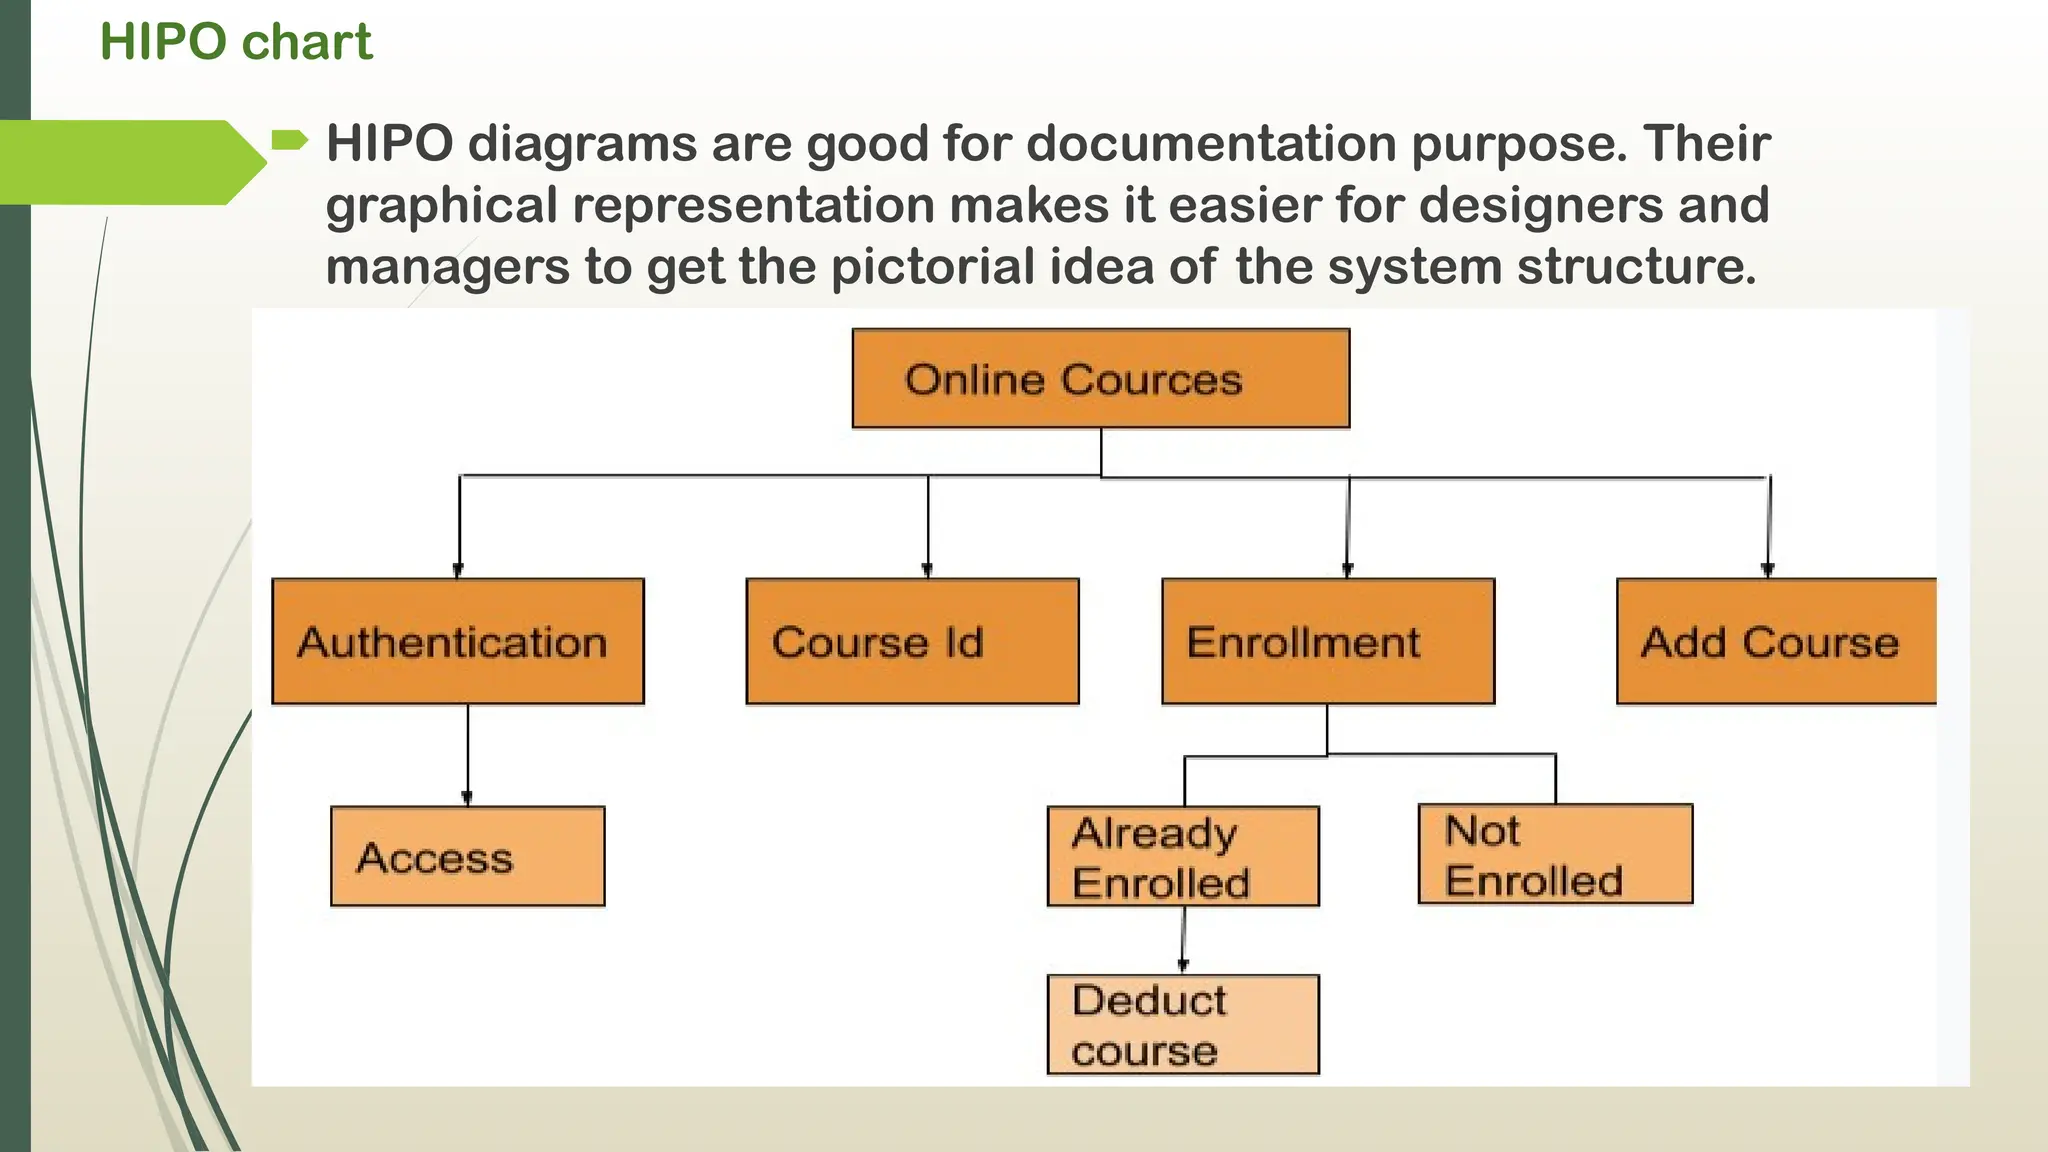
HIPO chart
HIPOdiagrams are good for documentation purpose. Their
graphical representation makes it easier for designers and
managers to get the pictorial idea of the system structure.
34.
HIPO CHART
Advantages ofHIPO :
Offer more detail than other types of documentation.
Each module's input and output are properly labeled.
Can be used to quickly determine what modules call the module
under investigation.
Disadvantages of HIPO :
The biggest downside of HIPO is that the documentation for a
program can become quite large: each module has its page,
regardless of its actual size.
Structure charts and pseudocode are more extensively utilised
than HIPO charts.
HIPO does not provide any data flow or control flow information.
35.
Gantt Chart
A Ganttchart is a visual illustration of a project’s
progress across a specified timeline. It helps you keep
track of the project’s tasks as well as their
dependencies.
It is one of the most popular and useful ways of showing activities
(tasks or events) displayed against time.
On the left of the chart is a list of the activities and along the top is
a suitable time scale.
Each activity is represented by a bar.
the position and length of the bar reflects the start date, duration
and end date of the activity.
36.
Gantt chart Allowsto see :
What the various activities are.
When each activity begins and ends.
How long each activity is scheduled to last.
Where activities overlap with other activities, and by how
much.
The start and end date of the whole project.
37.
Gantt charts usedfor :
Monitor project progress
Adjust project schedule
Optimize the complete process structure
Estimate delays
Keep all project participants on track
Monitoring progress to ensure completion on schedule
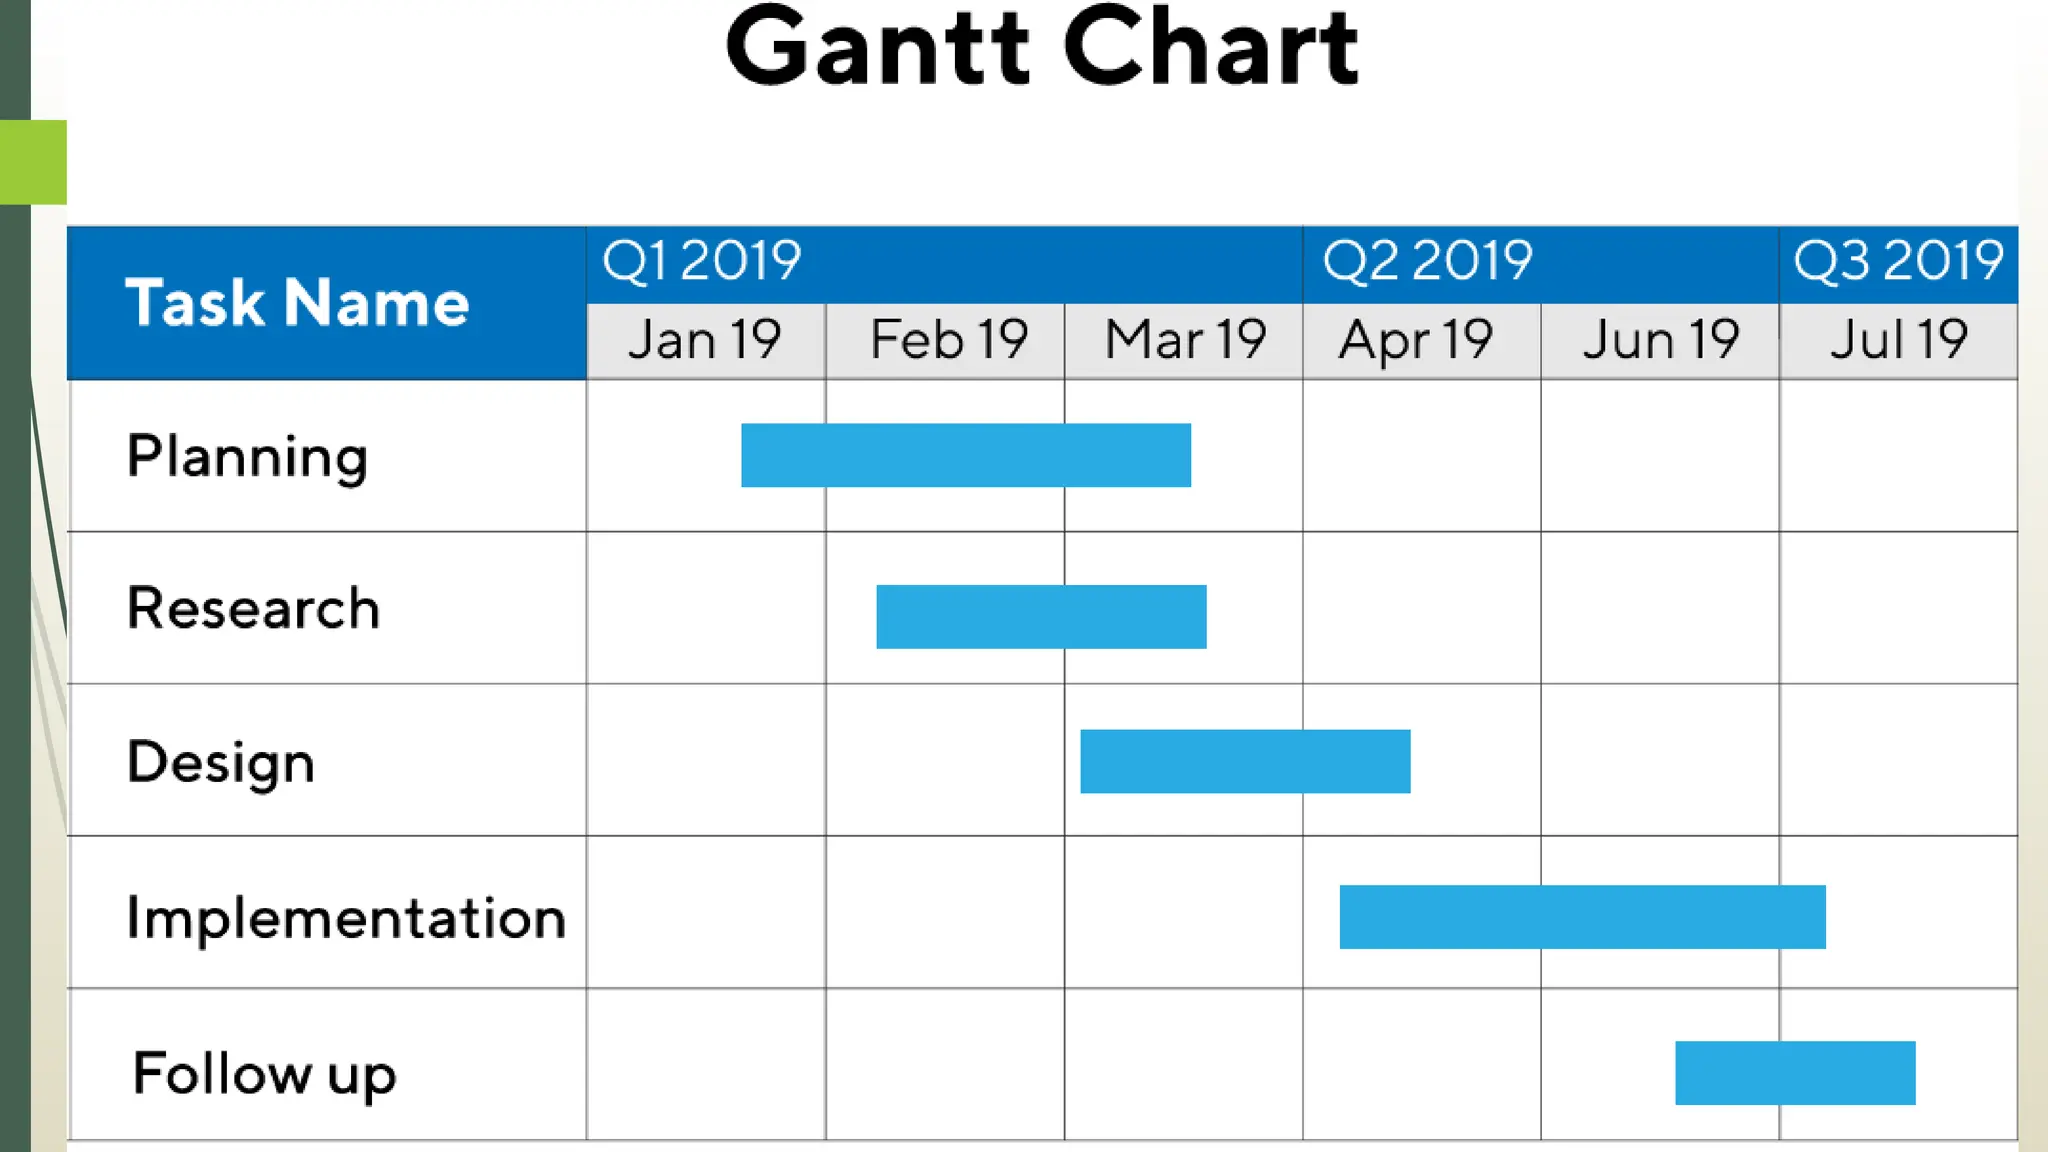
Gantt chart
thechart is displayed as a horizontal bar chart.
Horizontal bars of different lengths represent the project
timeline, which can include task sequences, duration,
and the start and end dates for each task. The horizontal
bar also shows how much of a task requires completion.
A Gantt chart helps in scheduling, managing, and
monitoring specific tasks and resources in a project.
The chart shows the project timeline, which includes
scheduled and completed work over a period. .
40.
Advantages / Benefitsof Gantt chart
It Provides a High-Level Overview: A Gantt chart provides an overall
perspective of a project and its timeline
It Improves Efficiency and Helps Manage Resources: A Gantt chart can
help ensure that leaders and workers manage their time and resources
effectively.
It Allows for Better Tracking: A Gantt chart enables project leaders and
members to closely track tasks, benchmarks, and overall workflow.
It Illustrates Overlaps and Dependencies: A Gantt chart clearly
communicates how tasks in a project might overlap. It also shows how the
beginning of one task can be dependent on the completion of another task.
It Boosts Productivity: A Gantt chart allows for collaboration among
workers to boost their productivity
It Motivates Team Members: A Gantt chart enables team members to
visualize their tasks, thereby motivating them to do their work on the
project.
41.
Disadvantages / challengesof Gantt Charts
Setup Can Be Time Consuming: Setting up a Gantt chart for a complex
project can be convoluted and time consuming. Software can help.
They Can Become Complex and Confusing: A Gantt chart for a large project
with many tasks and subtasks can become complicated.
They Don’t Designate Priorities: Gantt charts focus on presenting the tasks
in a project, the order of those tasks, and the approximate time it takes to
complete them. The charts don’t show the priority of the particular tasks.
They Don’t Offer Much Detail Regarding Task Dependencies.
Task Bars Do Not Show the Amount of Work That Each Task Requires: The
length of a Gantt chart task bar shows the amount of time it might take to
finish a task. But that length doesn’t indicate the specific resources that
such a task requires.
42.
Pseudo Codes
Itis defined as a method of describing a process or writing
programming code and algorithms using a natural language
such as English.
It is not the code itself, but rather a description of what the
code should do.
In other words, it is used as a detailed understandable step-by-
step plan or blueprint from which a program can be written.
It is an algorithm or rough code before it is implemented in a
programming language.
It can also be referred to as 'false code' or 'representation of
code'.
43.
Purpose of PseudoCodes
To provide a clear and concise description of the steps that
will be taken in a process or algorithm without the need for
specific syntax or code.
Pseudocode is not compiled or executed on computers, it is
only meant to be read and understood by humans.
Pseudocode is often used as a tool to create, design, or plan
algorithms and prototypes.
44.
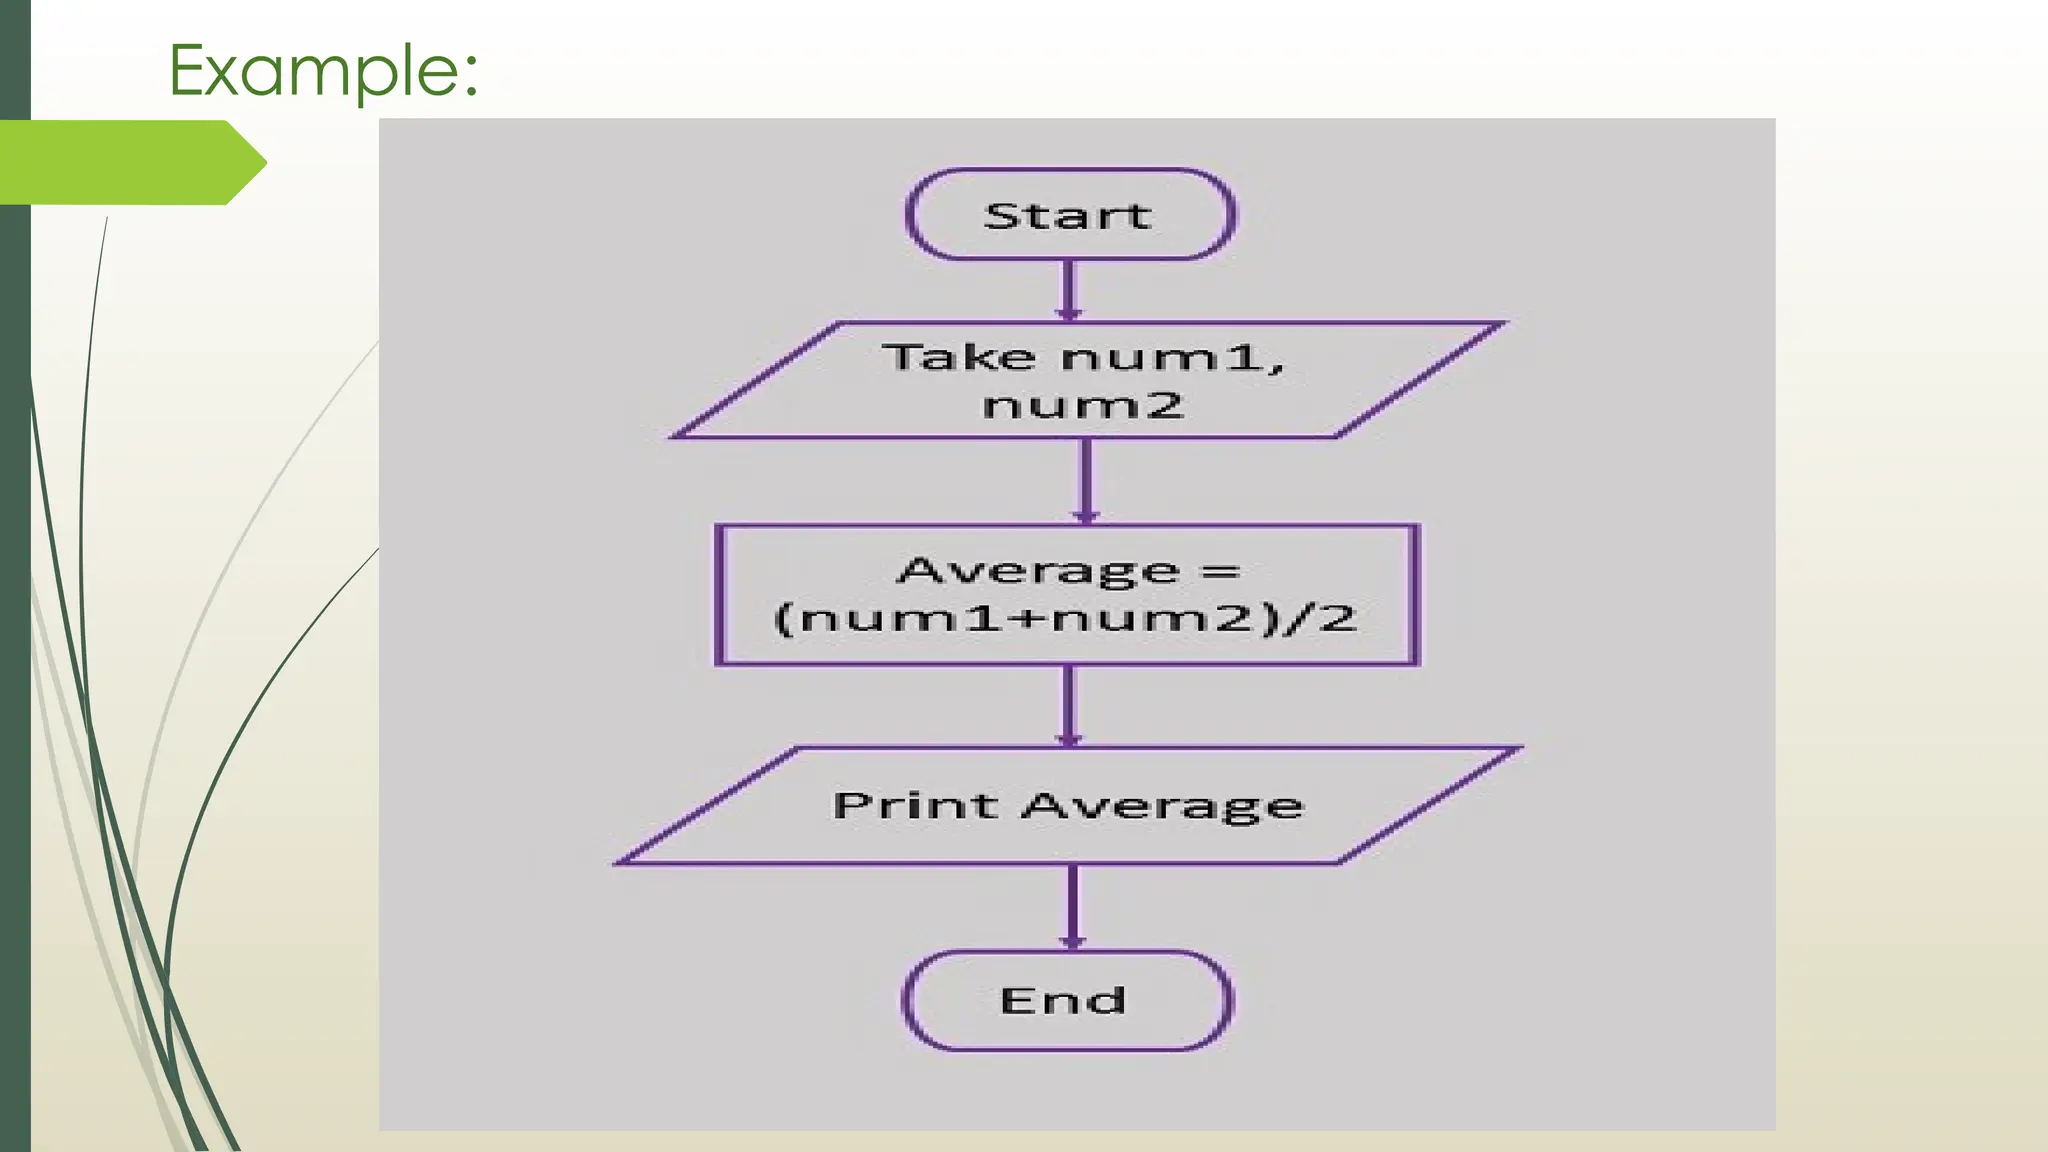
Pseudocode Examples :
Example 1: Calculate the Average of Five
Numbers
• START
• INPUT five numbers and store them in variables
num1, num2, num3, num4, and num5
• CALCULATE the sum of the five inputted
numbers and store them in variable sum
• CALCULATE the average of the five inputted
numbers and store them in variable avg .
• PRINT the value of the variable avg .
• END
45.
Pseudocode Examples :
Example 2 : Compute Area of a
Triangle
• START
• Enter the base length, B
• Enter height, H
• Calculate the area = 1/2 * B * H
• Display area
• END
46.
Advantages of Pseudocode
1.Pseudocode is a simple way to represent an algorithm or
program.
2. It is written easily in a word processing application and easily
modified.
3. Pseudocode is easy to understand and can be written by
anyone.
4. Pseudocode can be used with various structured programming
languages.
47.
Disadvantages of Pseudocode
1)Pseudocode is not a programming language, so it
cannot be executed by a computer.
2) Pseudocode can be ambiguous and sometimes open
to interpretation.
3) Pseudocode can be difficult to read if not written in a
clear and consistent manner.
48.
How to Writea Pseudocode? : simple steps to performed
1) Use a plain-text editor - pseudocode needs as little formatting as possible to keep it
simple.
2) Start by writing down the purpose of the process
3) Write only one statement per line - Each statement in your pseudocode should
express just one action for the compute.
4) Use white space and indentation effectively - Using white spaces between "blocks"
of text will help keep different components of your pseudocode isolated
5) Capitalize key commands if necessary - e.g., "IF input number THEN output
result".
6) Keep your pseudocode in the proper order.
7) Leave nothing to the imagination. Everything that is happening in the process must
be described completely.
8) Use standard programming structures.
9) Double-check your pseudocode for readability and clarity.
10)Write using simple terminology.
49.
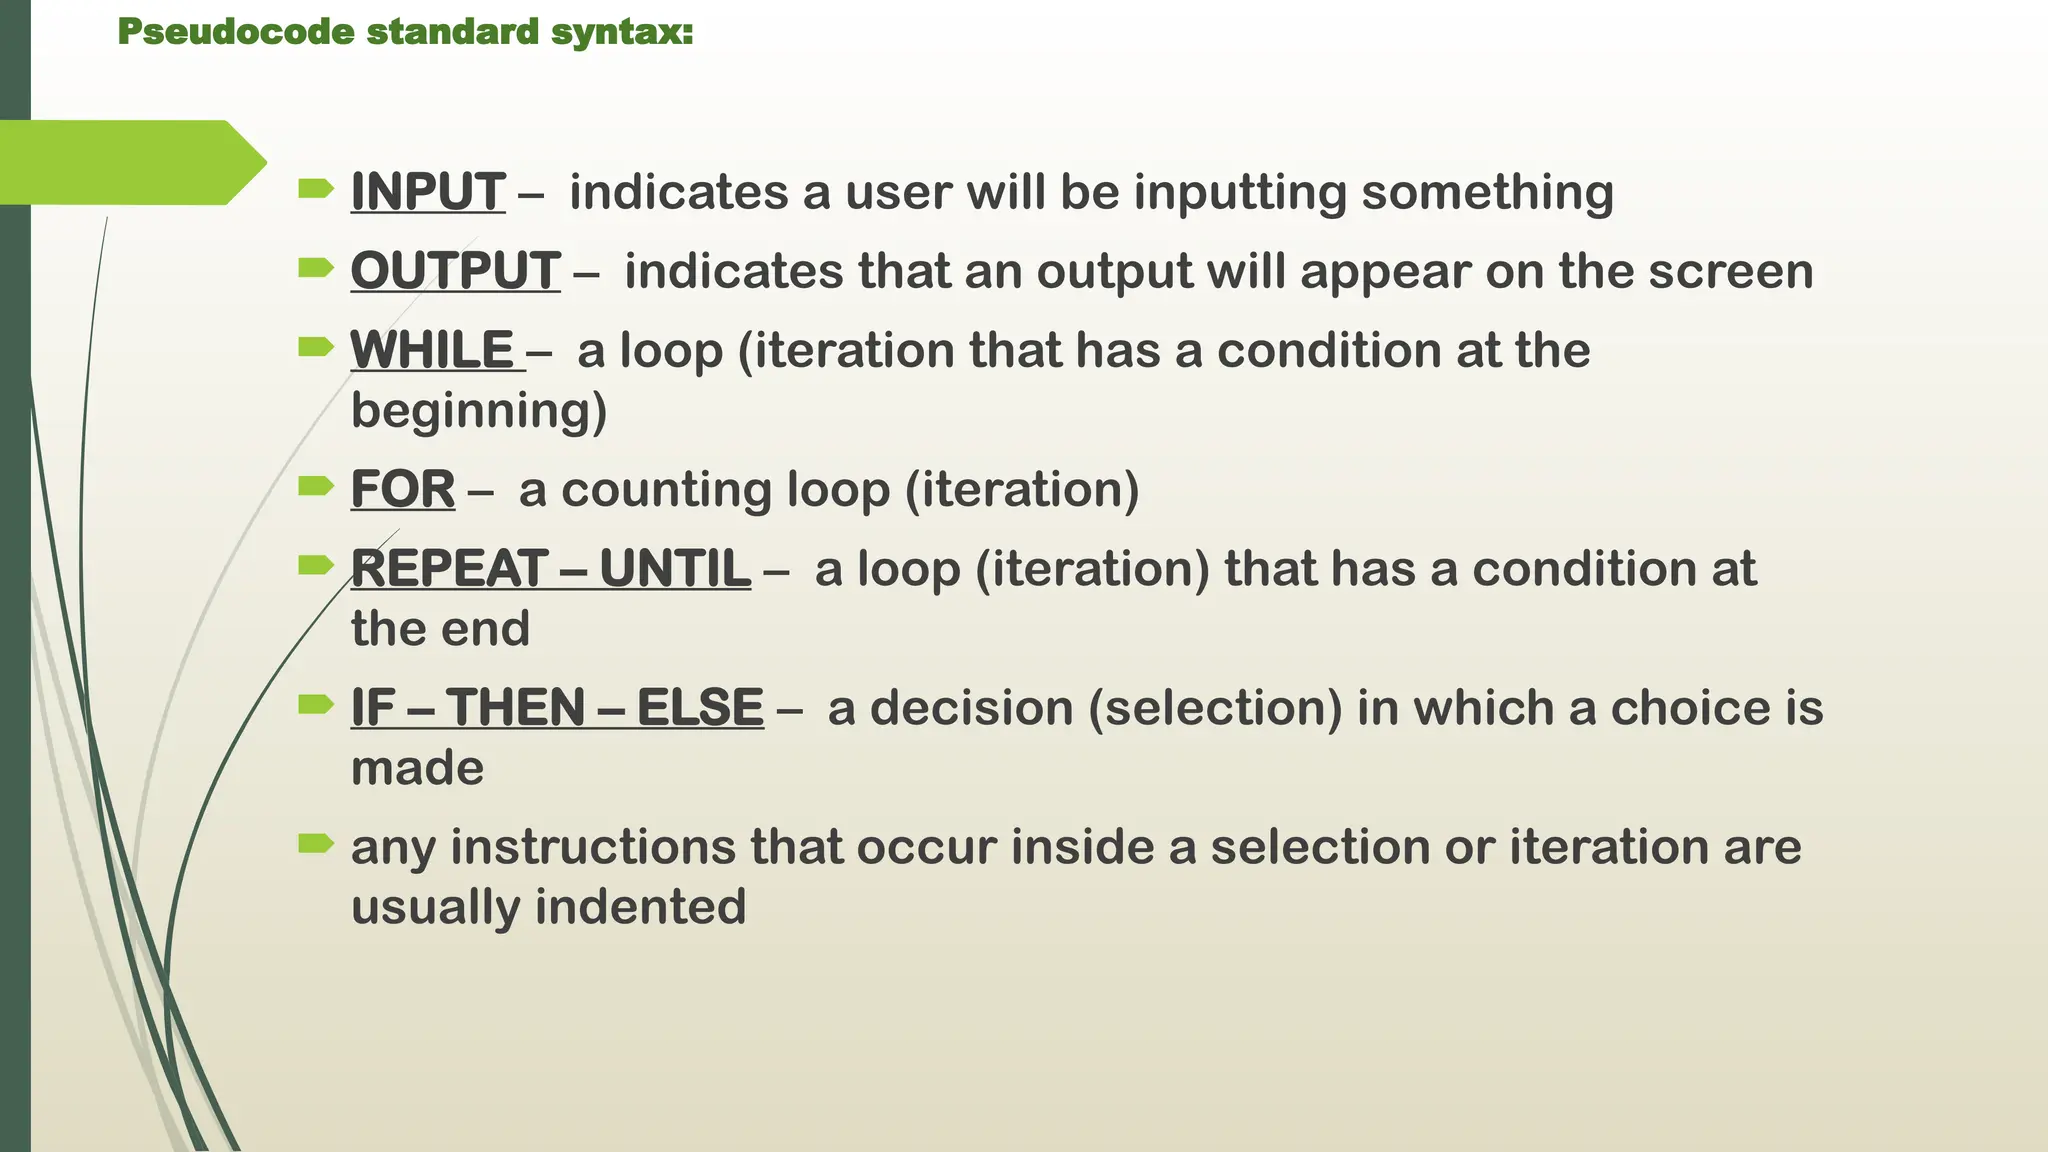
Pseudocode standard syntax:
INPUT – indicates a user will be inputting something
OUTPUT – indicates that an output will appear on the screen
WHILE – a loop (iteration that has a condition at the
beginning)
FOR – a counting loop (iteration)
REPEAT – UNTIL – a loop (iteration) that has a condition at
the end
IF – THEN – ELSE – a decision (selection) in which a choice is
made
any instructions that occur inside a selection or iteration are
usually indented
Flowchart
It is apictorial representation of Algorithm for planning
the procedure to solve a program/problem.
A flowchart is a picture of the separate steps of a
process in sequential order.
It is a generic tool that can be adapted for a wide
variety of purposes,
It can be used to describe various processes, such as a
manufacturing process, an administrative or service
process, or a project plan.
52.
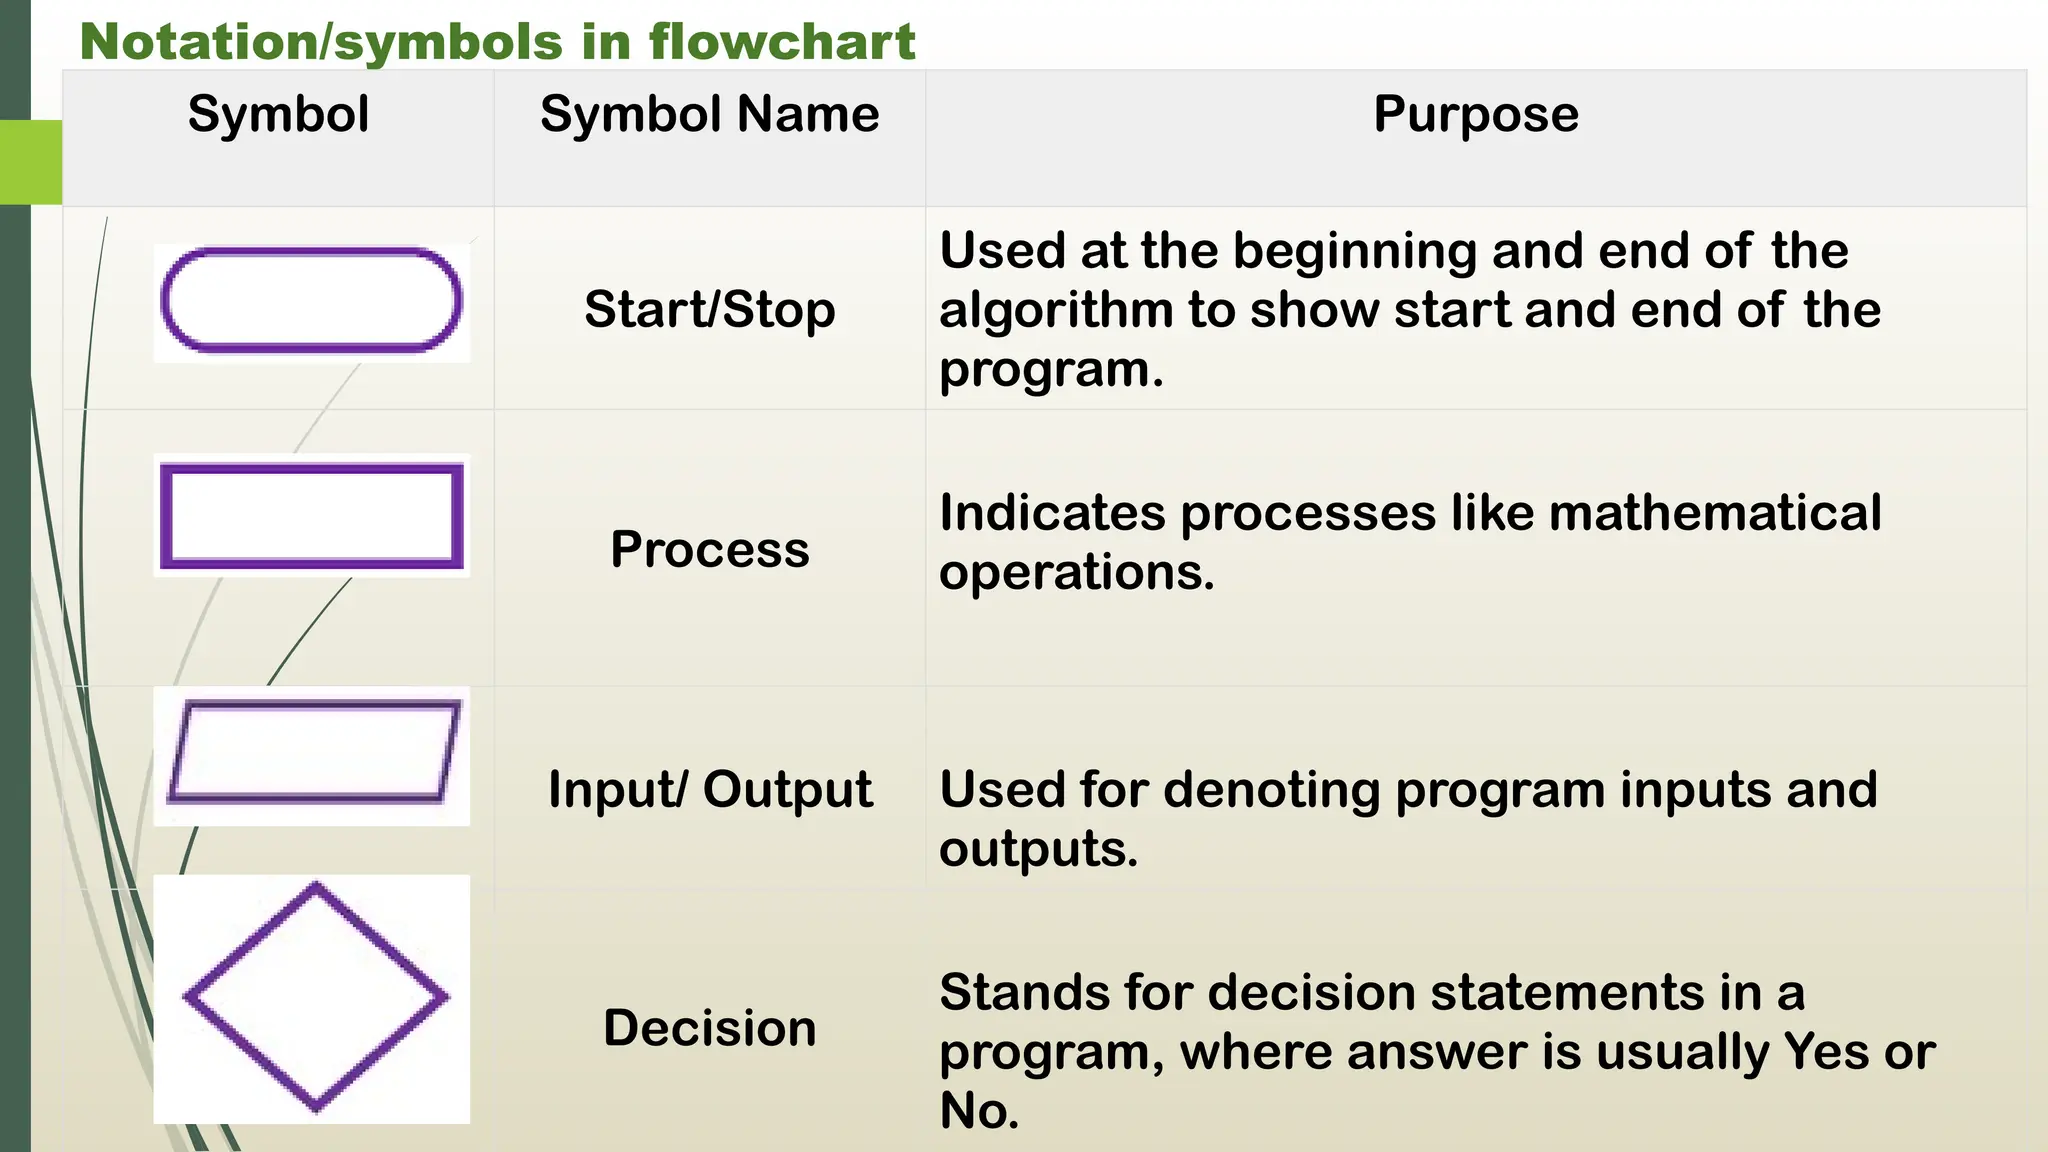
Notation/symbols in flowchart
SymbolSymbol Name Purpose
Start/Stop
Used at the beginning and end of the
algorithm to show start and end of the
program.
Process
Indicates processes like mathematical
operations.
Input/ Output Used for denoting program inputs and
outputs.
Decision
Stands for decision statements in a
program, where answer is usually Yes or
No.
53.
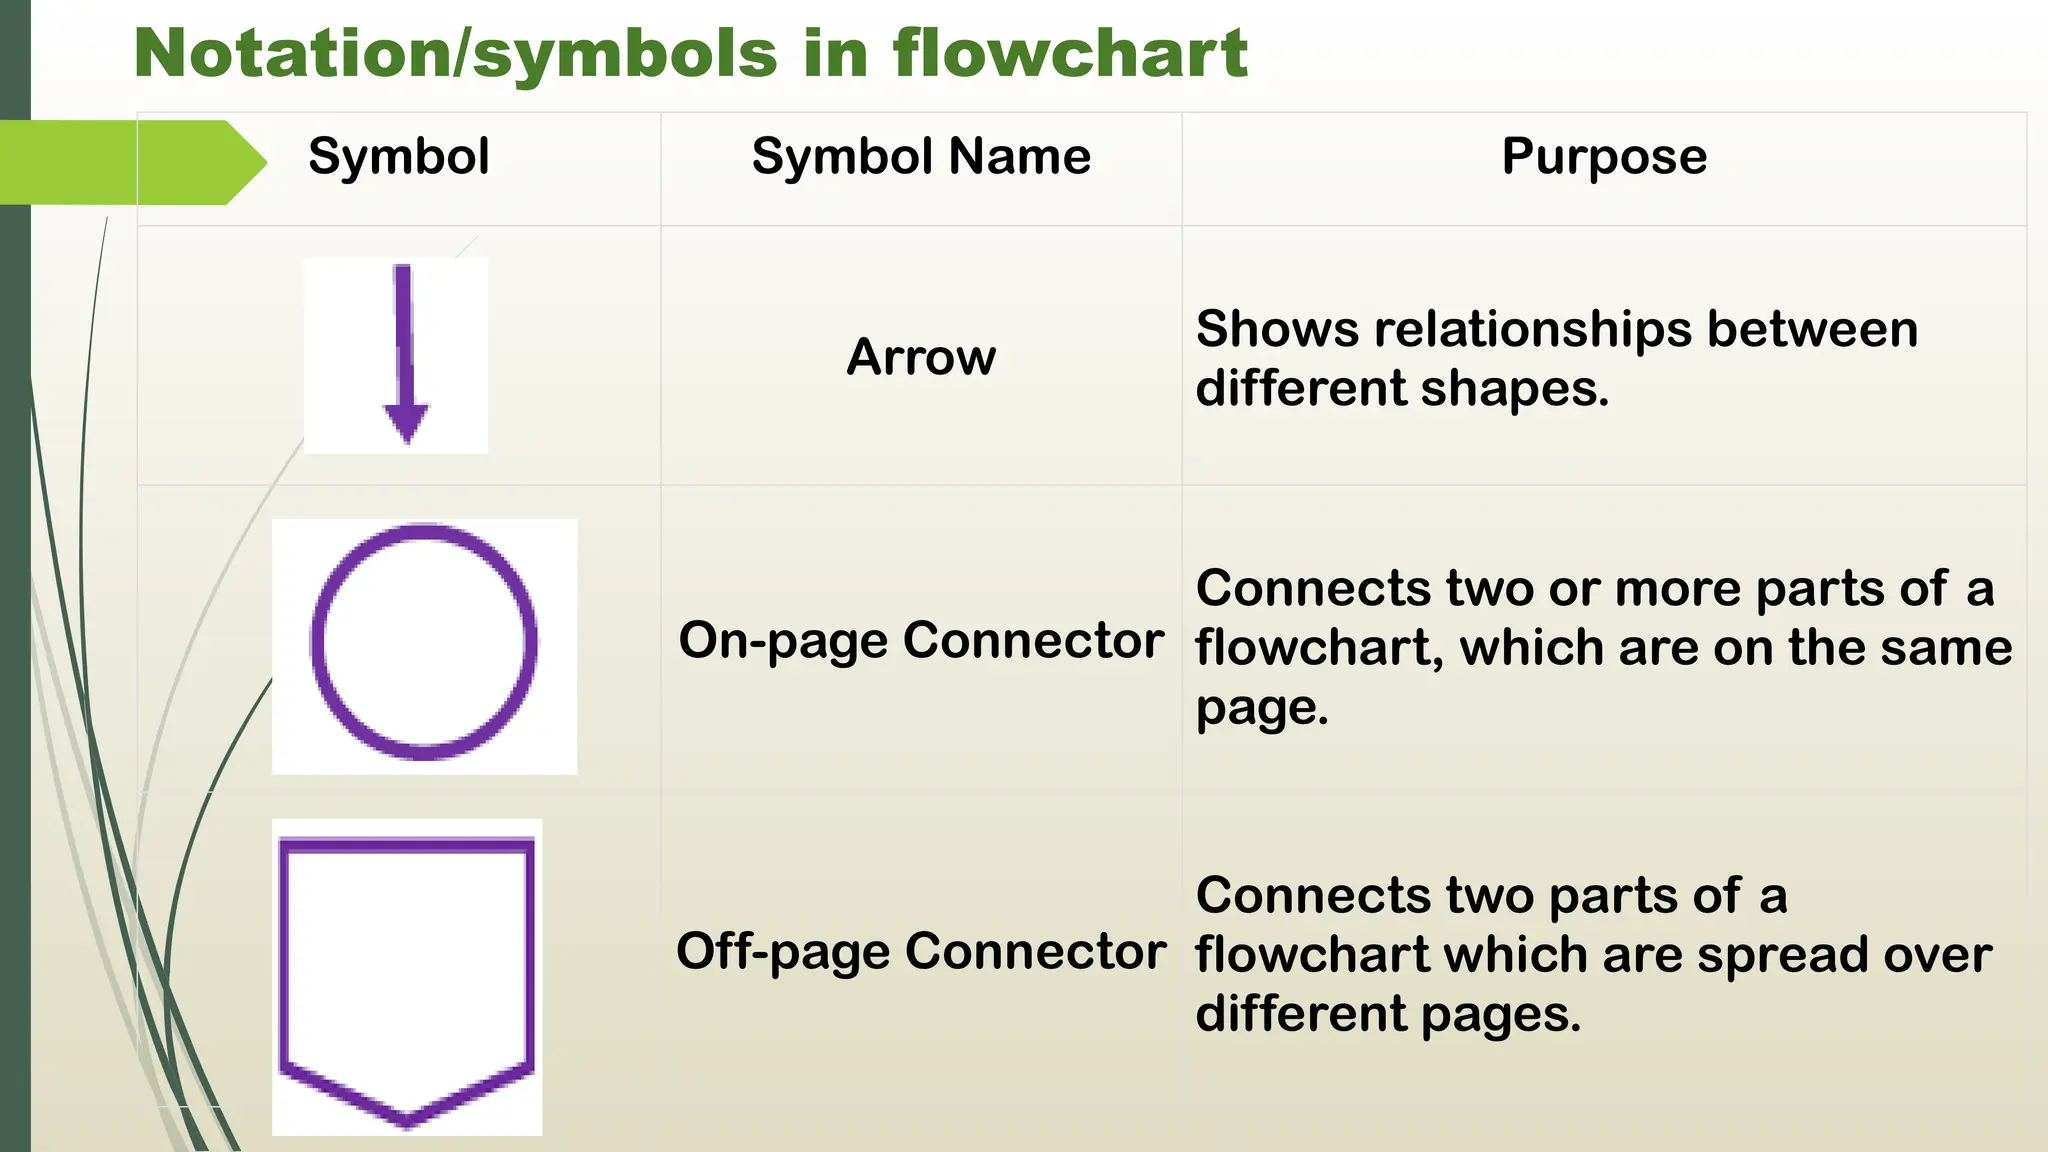
Notation/symbols in flowchart
SymbolSymbol Name Purpose
Arrow
Shows relationships between
different shapes.
On-page Connector
Connects two or more parts of a
flowchart, which are on the same
page.
Off-page Connector
Connects two parts of a
flowchart which are spread over
different pages.
54.
Guidelines for DevelopingFlowcharts
These are some points to keep in mind while developing a
flowchart −
1. Flowchart can have only one start and one stop symbol
2. On-page connectors are referenced using numbers
3. Off-page connectors are referenced using alphabets
4. General flow of processes is top to bottom or left to
right
5. Arrows should not cross each other
55.
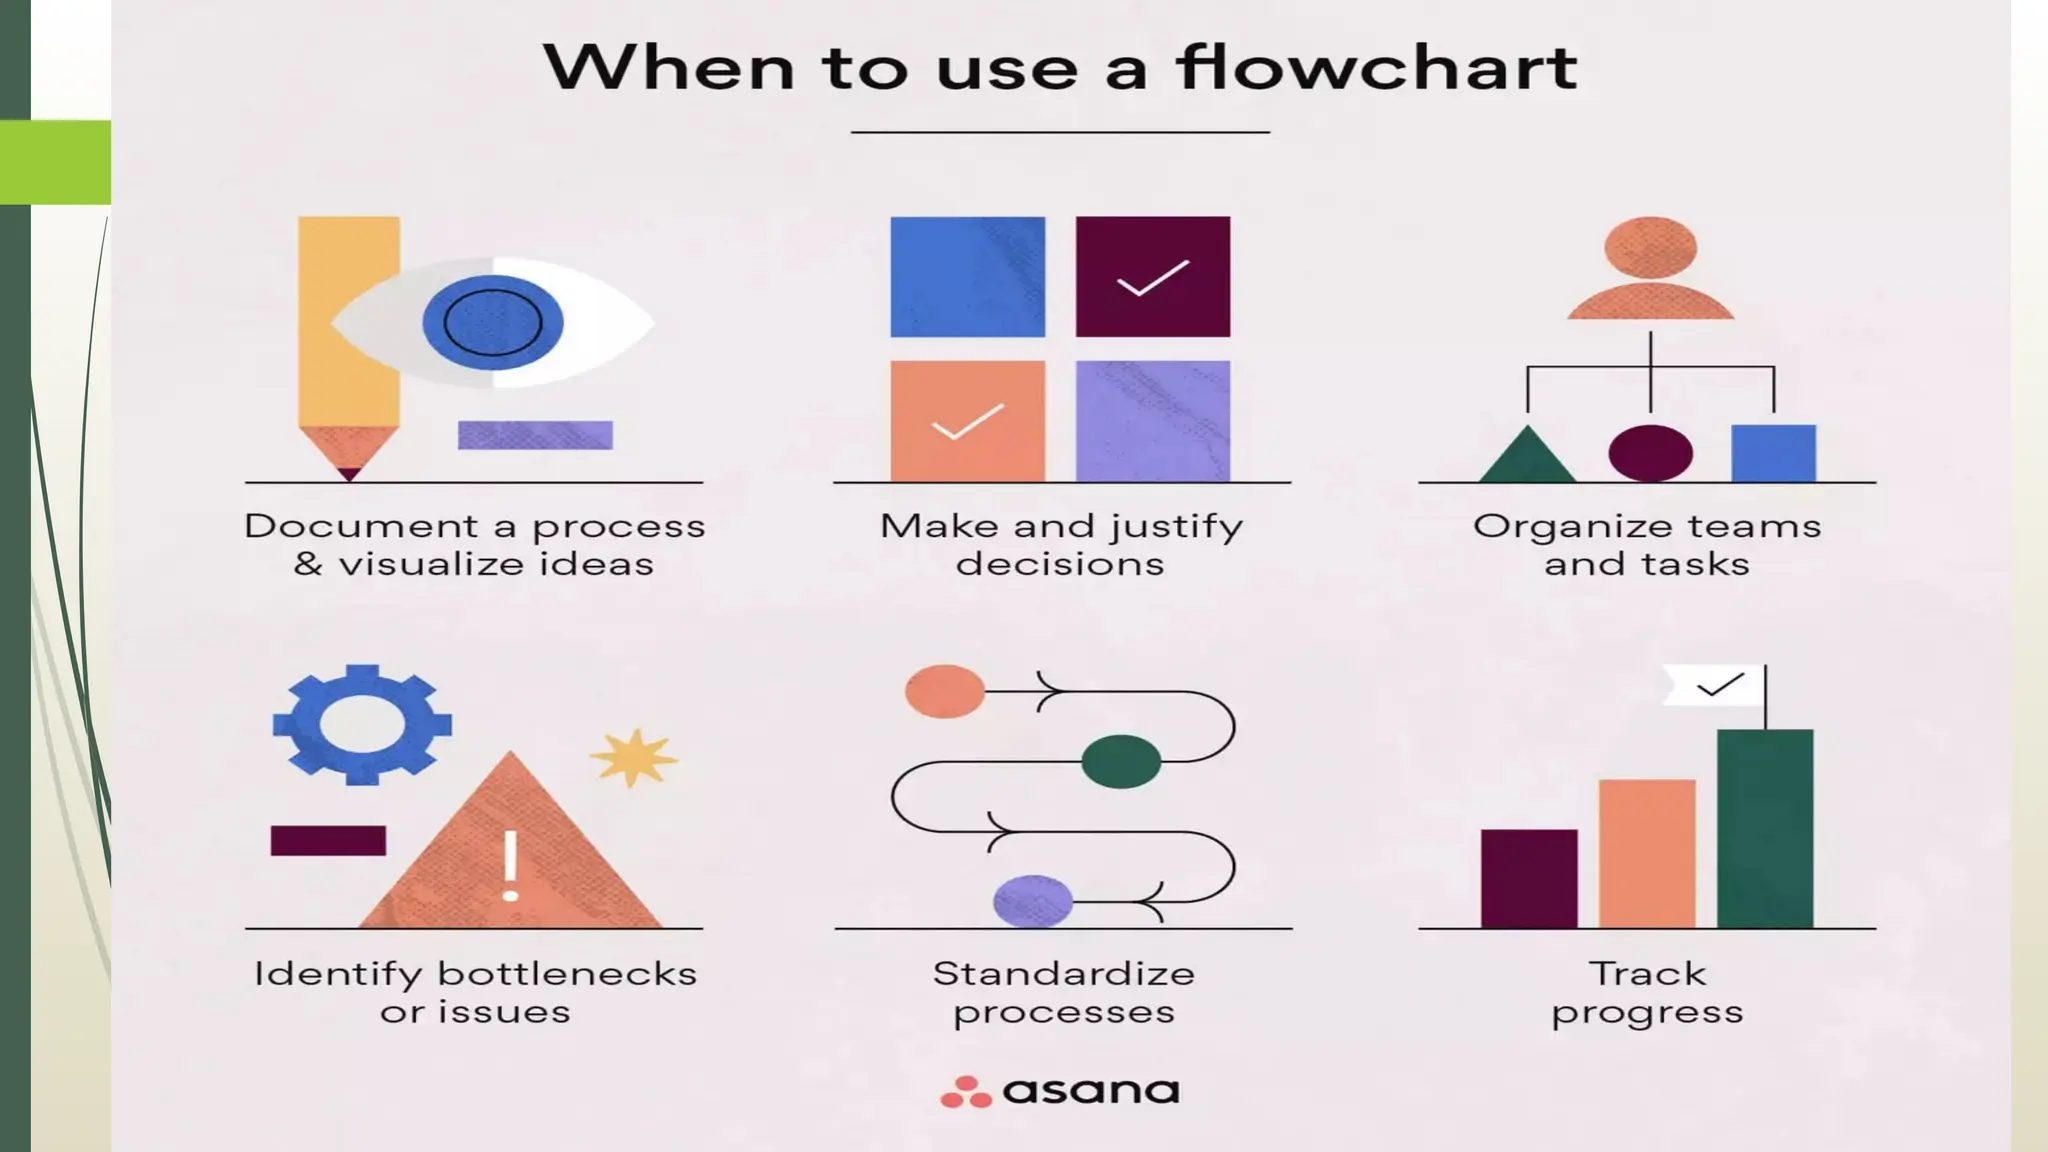
Types of Flowchart
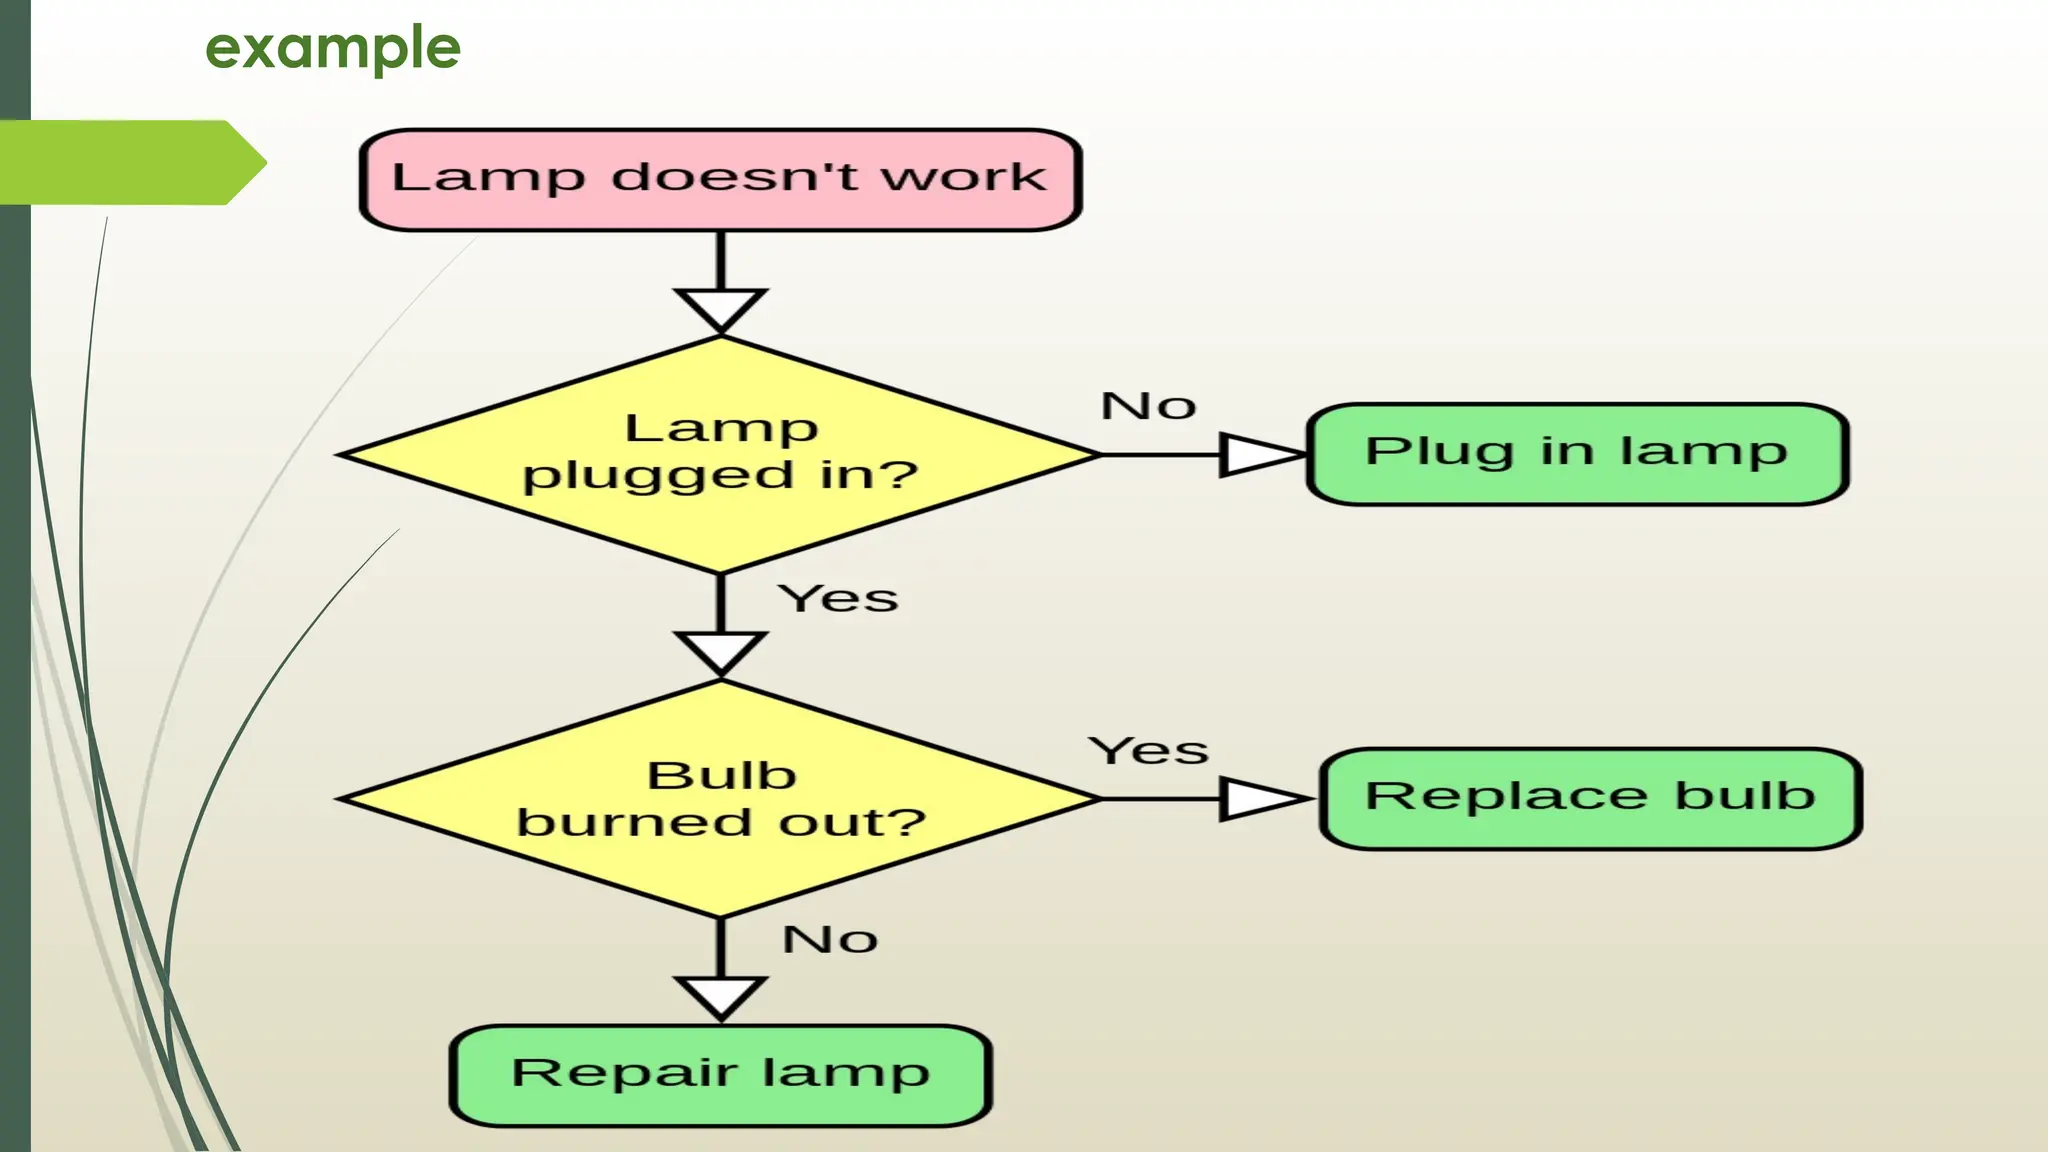
A decision flowchart helps to explain steps that are taken to justify
a decision. This type of flowchart can be helpful in anticipating the
consequences of different decisions.
A logic flowchart is applied to uncover loopholes, bottlenecks,
or constraints in the process which could cause disruptions or
issues.
A system flowchart represents how data flows in a system. They’re
often used in the accounting world.
A product flowchart visualizes the product creation process and
order of sequences. This type of flowchart can be a helpful piece of
documentation when you’re launching a new product or improving
the production process.
A process flowchart displays how a process will achieve a certain
outcome. You will likely create a process flowchart to improve an
existing process or establish a new one. An example for a process
flowchart is a swimlane diagram.
56.
How to createFlowchart
1) Define the purpose and scope. Before you hit the drawing
board or open your flowchart maker, define your project
scope and process purpose. Ask yourself what your project
should accomplish and what appropriate beginning and end
dates are.
2) Put your tasks in chronological order. Depending on the kind
of flowchart you’re creating, you may want to review existing
documentation, interview team members on their past
experiences, or observe an existing process. It can help to
write down some of the steps as a list before you create your
first flowchart draft.
3) Organize your tasks by type and flowchart symbol. Once you
have all of your tasks written out and organized
chronologically, assign them to their corresponding symbol
so you’re prepared to draw your flowchart.
57.
How to createFlowchart
4) Draw your flowchart. You can sketch it out by hand or use a
flowchart maker or flowchart software to create a flowchart that
you can easily share with your team.
5) Confirm and refine your flowchart. Getting a second, third, or
even fourth set of eyes on your flowchart will help you uncover
bottlenecks or potential problems and allow you to refine the
flowchart before the process starts.
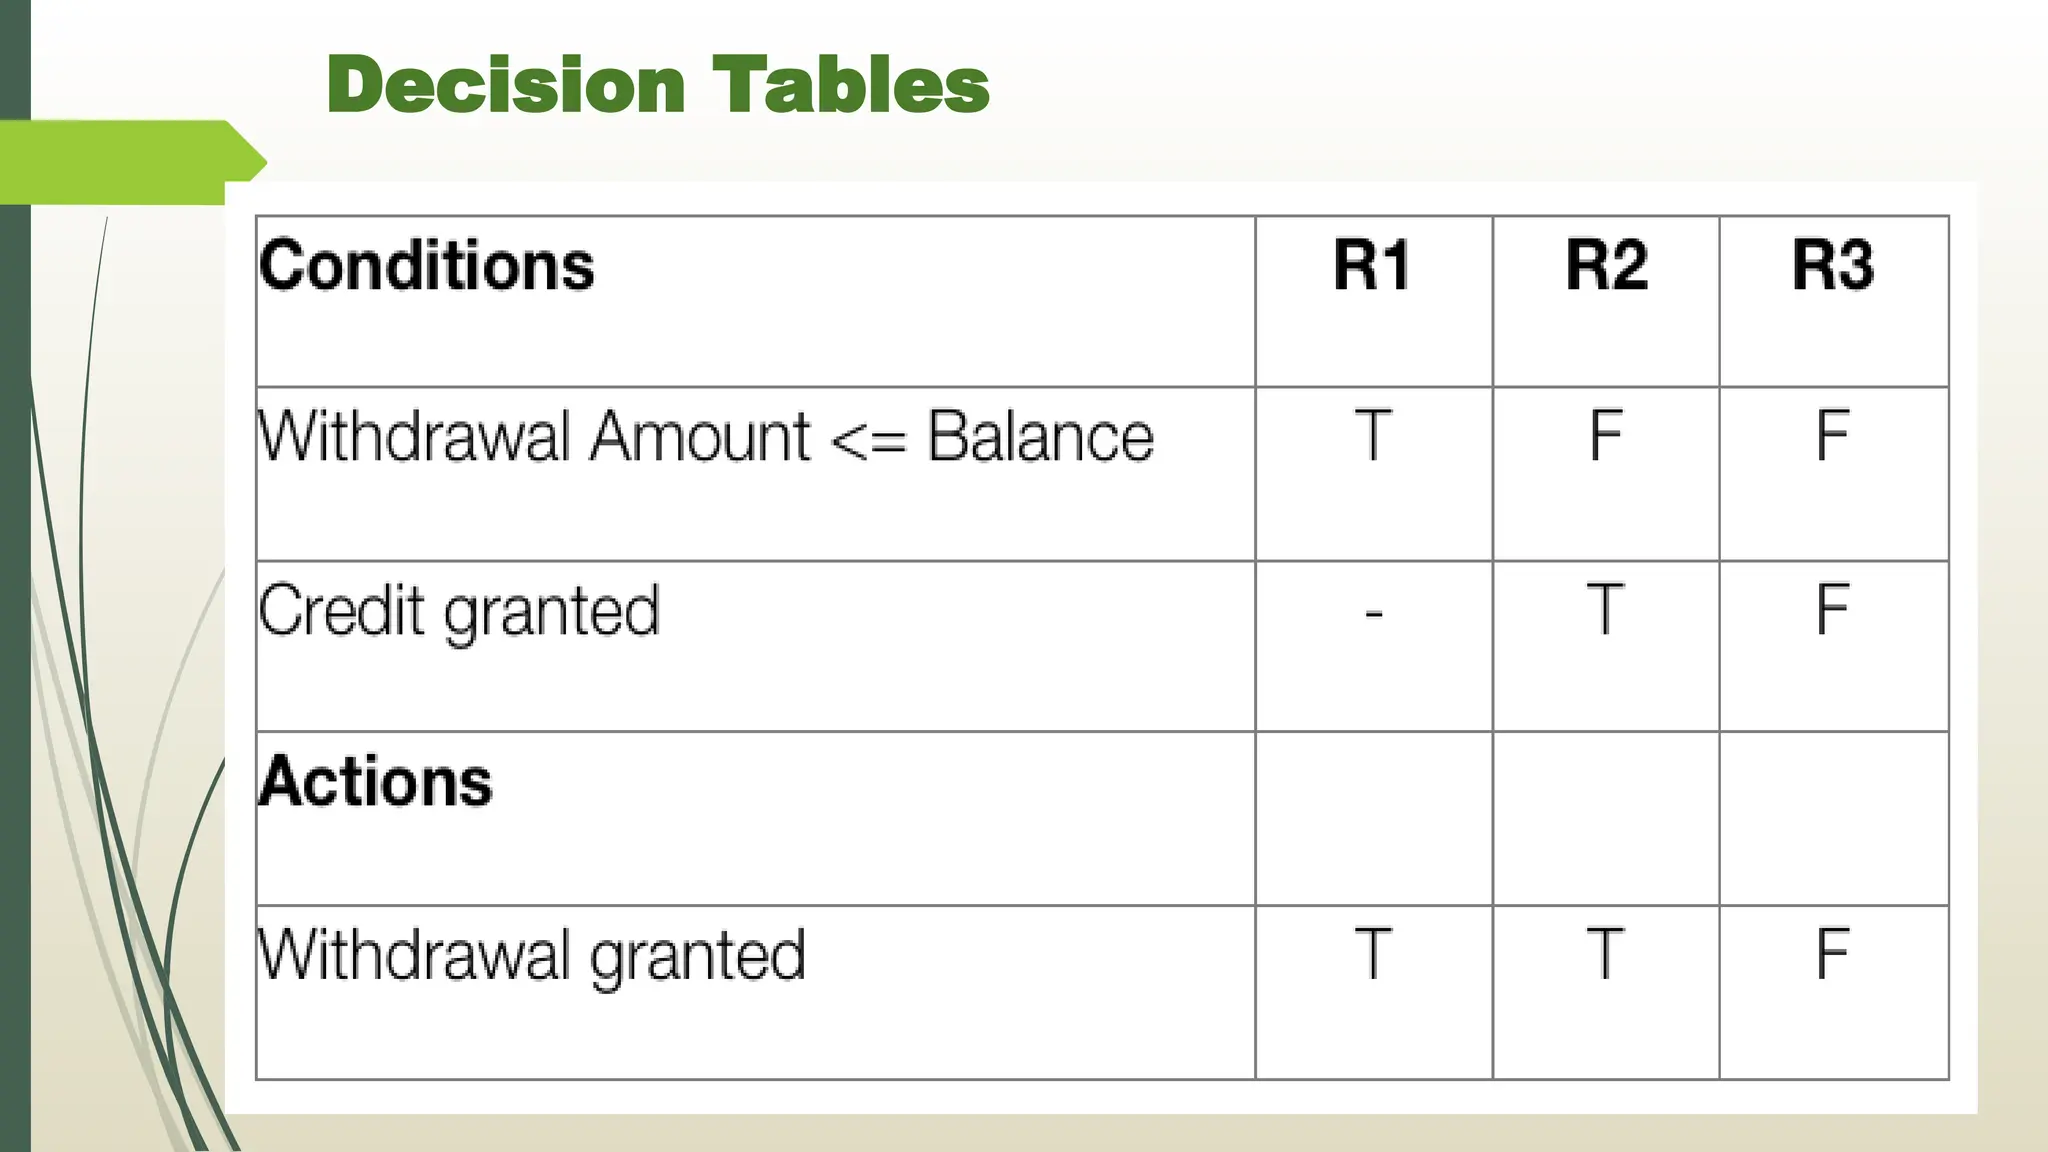
Decision Table :
A decision table is a brief visual representation for specifying which
actions to perform depending on given conditions.
The information represented in decision tables can also be
represented as decision trees or in a programming language using
if-then-else and switch-case statements.
Decision tables are a method of describing the complex logical
relationship in a precise manner which is easily understandable.
It is useful in situations where the resulting actions depend on the
occurrence of one or several combinations of independent
conditions.
It is a matrix containing row or columns for defining a problem and
the actions.
62.
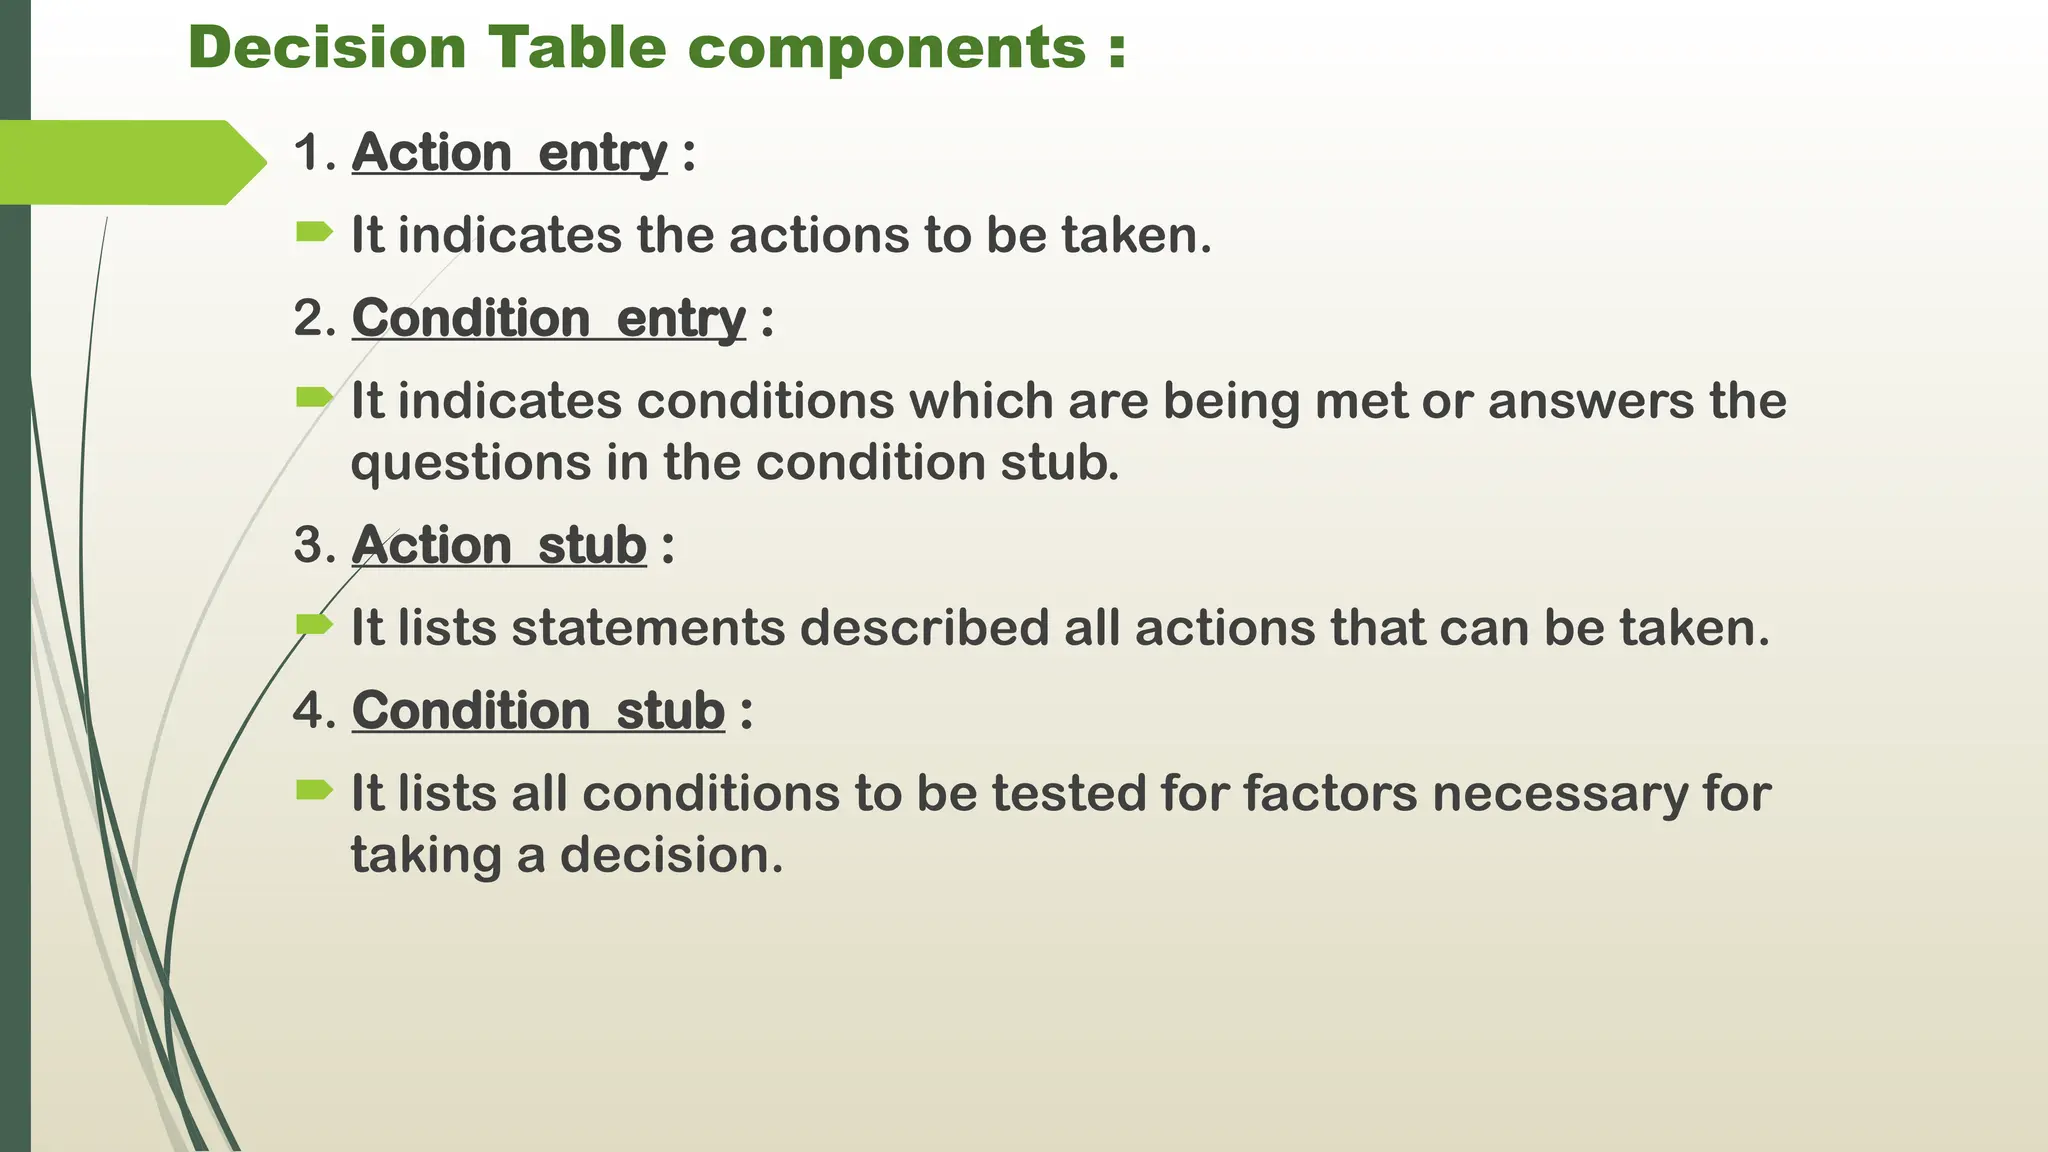
Decision Table components:
1. Action entry :
It indicates the actions to be taken.
2. Condition entry :
It indicates conditions which are being met or answers the
questions in the condition stub.
3. Action stub :
It lists statements described all actions that can be taken.
4. Condition stub :
It lists all conditions to be tested for factors necessary for
taking a decision.
63.
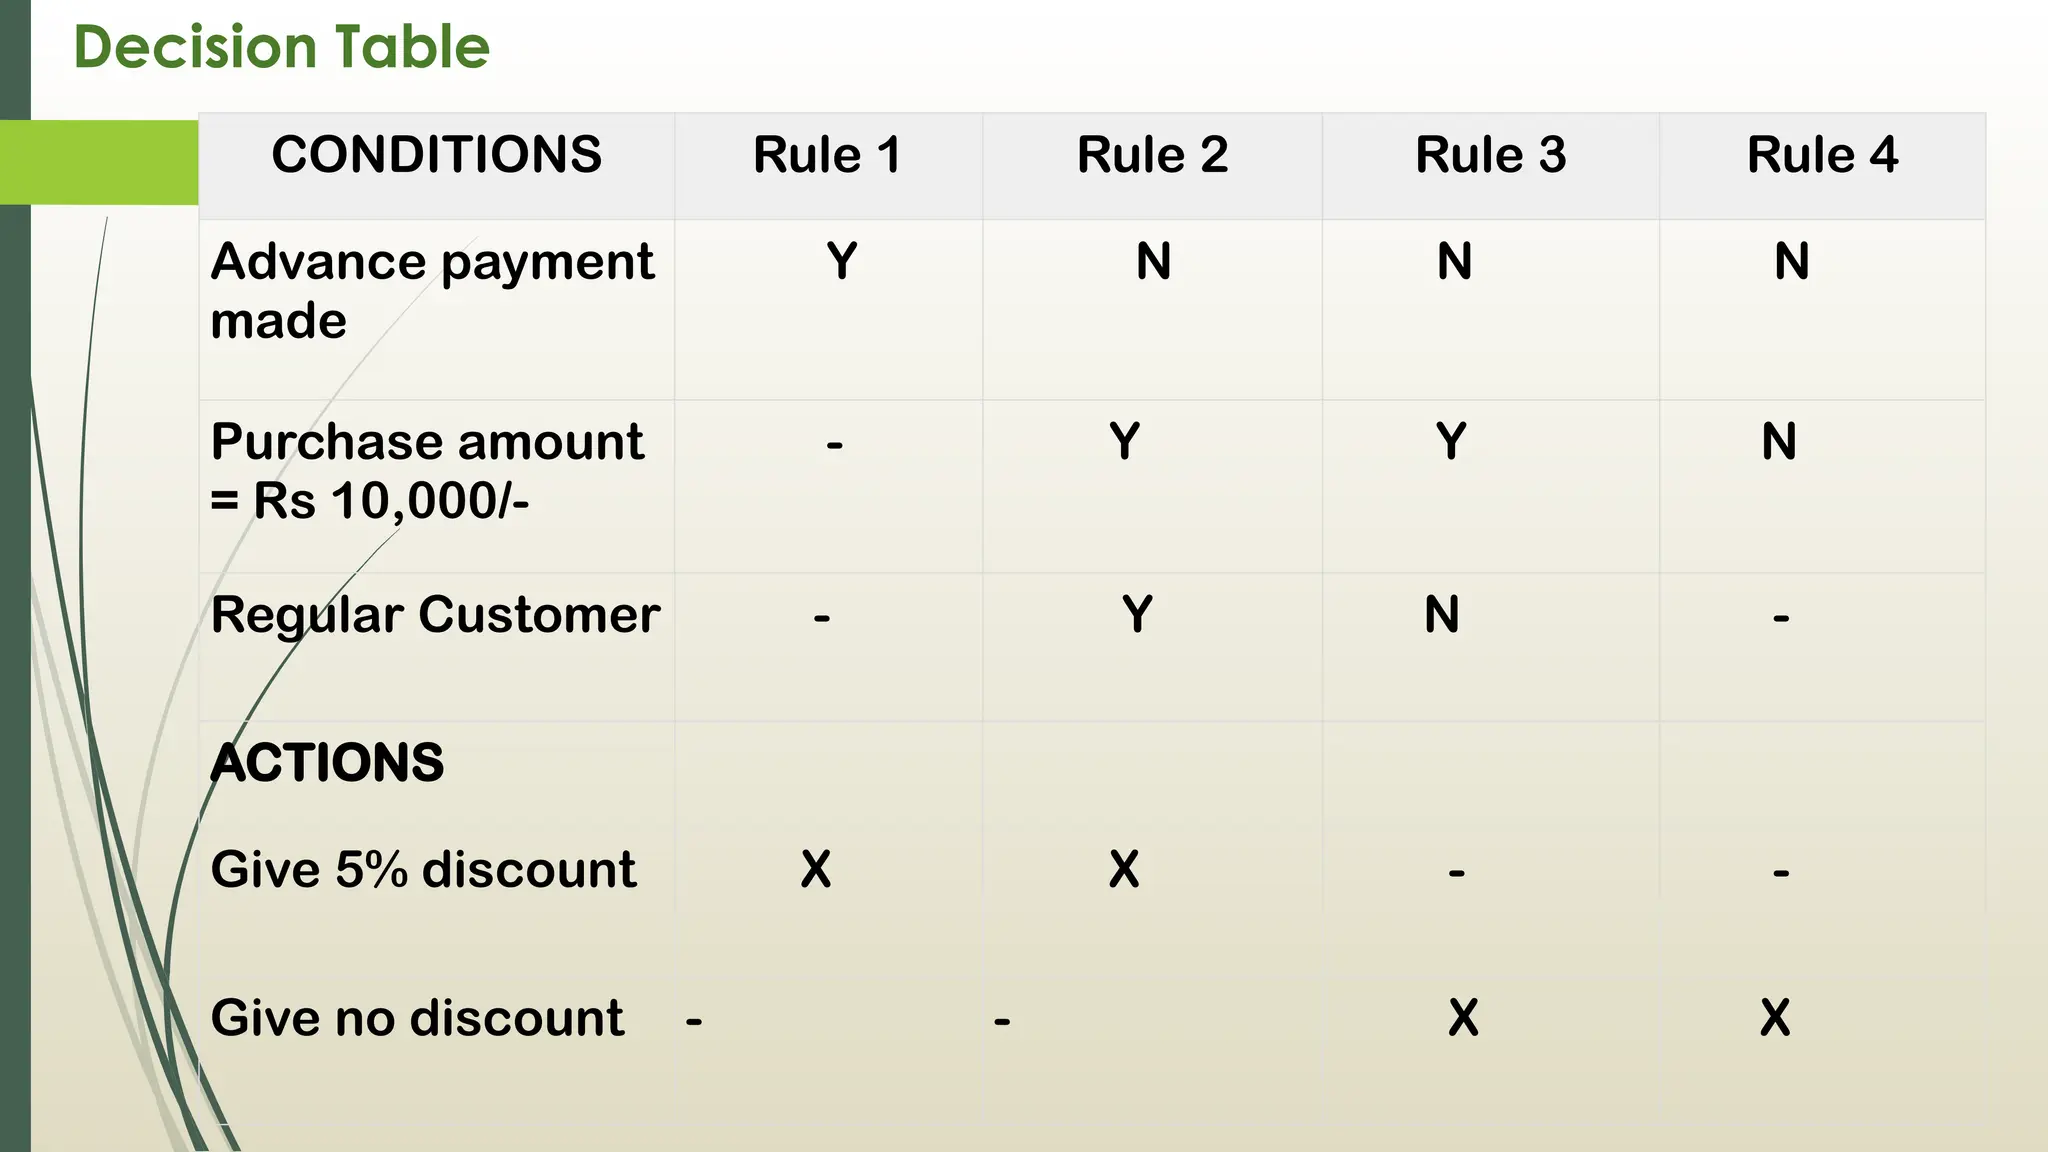
Decision Table
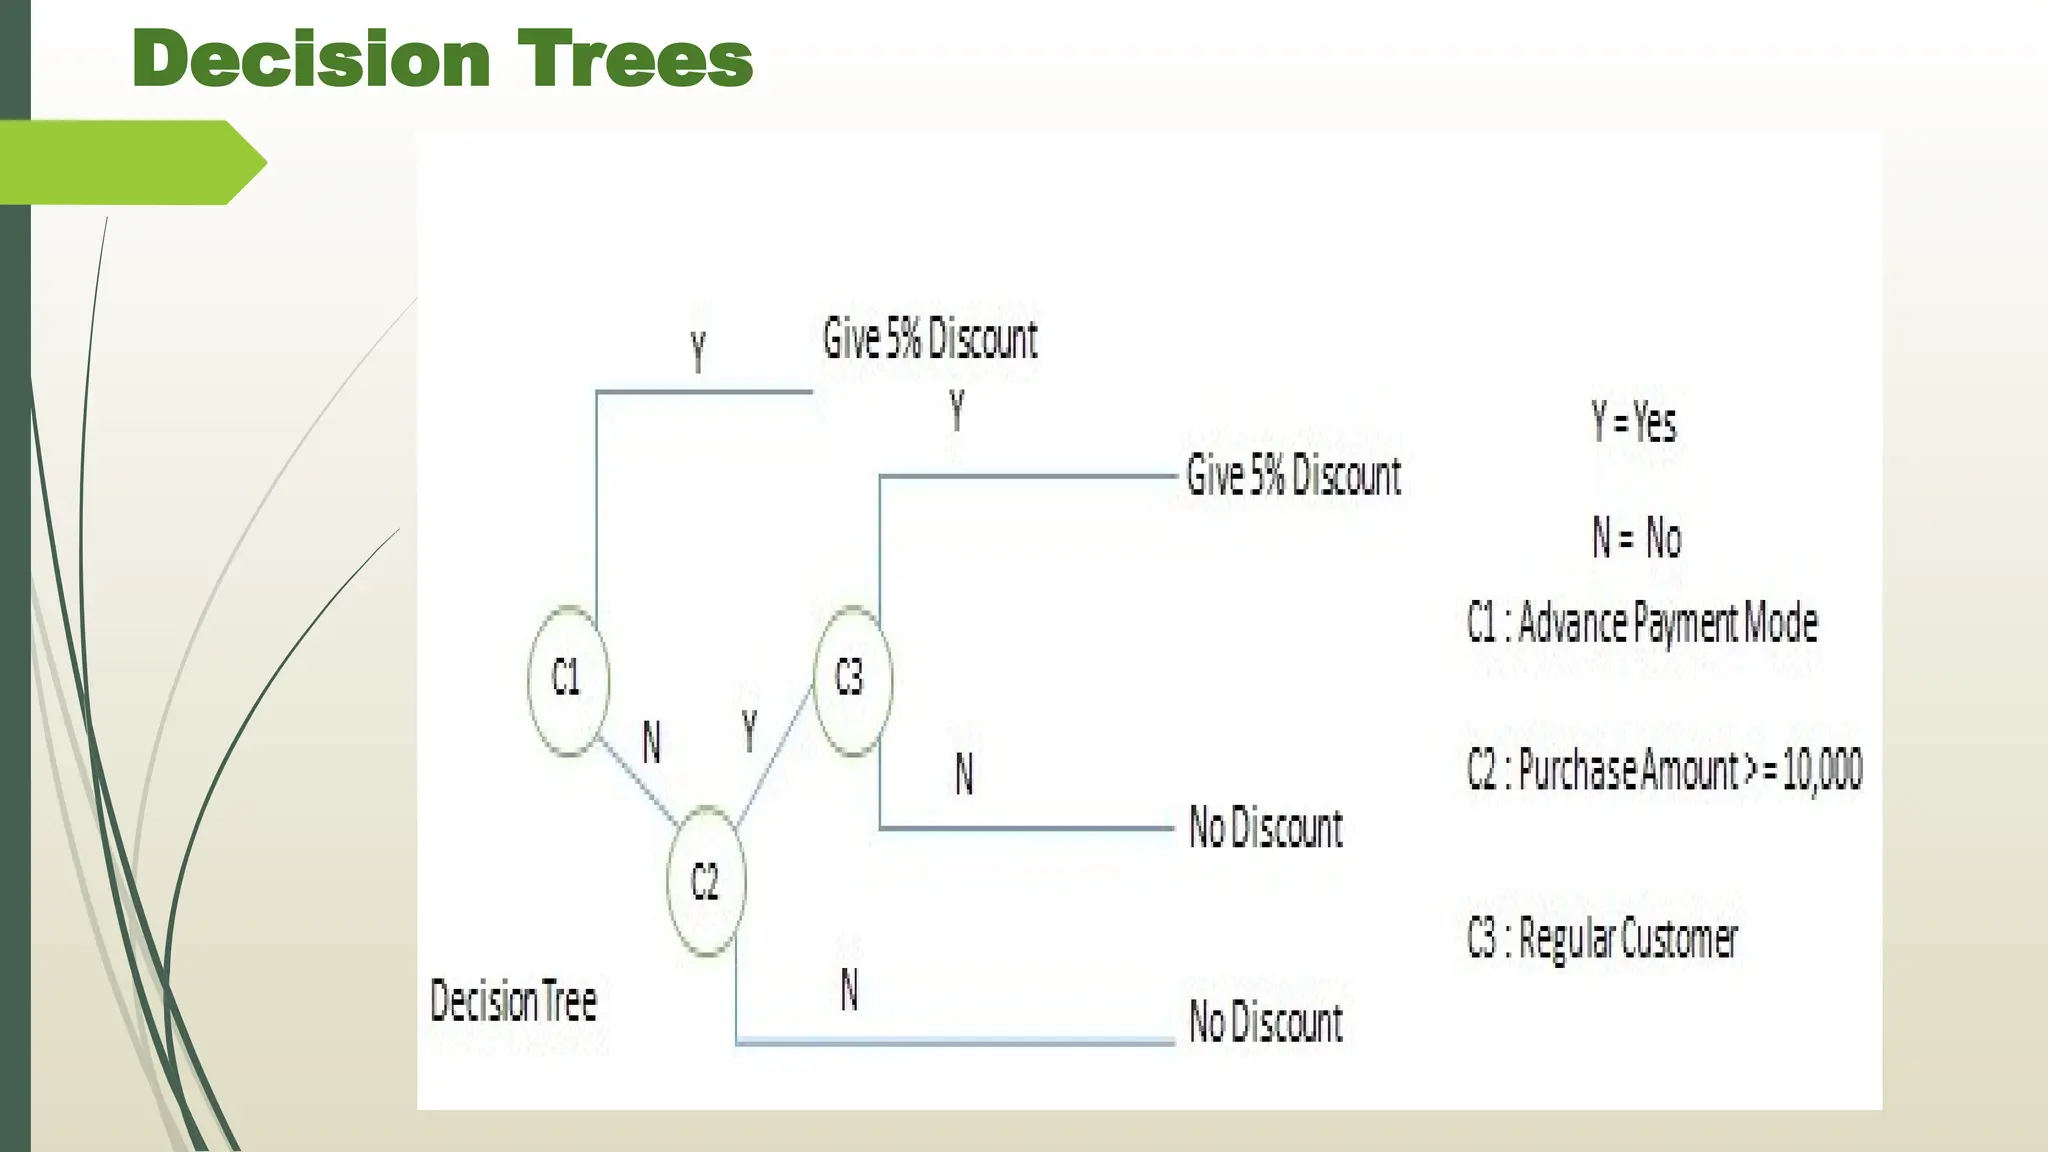
CONDITIONS Rule1 Rule 2 Rule 3 Rule 4
Advance payment
made
Y N N N
Purchase amount
= Rs 10,000/-
- Y Y N
Regular Customer - Y N -
ACTIONS
Give 5% discount X X - -
Give no discount - - X X
64.
Decision Table
Theentries in decision table are given by Decision Rules which
define the relationships between combinations of conditions
and courses of action. In rules section,
Y shows the existence of a condition.
N represents the condition, which is not satisfied.
A blank - against action states it is to be ignored.
X (or a check mark will do) against action states it is to be
carried out.
65.
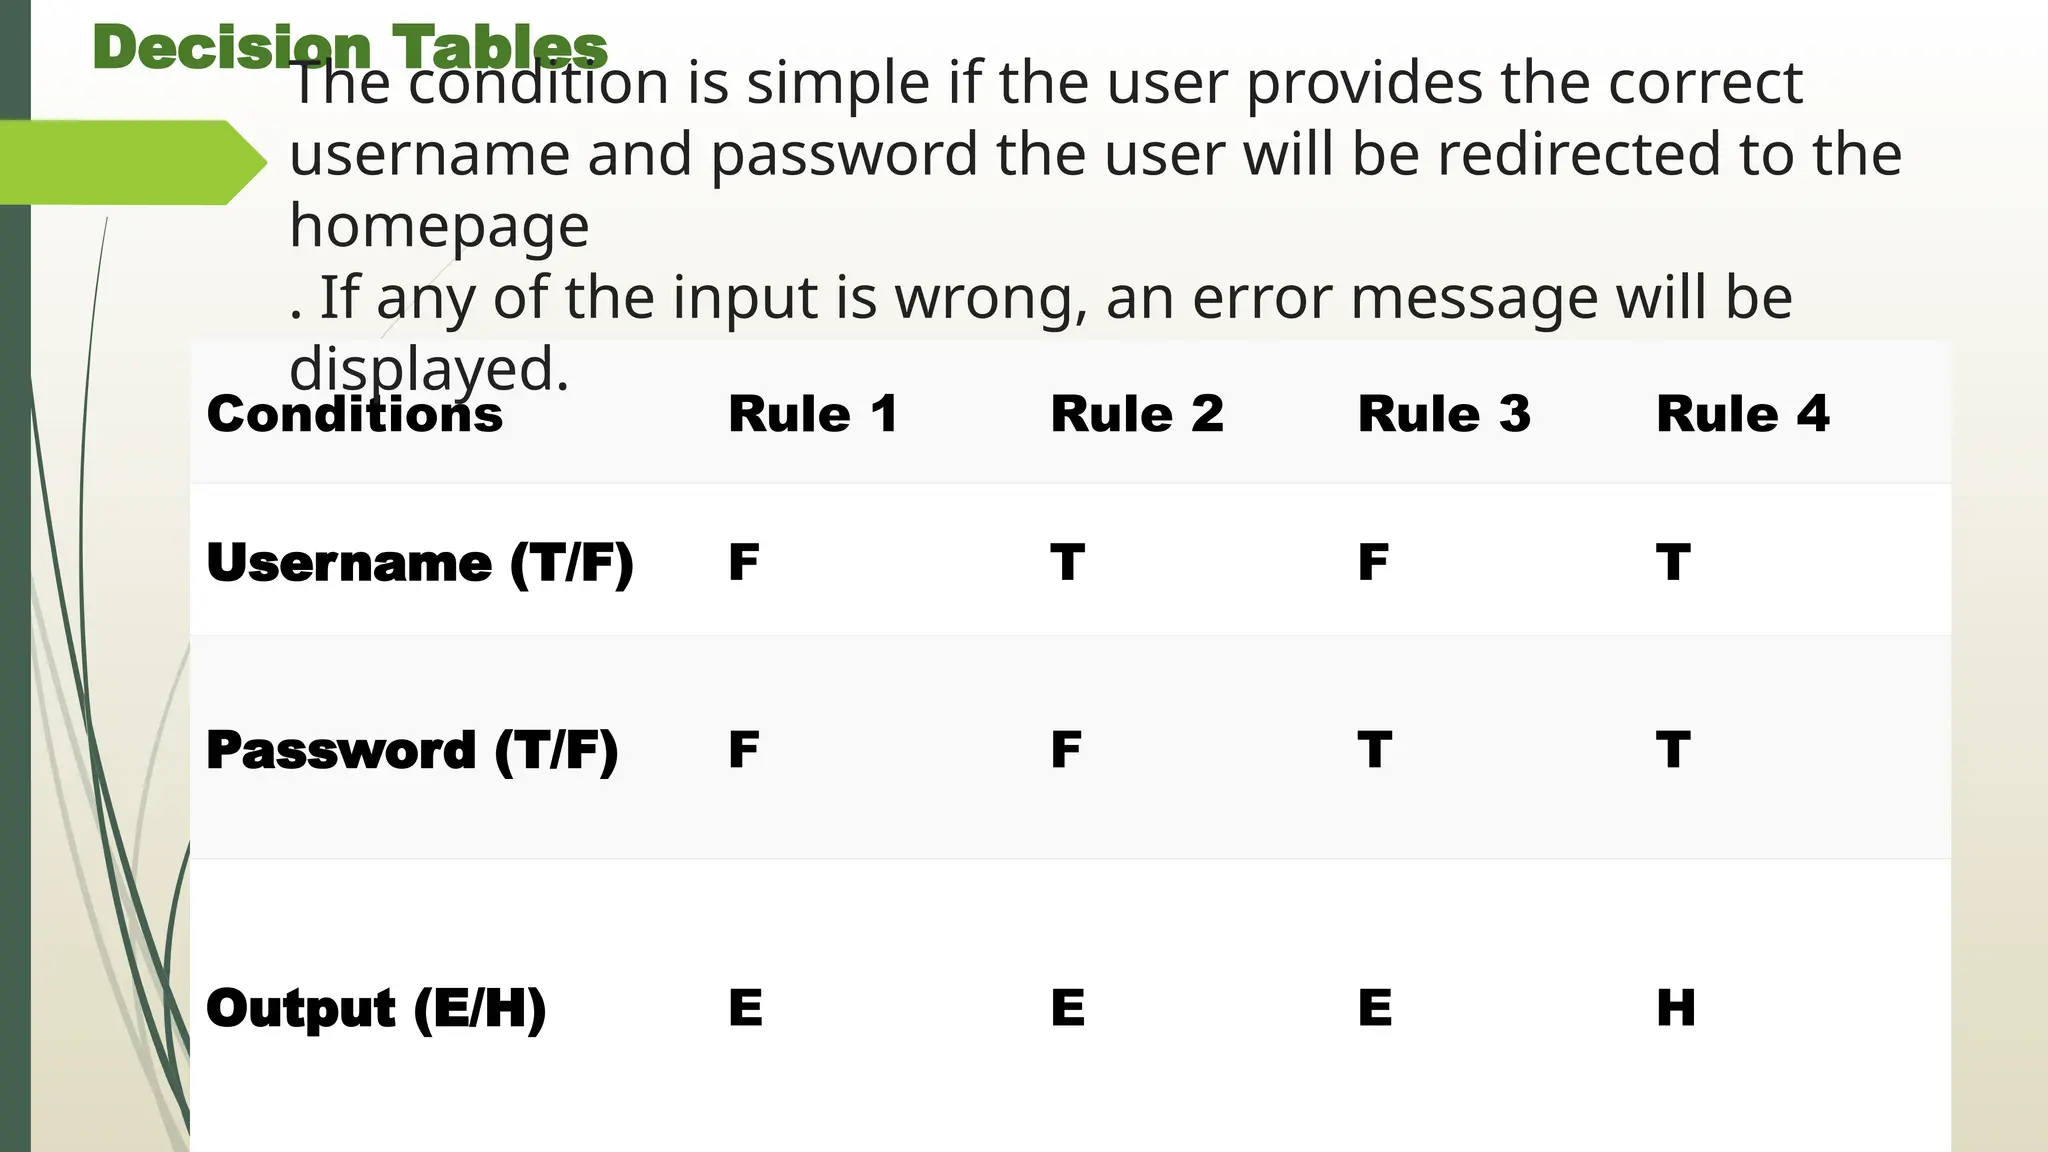
Decision Tables
Conditions Rule1 Rule 2 Rule 3 Rule 4
Username (T/F) F T F T
Password (T/F) F F T T
Output (E/H) E E E H
The condition is simple if the user provides the correct
username and password the user will be redirected to the
homepage
. If any of the input is wrong, an error message will be
displayed.
66.
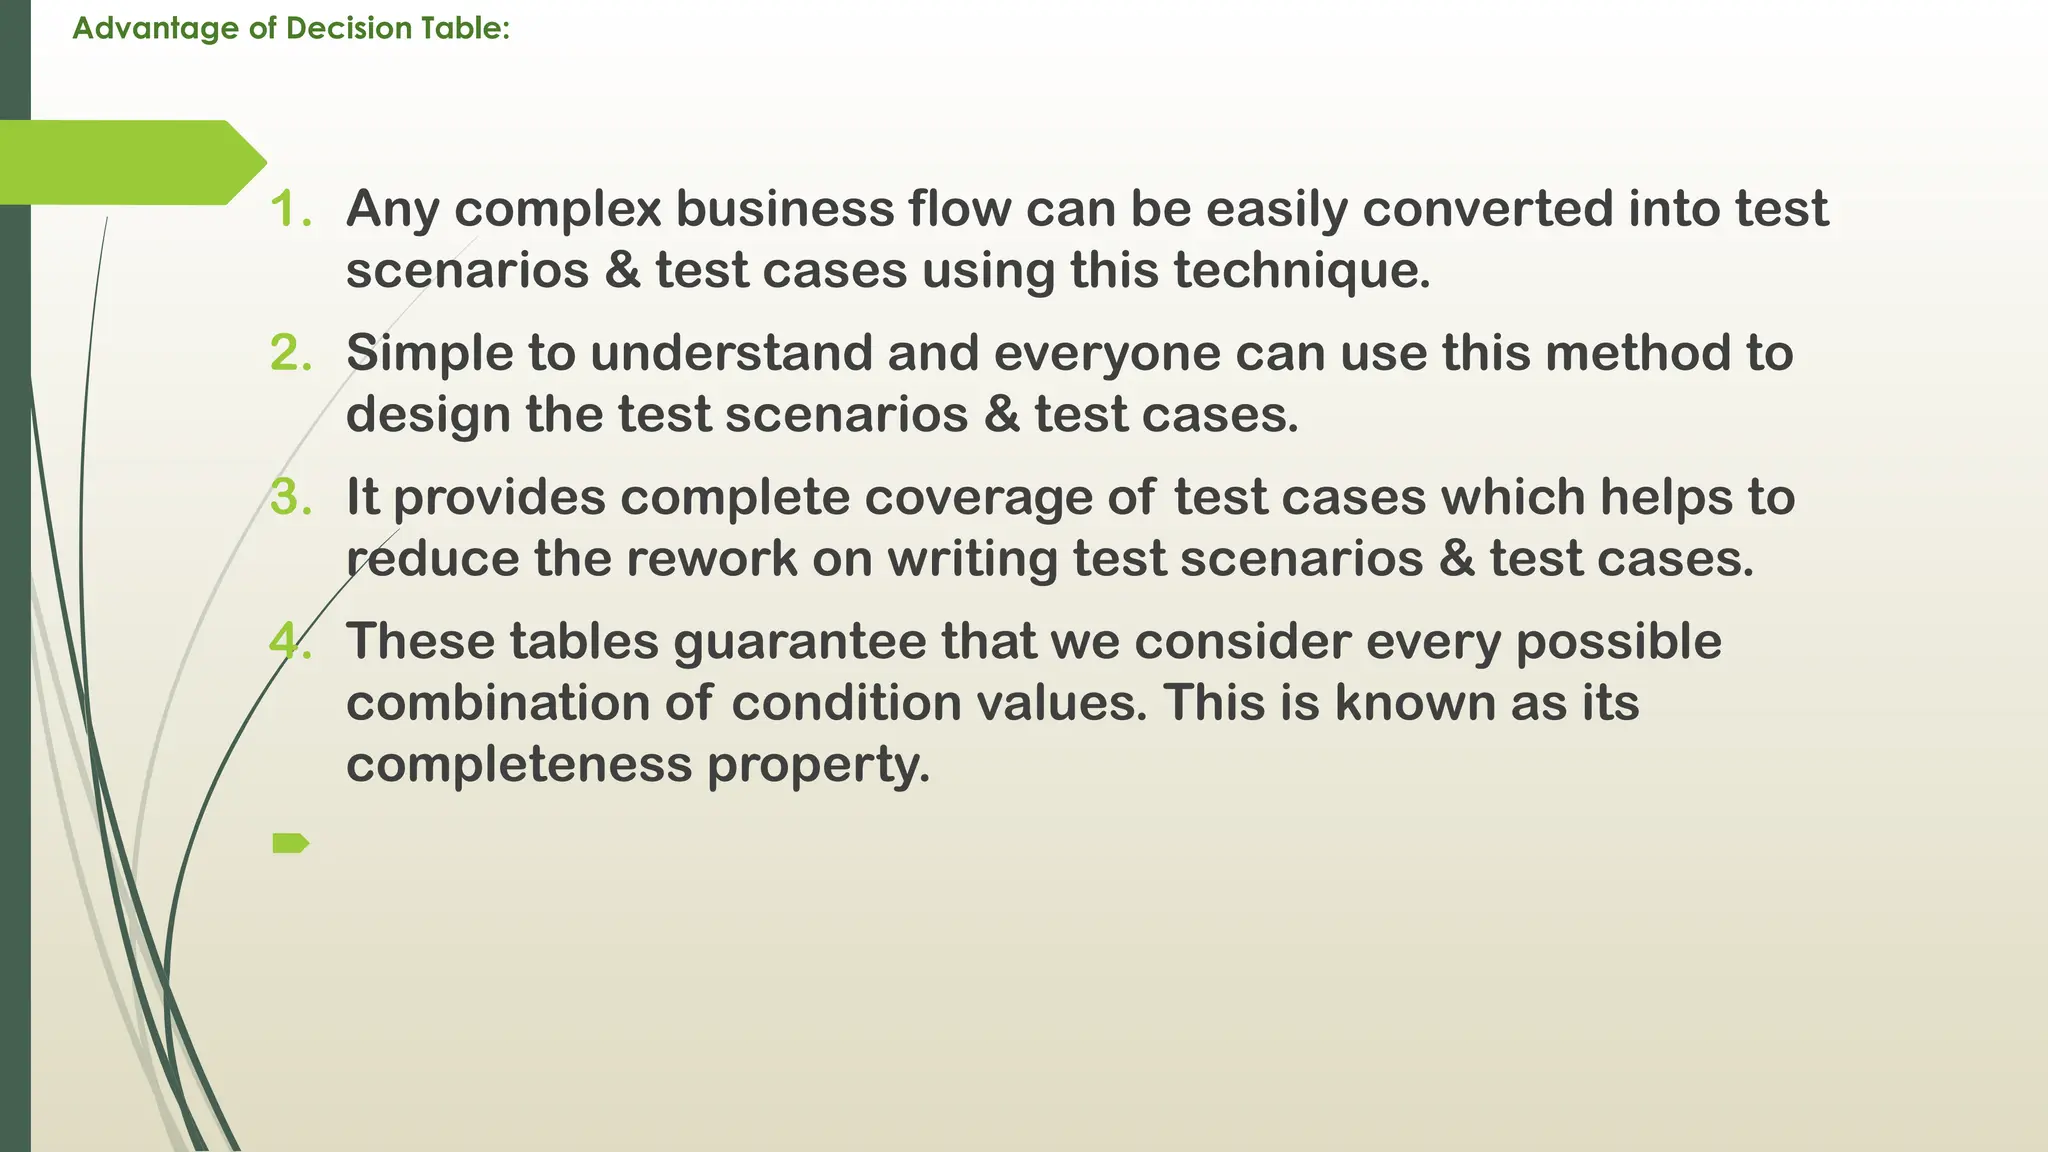
Advantage of DecisionTable:
1. Any complex business flow can be easily converted into test
scenarios & test cases using this technique.
2. Simple to understand and everyone can use this method to
design the test scenarios & test cases.
3. It provides complete coverage of test cases which helps to
reduce the rework on writing test scenarios & test cases.
4. These tables guarantee that we consider every possible
combination of condition values. This is known as its
completeness property.
Steps to createdecision tables:
Step 1 – Analyze the requirement and create the first column
Step 2: Add Columns
Step 3: Determine actions
Step 4: Write test cases
69.
Decision Trees
Decision treeis a tree like structure that represents
the various conditions and the subsequent possible
actions.
It also shows the priority in which the conditions are to
be tested or addressed.
Each of its branches stands for any one of the logical
alternatives and because of the branch structure, it is
known as a tree.
70.
Decision Trees
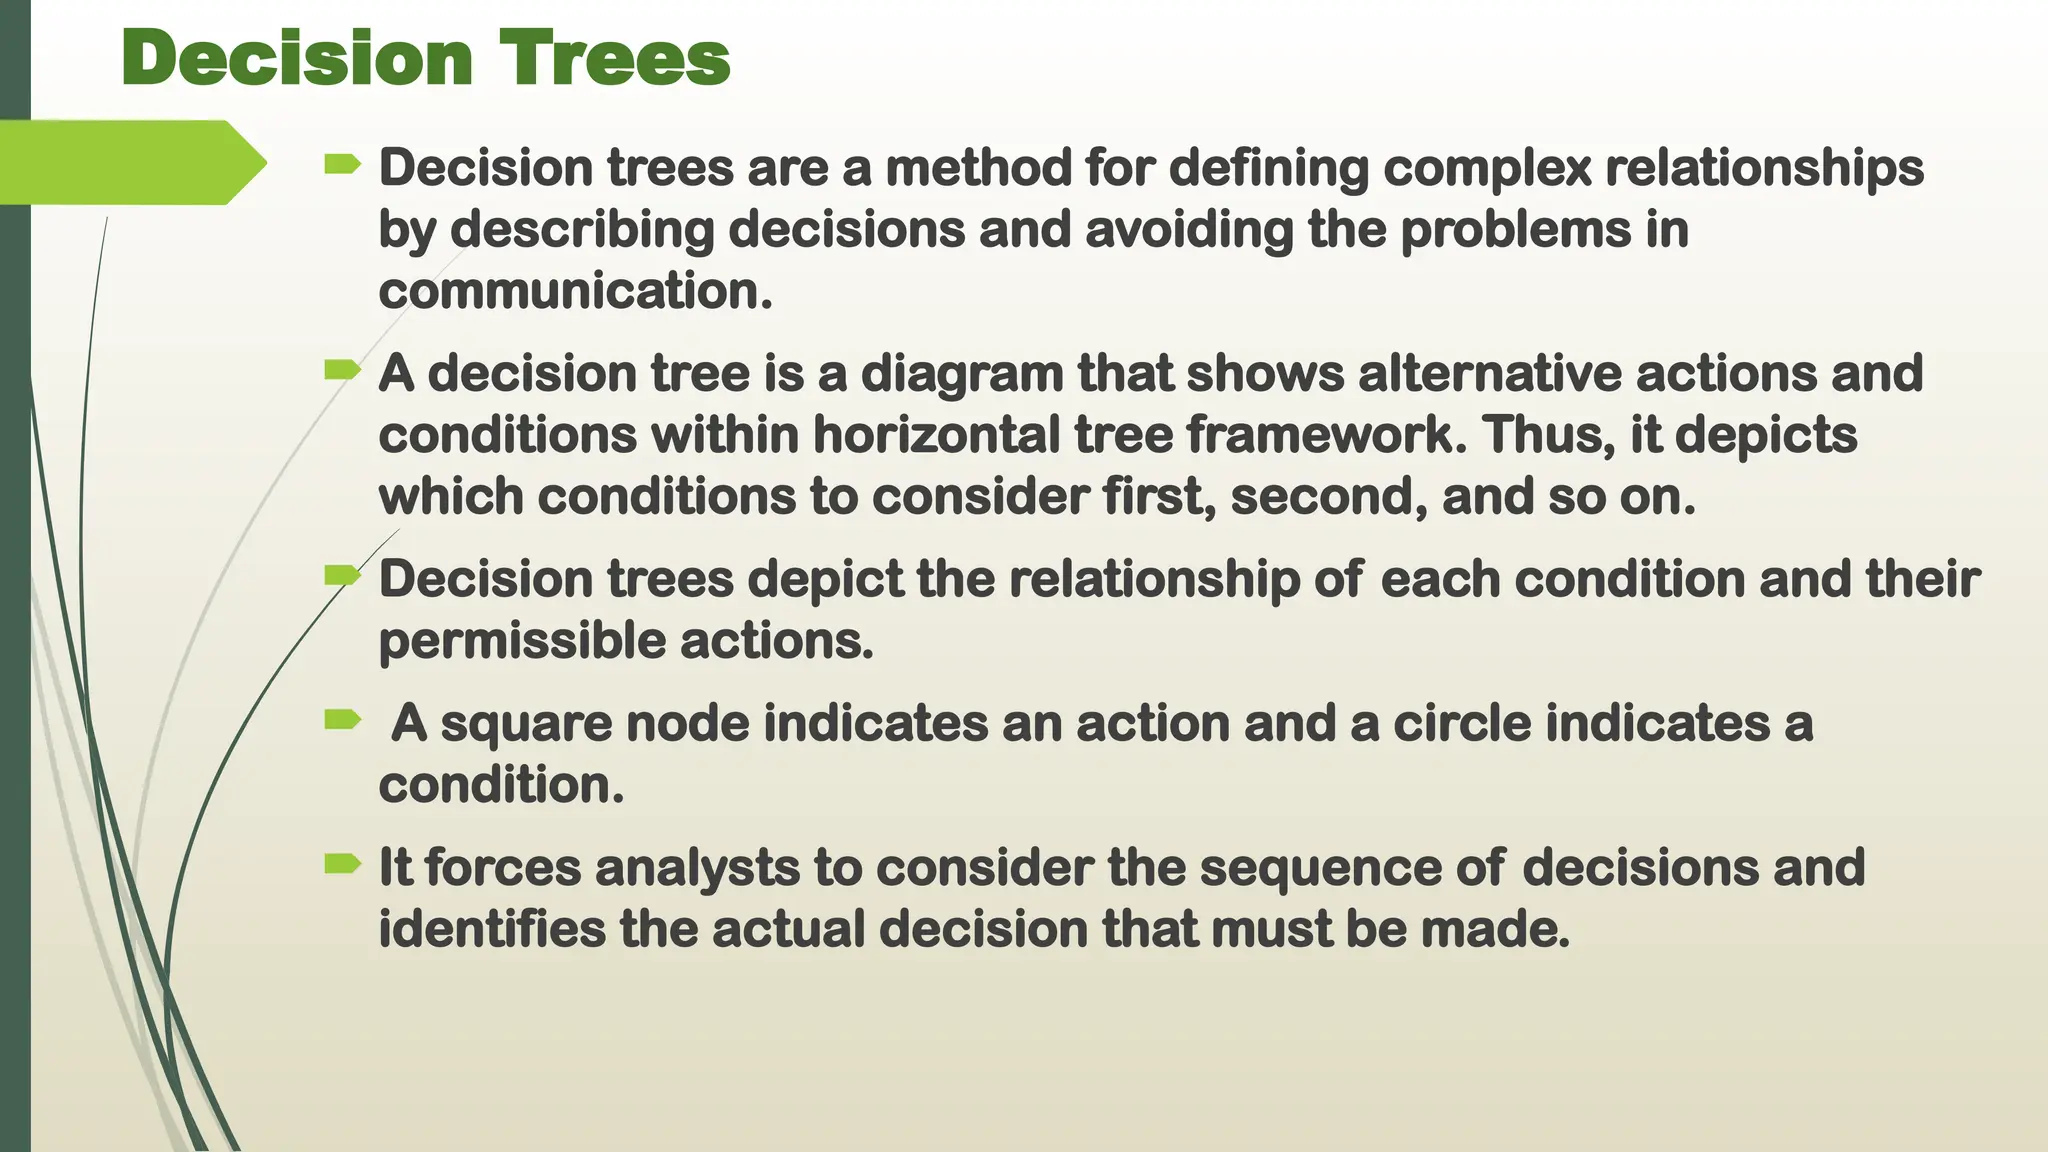
Decisiontrees are a method for defining complex relationships
by describing decisions and avoiding the problems in
communication.
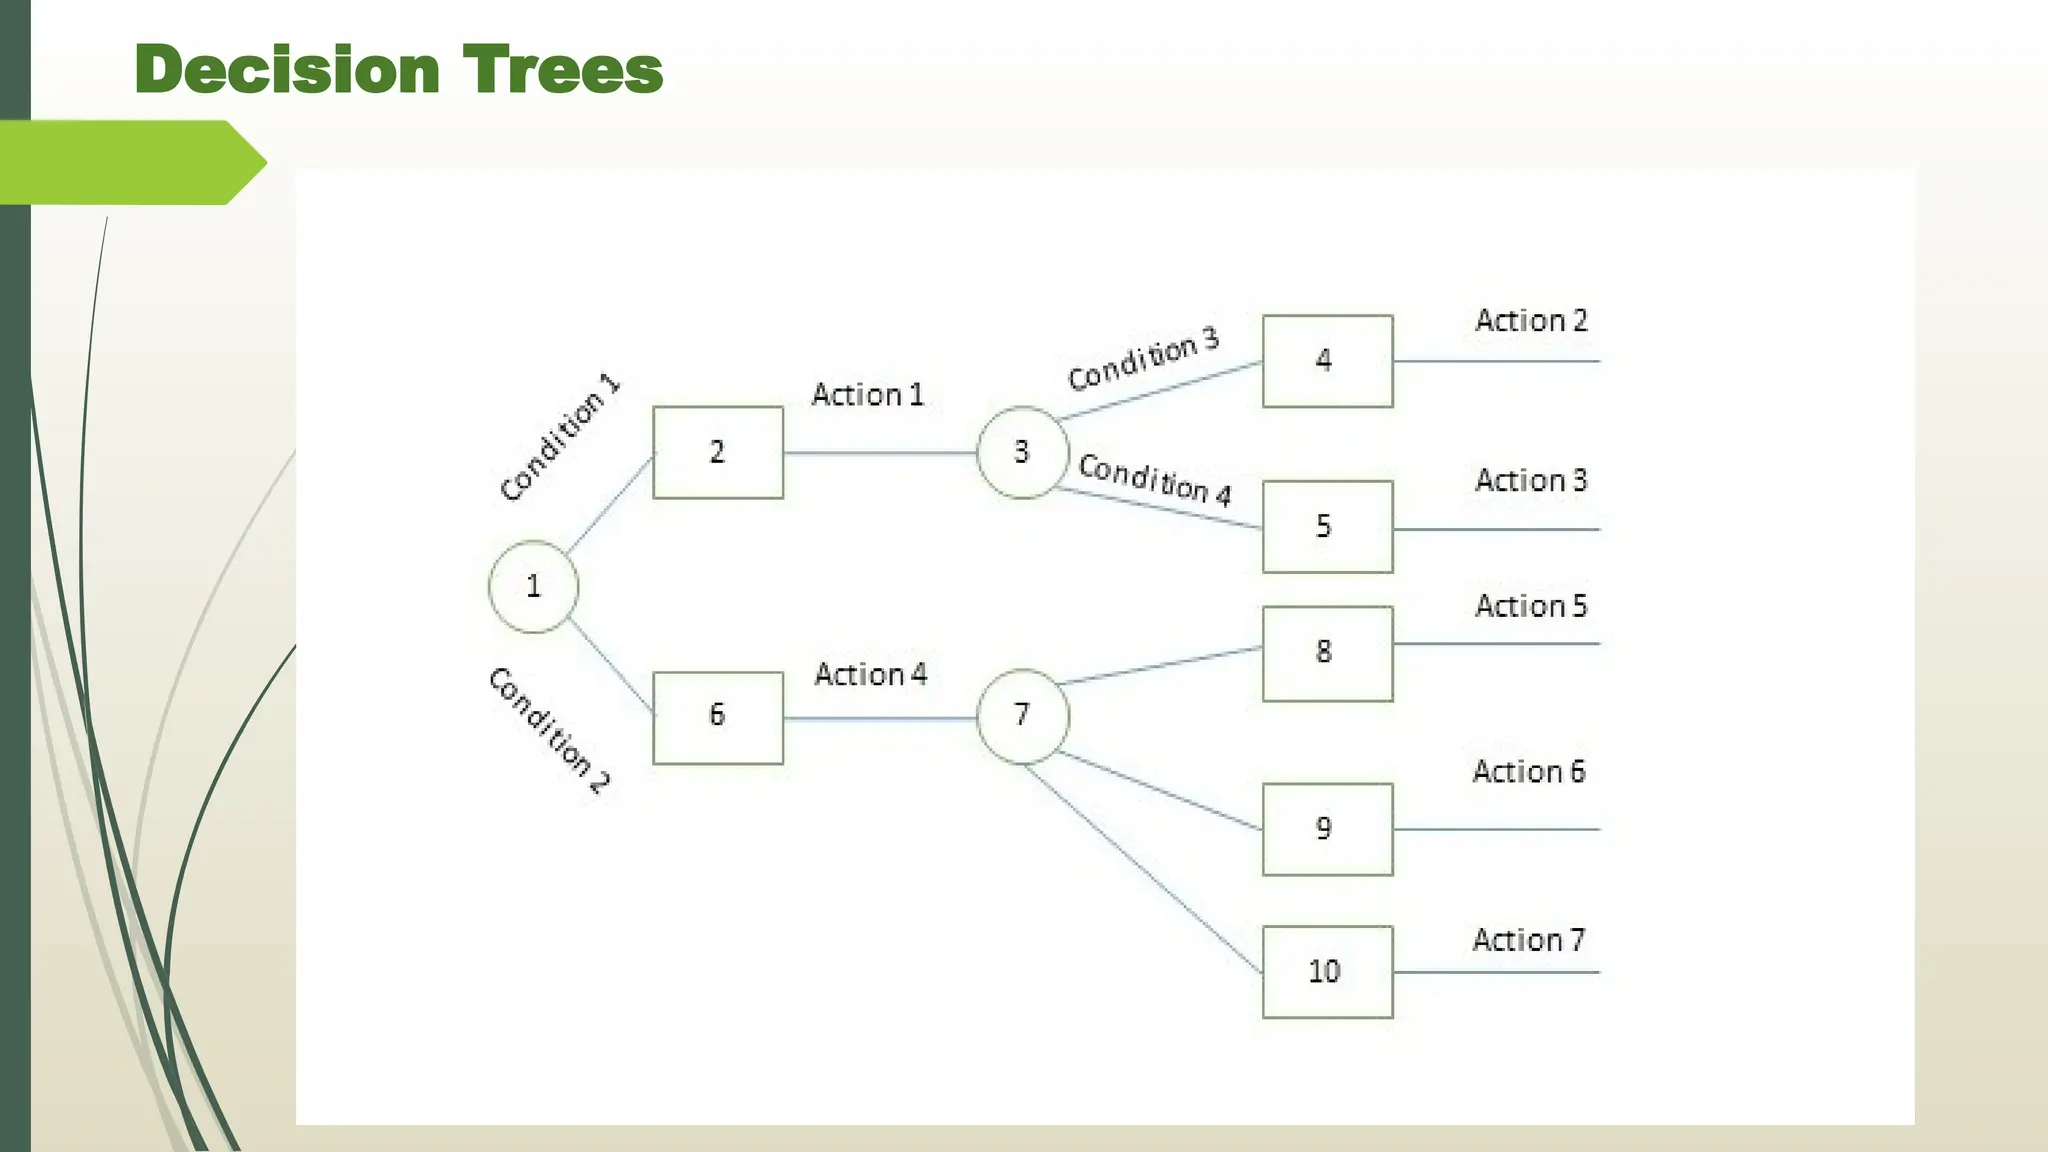
A decision tree is a diagram that shows alternative actions and
conditions within horizontal tree framework. Thus, it depicts
which conditions to consider first, second, and so on.
Decision trees depict the relationship of each condition and their
permissible actions.
A square node indicates an action and a circle indicates a
condition.
It forces analysts to consider the sequence of decisions and
identifies the actual decision that must be made.
Steps to makedecision trees:
1. Identify all conditions and actions and their order and timing
(if they are critical).
2. Begin building the tree from left to right, making sure you list
all possible alternatives before moving to the right.
Use decision trees when
1) The sequence of conditions and actions is critical, OR
2) When not every condition is relevant to every action (the
branches are different).
74.
Advantages and Disadv.of Decision Trees:
Advantages:
Simple to understand and to interpret. Trees can be visualize
Requires little data preparation.
Able to handle both numerical and categorical data.
Able to handle multi-output problems.
Disadvantages:
Decision trees can be unstable because small variations in
the data might result in a completely different tree being
generated.
Decision tree learners create biased trees if some classes
dominate.
75.
Assignment :3
Q1: whatis data flow diagram ?
Q2. what is meant by structured analysis?
Q3. explain data dictionary.
Q4. Explain IPO &HIPO in brief & diff. b/w them.
Q5. explain pseudocode and steps to create it.
Q6. explain flowchart.
Q7. explain decision tables& tree.
Q8. give 5 differences between flowchart & DFD.
![Data Flow Diagram [DFD]
Data flow diagram is graphical representation of flow of data
in an information system.
It is capable of depicting (to show)incoming data flow,
outgoing data flow and stored data.
DFD does not mention anything about how data flows
through the system.
DFDs depict flow of data in the system at various levels
DFD does not contain any control or branch elements
Data Flow diagrams are very popular because they help us
to visualize the major steps and data involved in
software-system processes.](https://image.slidesharecdn.com/2-250419054823-c37cdb77/75/data-analysis-and-interpratation-in-reserch-8-2048.jpg)