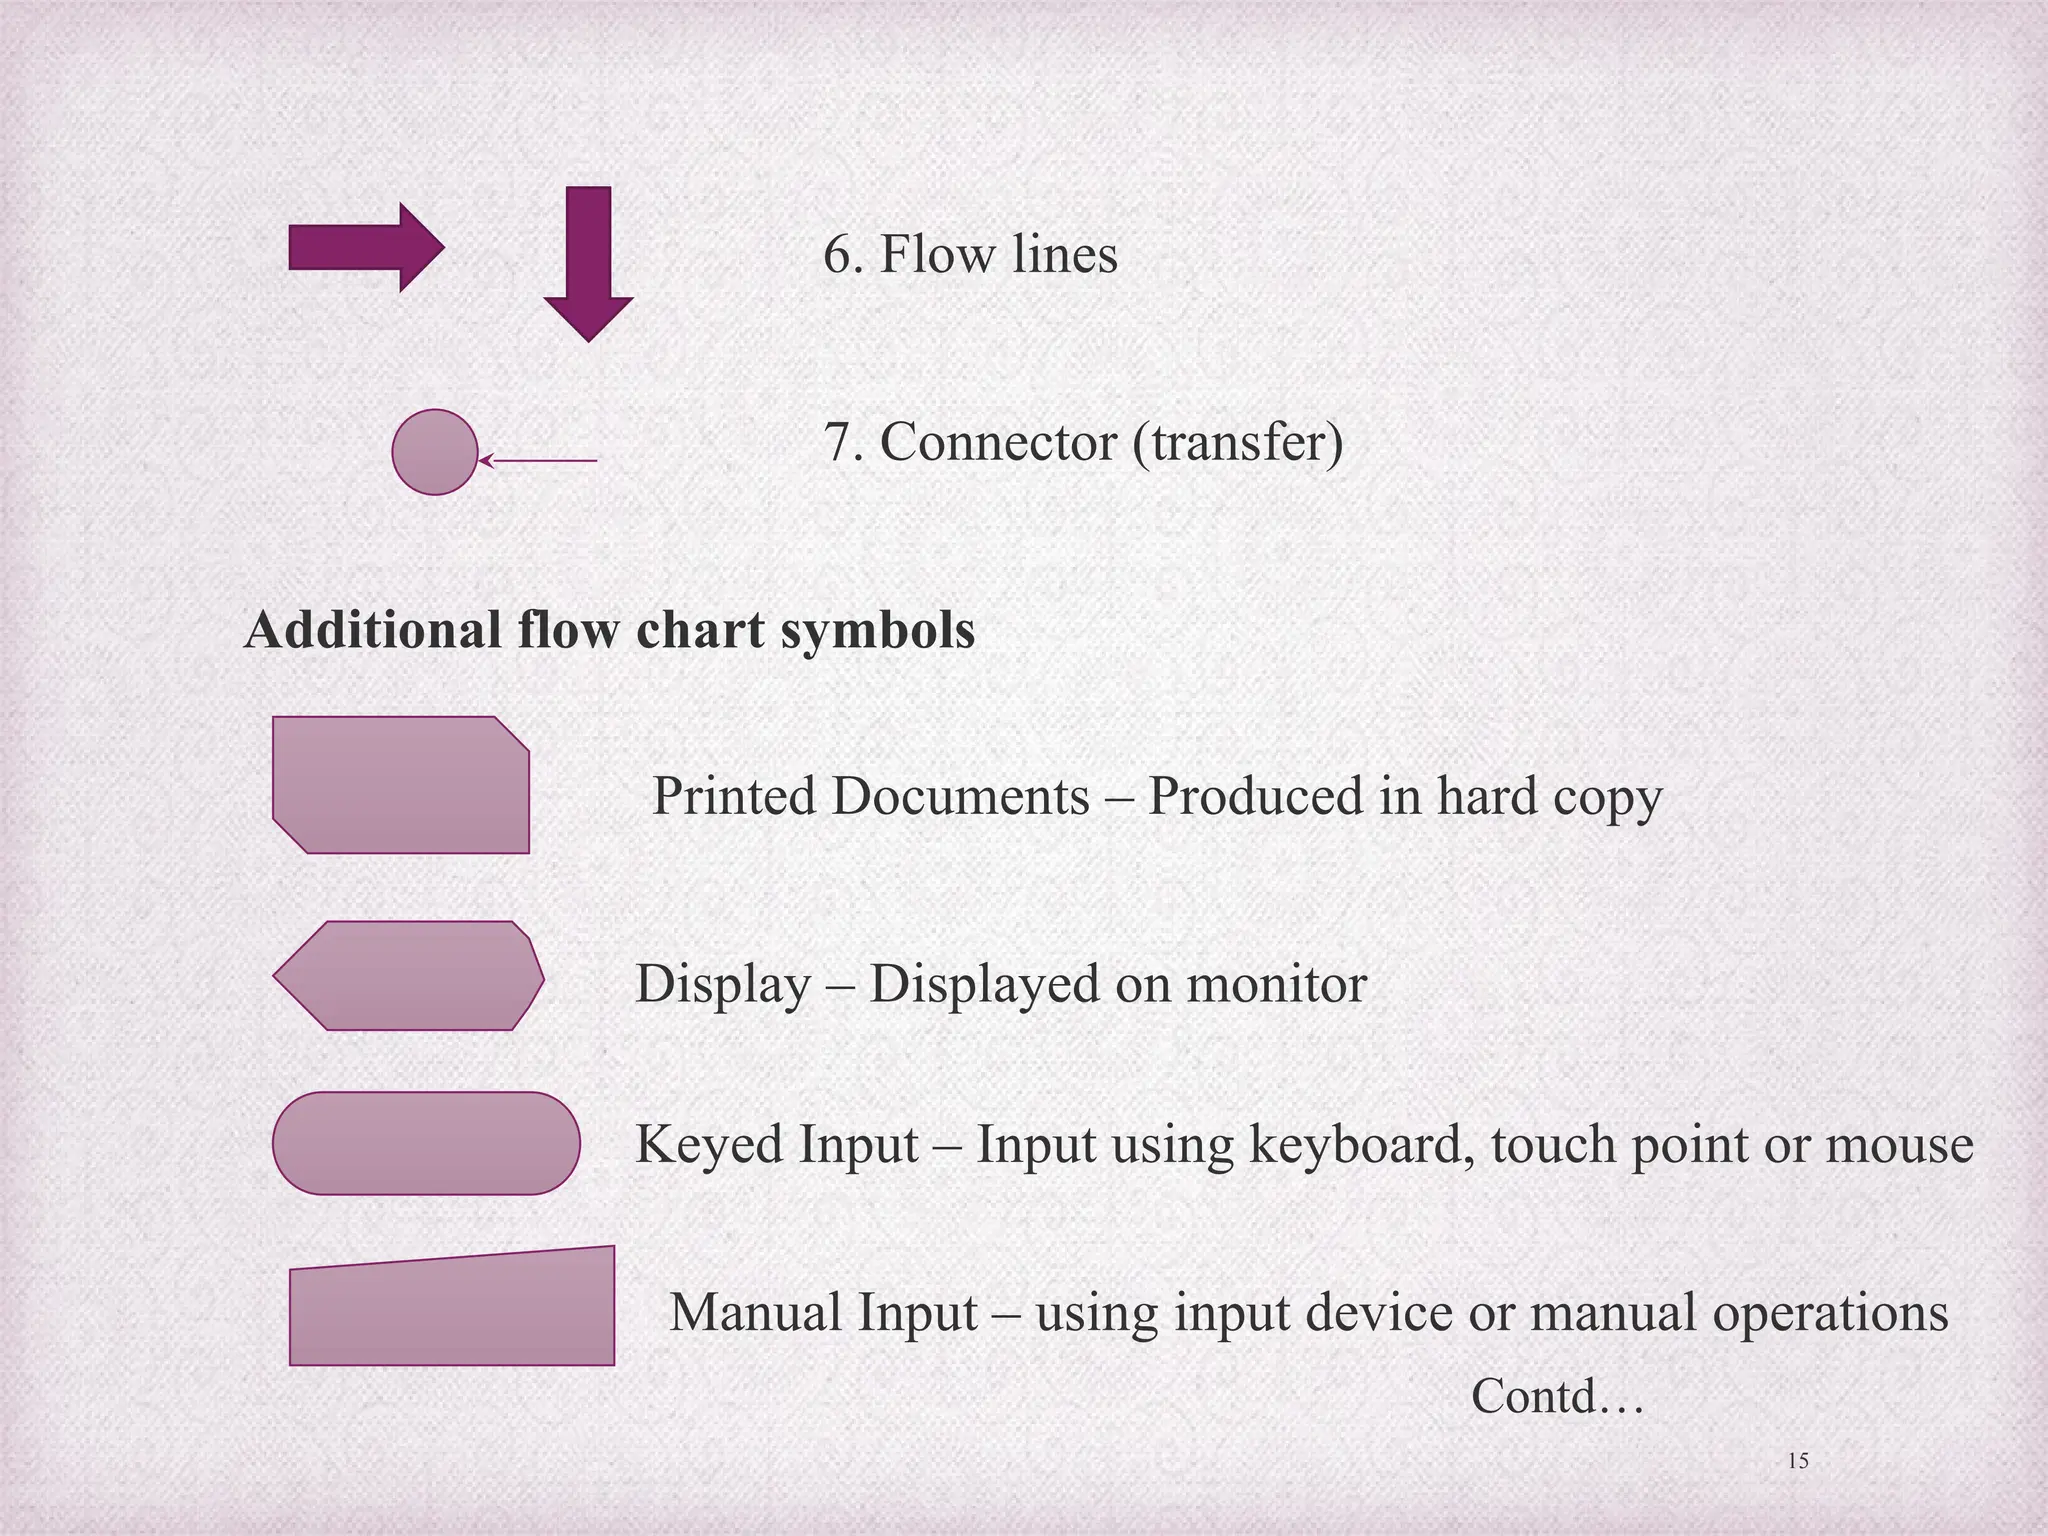
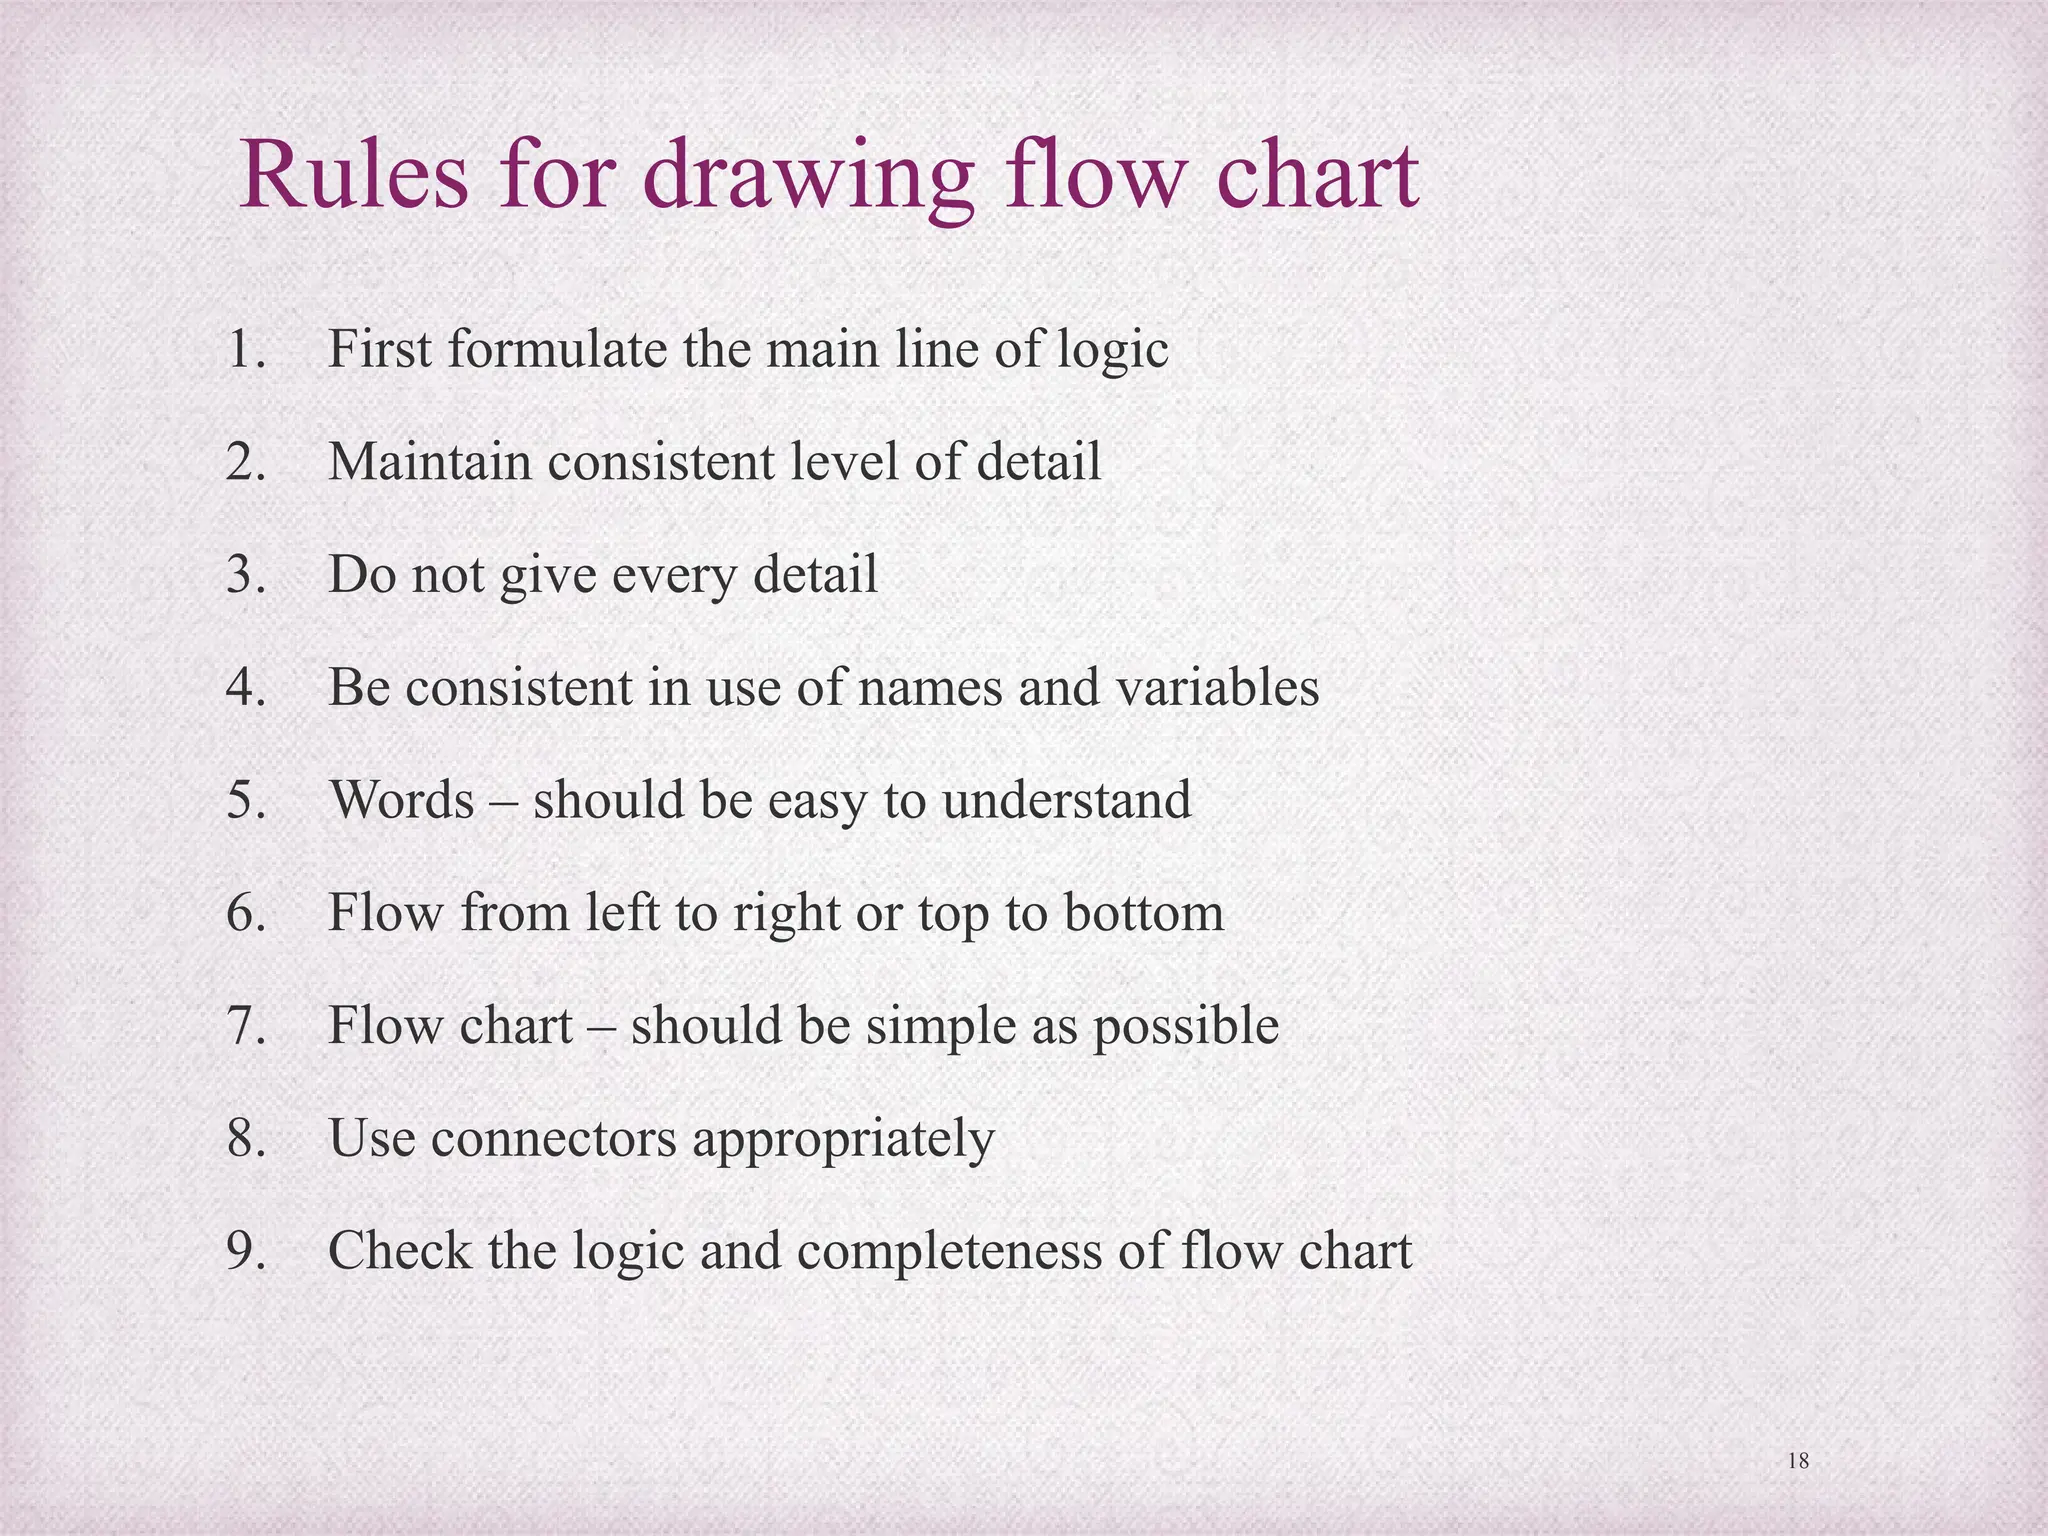
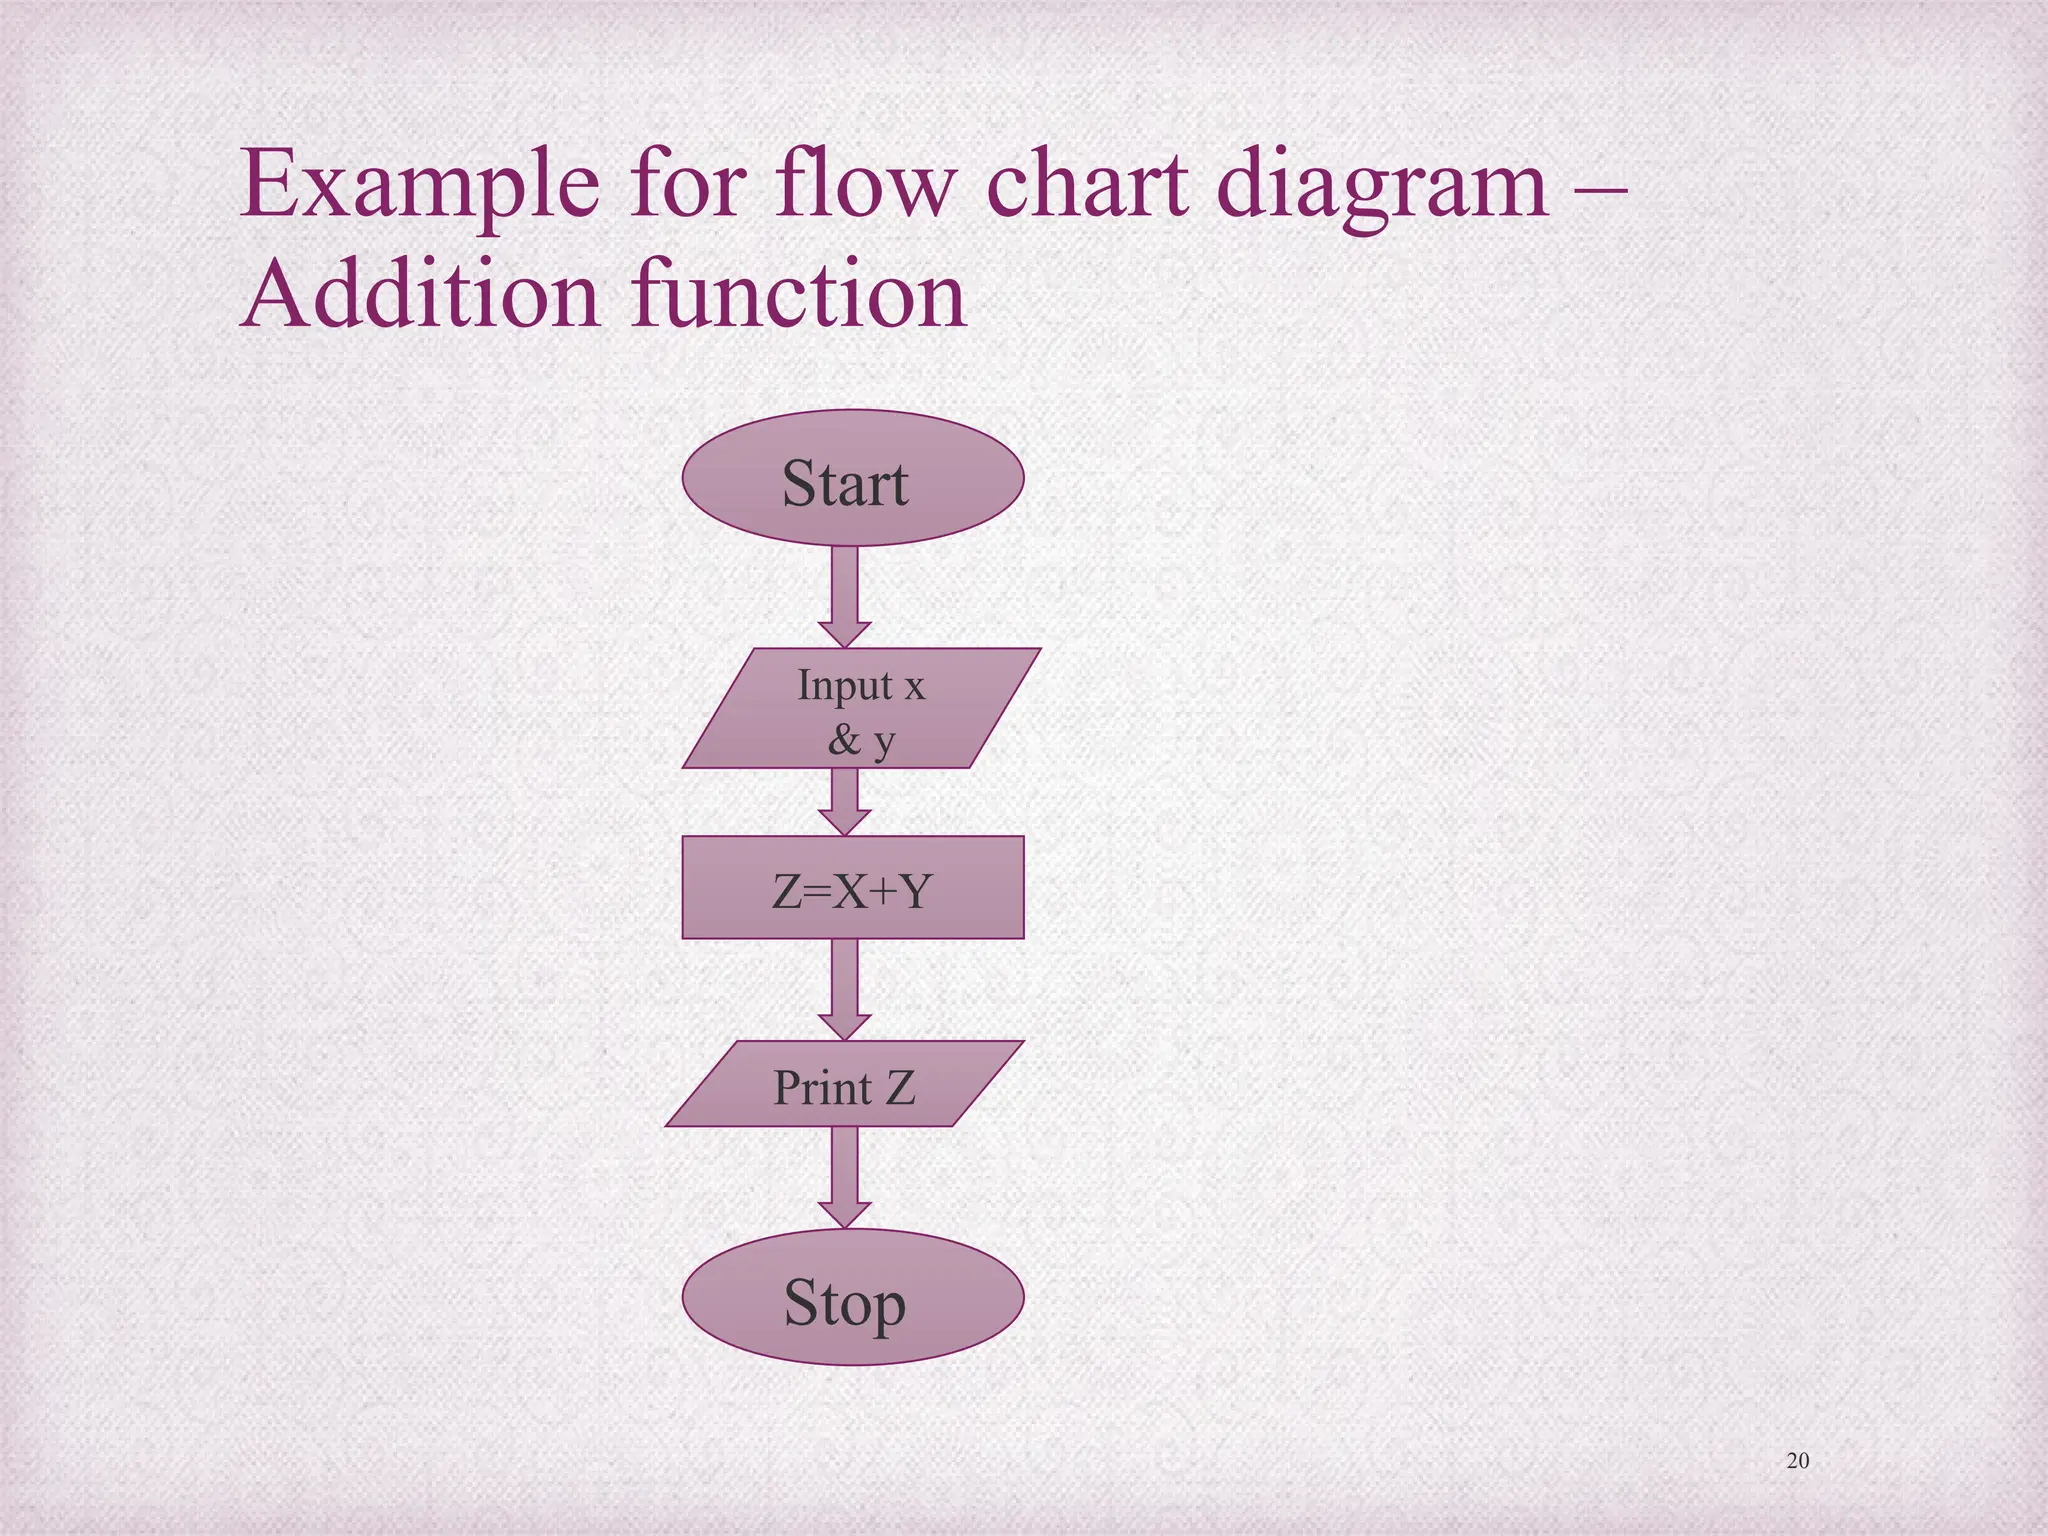
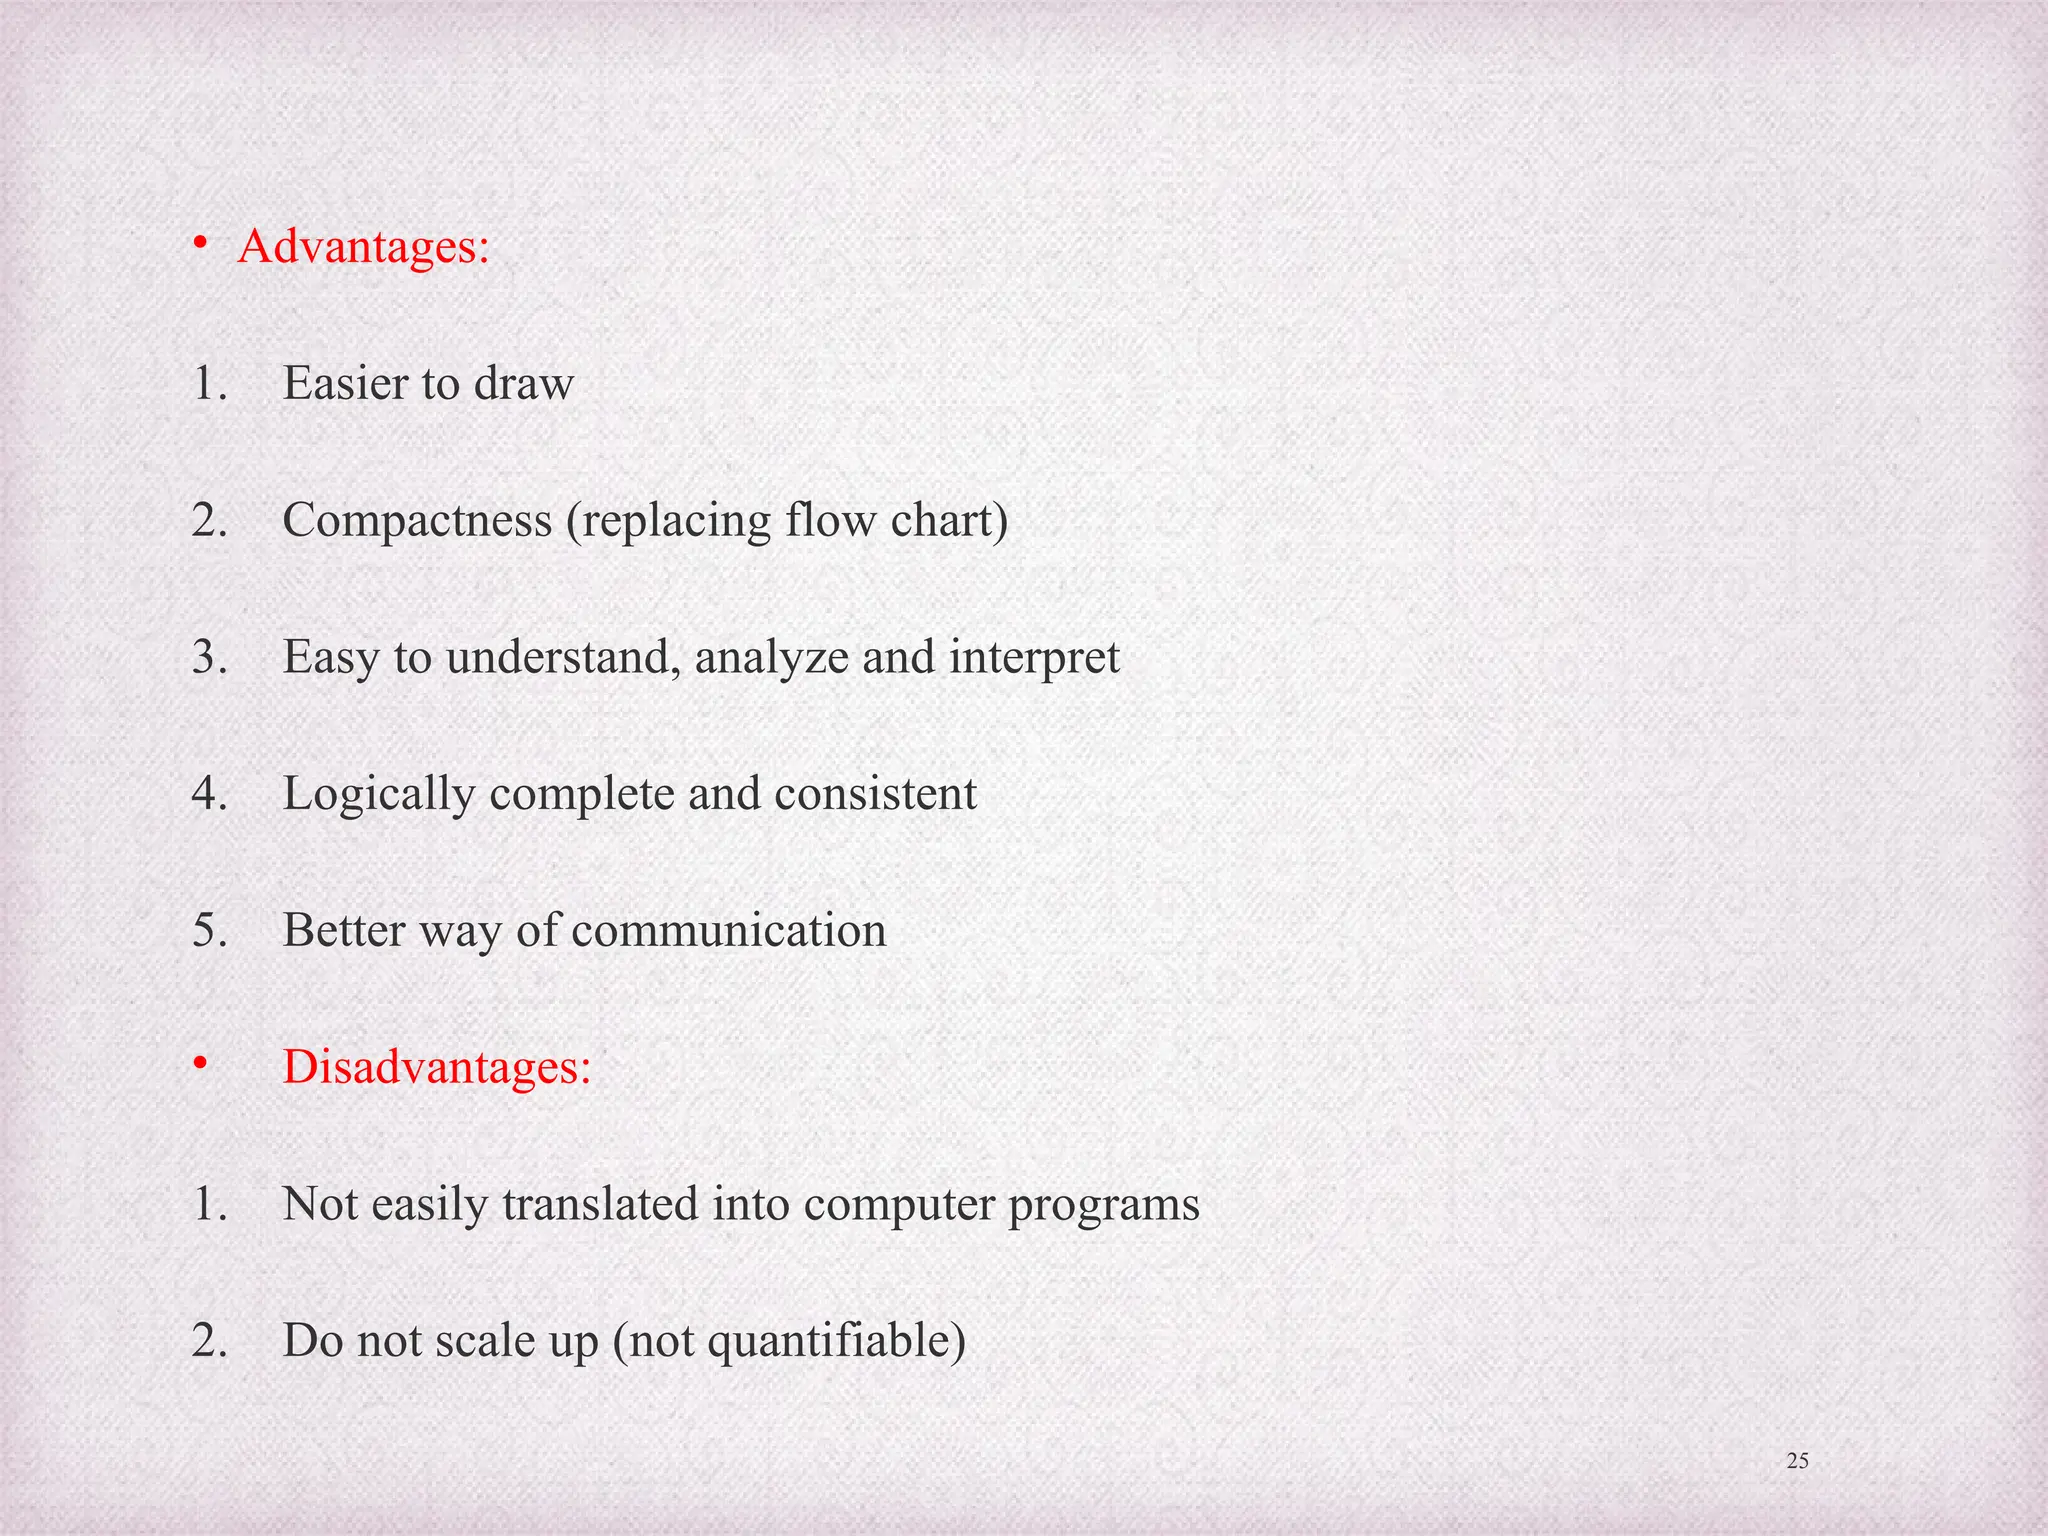
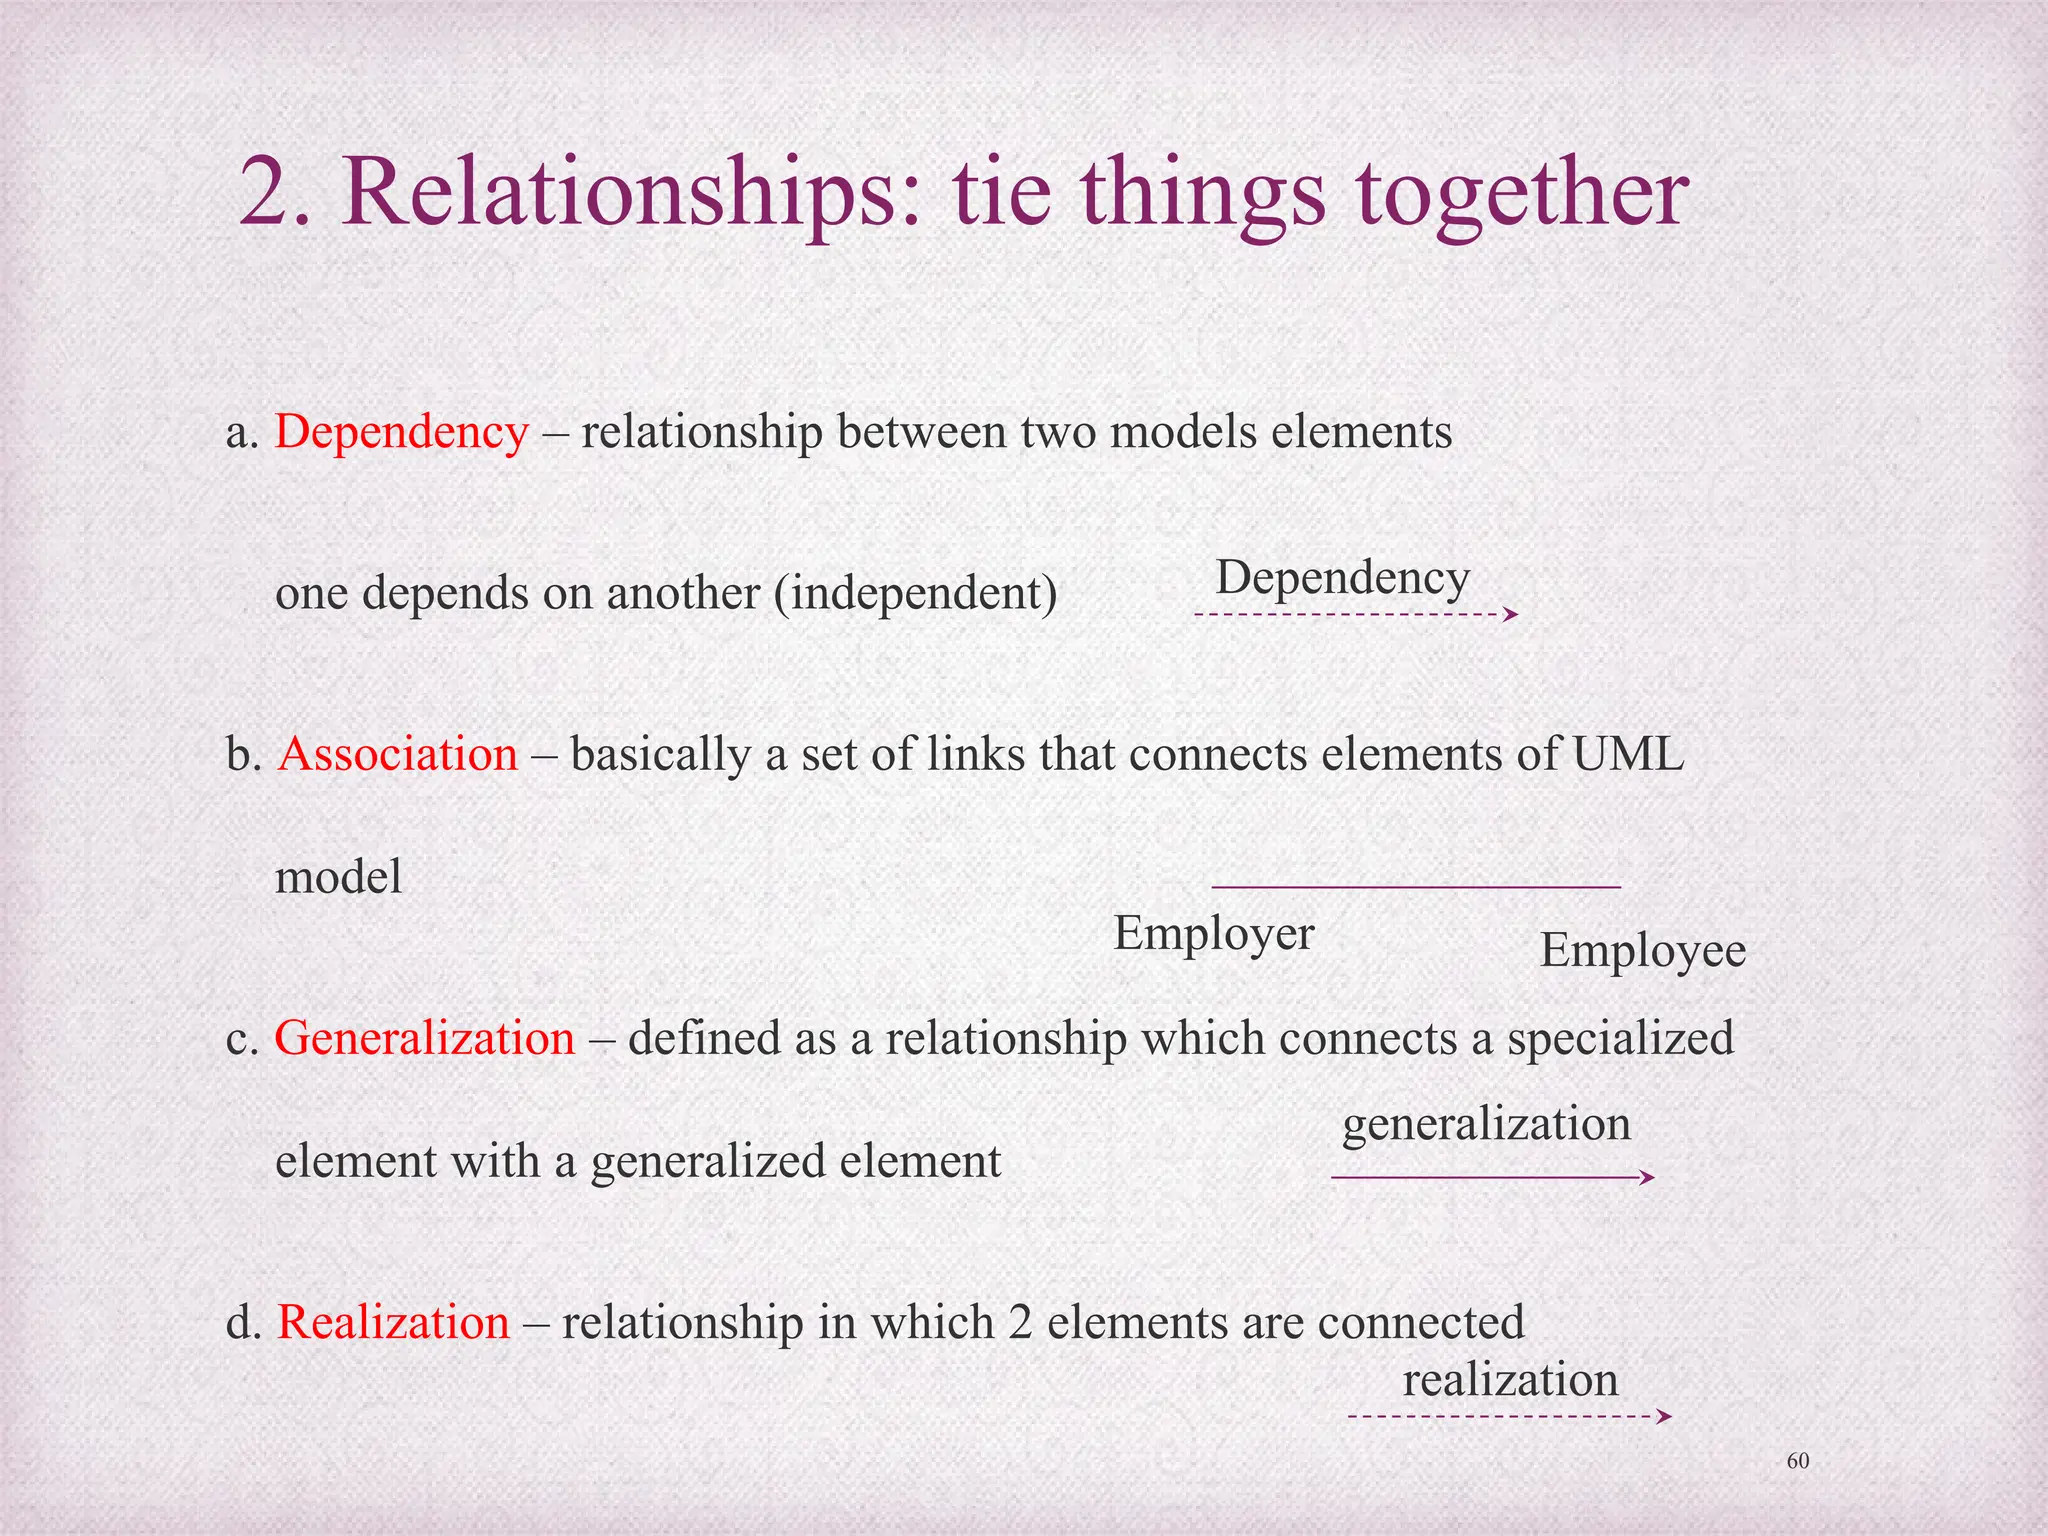
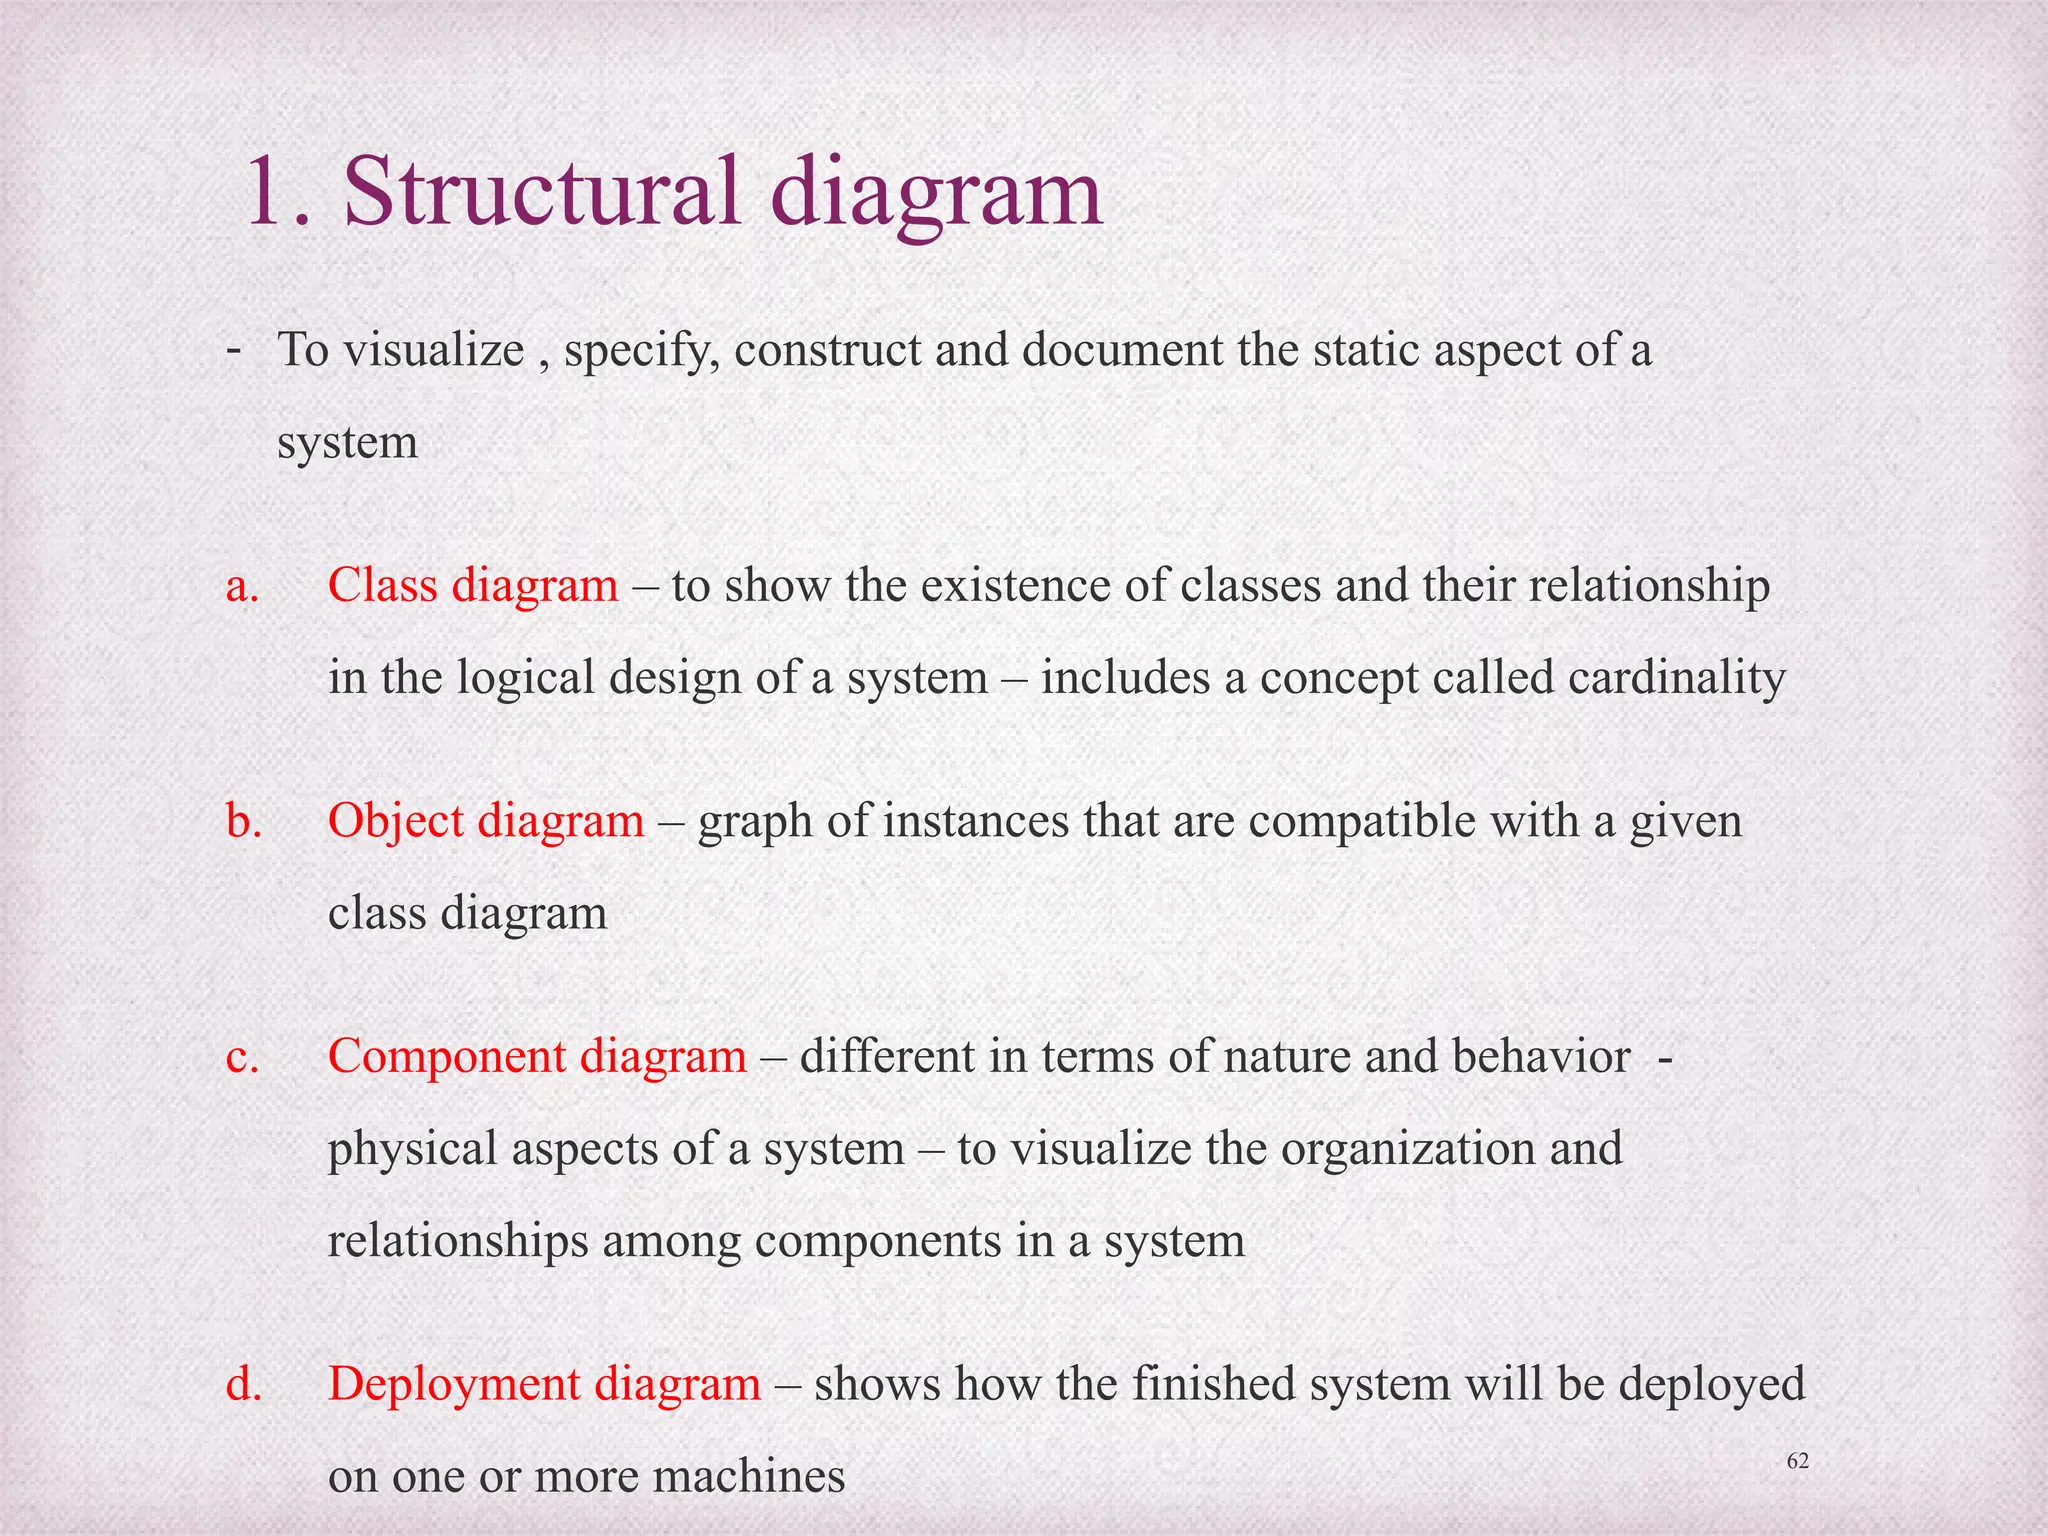
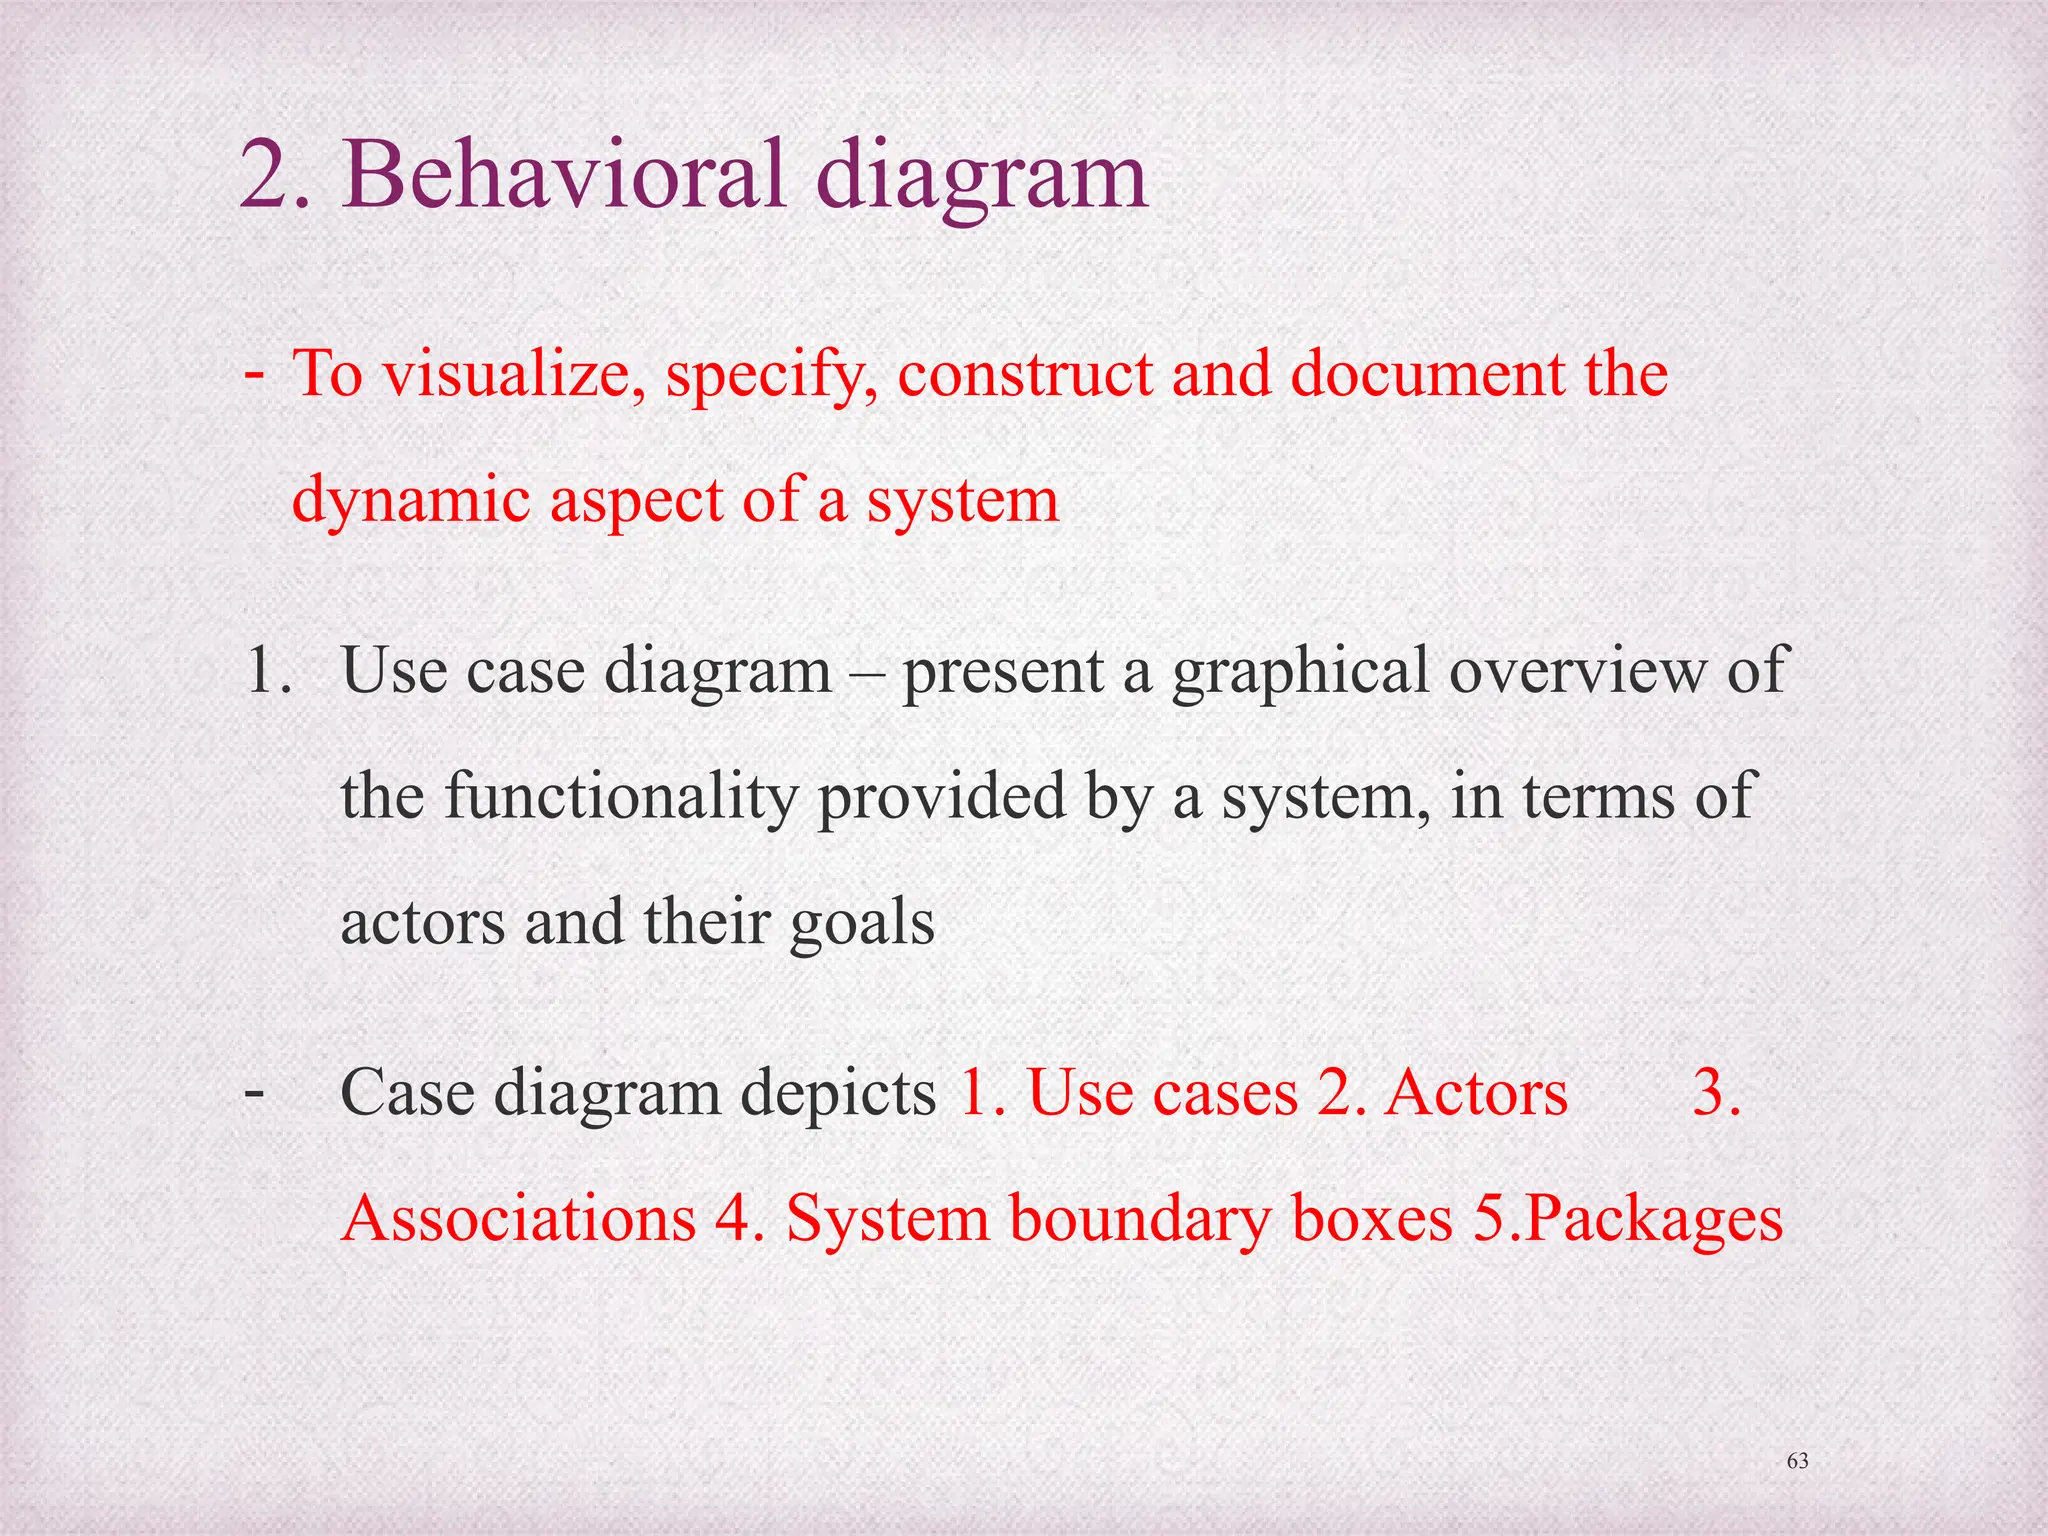
Design Methodology
& Techniques
Unit : 04
Content
• Case tools
• System flow chart
• Decision table
• Data flow diagram (DFD)
• Entity relationship (ER)
• Object oriented analysis and design (OOAD)
• UML diagram
2
System analysis
• Process of gathering and interpreting
facts, diagnosing problems and using the
information to recommend
improvements to the system
3
System design
• Process of planning a new system or one to
replace or complement an existing system.
• Process by which system analyst, software
engineer and programmers build the system –
system development life cycle (SDLC)
• The main objective of system analysis – to
understand current system – and to determine
importance, complexity and scope of problems.
4
Problems/ Issues
1. Paper work bottlenecks/ lack of systematic procedures
2. Delay in loan approval process
3. Lack of standardized procedures
4. Delay in passing purchasing orders
Above listed are some examples of problem in system
This cause firm to lose customers and business
opportunities
5
Process of system analysis
• It is important for the system analyst to:
1. Collect information about procedures and
information needs
2. Interviews, questionnaires and work samples
3. Work distribution analyses
4. Systems and procedures analysis
Methods of collecting information about current
system.
6
Tools for information requirement
1. Interviewing
2. Questionnaires
3. Brainstorming
4. JAD (Joint application
development)
7
Approaches in system design
• 2 types of approaches in system design
1. Structured approach
2. Unstructured approach
The tools for structured approaches as follows:
3. Data flow diagram (DFD)
4. Structure diagram/structure charts
5. Decision table
6. Decision tree
7. Entity relationship 8
System design
• Consists of both logical design and physical design
and system specification
1. Logical system design:
- involves developing general specifications
- Basic information system activities of input,
processing, output, storage and control
- meet end user requirements – feasibility study
Contd…9
2. Physical system design:
- involves the detailed design of user interface
methods and products, database structures and
processing & control procedures
- Knowledge of business operations, information
processing and hardware and software – to specify
the physical design.
10
Diagrammatic representation of
system design
Screen, form, report and Data element Program and
dialogue design Structure design Procedure design
User interface
design
Data Design
Process
design
11
System specifications
1. User interface specifications
2. Database specifications
3. Software specifications
4. Network and hardware specifications
5. Personnel specifications
12
Phases of system development
1. Conceptualize, clarify, document and
communicate the activities and resources involved
2. Analyze the present business operations,
management decision making and information
processing
3. Propose and design new or improved information
system
13
System flow chart
1. Terminal - start or stop action here
2. Input/ Output – Take input variables and print output
3. Process - Operational action
4. Entry connector
Yes
No
5. Decision symbol – if condition and 2 paths
Contd…
14
15
6. Flow lines
7. Connector (transfer)
Additional flow chart symbols
Printed Documents – Produced in hard copy
Display – Displayed on monitor
Keyed Input – Input using keyboard, touch point or mouse
Manual Input – using input device or manual operations
Contd…
16
Offline storage – data stored in hard disks like offline devices
Online storage – data stored in online devices
Auxiliary operation – operation performed by machine
Magnetic tape – storage data device
Magnetic disk – magnetic disk storage device
Communication Links – data transmissions from
one location to another location
Contd…
17
Annotation – Additional explanatory notes
Pre-defined process – group of operations from a
separate module
Merge – Combines two or more set of items
Extract – process that separate one or more specific
set of items
Sort – process that arrange – set of items in sequence
Collate- perform both merge and extract operations
Rules for drawing flow chart
1. First formulate the main line of logic
2. Maintain consistent level of detail
3. Do not give every detail
4. Be consistent in use of names and variables
5. Words – should be easy to understand
6. Flow from left to right or top to bottom
7. Flow chart – should be simple as possible
8. Use connectors appropriately
9. Check the logic and completeness of flow chart
18
• Advantages:
1. Convey better meaning
2. Effective joining of part into system
3. Efficient coding
• Disadvantages:
1. Takes more time
2. Difficult to make changes
3. Non-standardized
19
Example for flow chart diagram –
Addition function
20
Start
Input x
& y
Print Z
Z=X+Y
Stop
Decision table
• Matrix representation of the logic of a decision
• Decision possible conditions and resulting actions
Decision table – table of contingencies for defining a problem
and action to be taken
Parts of decision table
1. Stub – 1. Condition stub and 2. Action stub
2. Entry – 1. Condition entry and 2. Action entry
21
Example for decision table
• Eligibility check of student
22
If age
below 18
Course A
First class
Completed
10th Indian
Y Y Y
Then Course B Y N Y
Condition stub
Action stub
Condition Entry
Action Entry
Types of decision table
1. Limited entry form – 2 possible states
2. Extended entry form – more than 2
possibilities
3. Else form – all other possibilities
23
Creating decision table
1. Name conditions and values that each condition can assume
2. Name all possible actions that can occur
3. List all possible rules
4. Define actions for each rule
5. Simplify decision table
24
• Advantages:
1. Easier to draw
2. Compactness (replacing flow chart)
3. Easy to understand, analyze and interpret
4. Logically complete and consistent
5. Better way of communication
• Disadvantages:
1. Not easily translated into computer programs
2. Do not scale up (not quantifiable)
25
Data flow diagram (DFD)
• DFD – a graphical representation of the
flow of data through information system
• Visualization of data processing
• It aims to capture the transformations that
take place within a system
26
Elements of Data flow diagrams
27
1. Process -
2. Data flow -
3. External entity -
4. Data stores -
- transformation of data into information
- Flow from one step to another step
- Send or receive data from external entity
- Inventory of data / database
Levels of data flow diagram
1. Context diagram: outlines the information system
- Highest level in the data flow diagram, contains only
one process – representing the entire system.
2. 0-level diagram: detailed process of information system
– more process at this level – difficult to understand
3. Level 1 diagram: next level of 0 level diagram –
decomposed and simplified, more explicit version.
28
Logical data flow diagram
• Concentrates on logical flow of data from one to end to
another end of a system
29
Supplier
Check
delivery
note
against
order
Update
inventory
file
Order file Inventory
data base
Rejected note
Delivery note Accepted note
30
Physical data flow diagram
• Implementation dependent
• Depicts the physical flow of data in the existing system
30
Supplier
Checking
clerk
Store
clerk
Order file Inventory
data base
Rejected note
Delivery note Accepted note
Steps to develop data flow diagram
1. Make a list of business activities
2. Create a context diagram
3. Draw zero level diagram
4. Create a child diagram of zero level diagram
5. Check the errors
6. Develop logical and physical flow data diagrams
7. Partition the physical flow diagram
31
DFD (Data flow diagram) rules
1. Process:
-no process can have only inputs
-no process can have only outputs
-A process has a verb phrase label
2. Data source:
-Data must be moved by a process
-Data cannot move directly from one data store to another
-Data store has a noun phrase label
3. Source/sink:
-Data cannot move directly from source to sink
-source/sink has a noun phrase label
32
4. Data flow:
- Data flow has only one direction or may be both directions
- Fork in data flow : same data flow to different locations
- Join in data flow: different sources to same location
- Data flow can’t go directly to the same process it leaves
- Data flow to data store ; “Update of data”
- Data flow from data store; “retrieve or use of data”
- Data flow has a noun phrase label
33
• Advantages:
1. Early implementation
2. Study independence
3. Analysis
4. Tool for communication
5. Reduce costs
• Disadvantages:
1. Imprecise
2. Absence of control aspects
3. Highly subjective
34
Entity – Relationship diagram
• ER model – proposed by peter in 1976 – to unify the
network and relational database views
• ER diagram or (data map) – another means of capturing
the data and their organization
- represents the interrelationships of the database
scheme
- relationship between table (relation) and ER diagram
MSM - MBA Even semster 2020 35
Objectives of Entity-relationship
diagram
1. Straight forward relational representation
2. Easy conversion of ER to other data model
3. Graphical representation – better
understanding
36
Notions for Entity – relationship diagram
37
1. Entity - an entity is an object or concept – store
information
2.Weak Entity - a weak entity is dependent on another entity
to exist
3. Attributes: attributes are properties or characteristics
of an entity
4. Key attributes: unique, distinguishing characteristic
of the entity
Contd…
38
Contd…
Multi valued attribute – can have more than one value
Derived attribute – a derived attribute based on
another attribute
Illustrates how two entities store information in the
database structure
Weak relationship - to connect a weak entity with others
39
- Mandatory one cardinality
- Optional one cardinality
- Mandatory many cardinality
- Optional Many cardinality
Components of ER diagram
• 3 primary components:
1. Entity – object that exists distinguishable from others
2. Attributes – Each entity has particular properties
3. Relationships – links various components in ER diagrams
(1) one to one (2) one to many (3) many to many
Example of ER diagram and data flow diagram
Admission management system in an educational system
40
CASE tools
(Computer Aided Software Engineering)
- Case tools - generic term – to denote automated
support associated with the software development
activities
- Supports the development, verification, maintenance
and evolution of processes and artifacts
- CASE tools – software programs – designed to assist
the programmers with the complexity of process
41
Reasons for using CASE tools
1. To increase analyst’s productivity
2. Facilitate communication among analysts and users
3. Providing continuity between life cycle phases
4. To assess the impact of maintenance
5. Cost reduction – automation of repetitive tasks
6. Reduce development time of project
7. Develop better quality complex projects
8. Create good quality of documentation
9. Maintenance and controllable system – can be created
42
Characteristics of CASE tools
1. Standard methodology
2. Flexibility
3. Strong integration
4. Integration with testing software
5. Support for reverse engineering
6. On-line help
43
Different classes of tools in SDLC
• Fischer and Mc Clare list – tools for each classes based on the SDLC
1. Analysis, design and specification tools
2. Data modeling tools
3. Prototyping tools
4. Coding tools
5. Testing tools
6. Implementation tools
7. Upper CASE tools – modeling of an organization’s functional requirements
8. Lower CASE tools – used to generate computer source code, eliminating need for programmers
9. Documentation tools
10. Inter phase design tools
11. Database management tools
12. Quality assurance tools
13. Visual and emerging development tools
44
Architecture of CASE environment
1. User interface layer – standardized interface toolkit
2. Tools layer – incorporates set of tools management services
(TMS) with the CASE tools
3. Object Management Layer (OML) – performs the
configuration management function
4. Shared repository layer – access control functions that enable
the object management layer to interact with the database
45
• Advantages:
1. Easy revision of system description and graphic representation
2. Support of system prototyping
3. Capability of producing working source code
4. Provide maintenance support
• Disadvantages:
1. Absence of standard levels of methodology
2. Limited functions supported
3. Conflicted use of diagrams
4. Human tasks remains critical
46
Object oriented analysis and design
(OOAD)
• OOAD – software engineering approach – models a system as
a group of interacting objects
• OOAD - real world entities in terms of objects having
attributes and events that change the state of objects
• OOD – process of planning a system of interacting objects –
purpose of solving a software problem
• OOA – applies object modeling techniques to analyze the
functional requirement for a system
• What is an object?
An object contains encapsulated data and procedures grouped
together to represent an entity
47
Object oriented concepts
• 6 basic concepts of OOD
1. Class – a blueprint to create objects (includes attributes and methods)
2. Object – represents a tangible real world entity
3. Information hiding – The ability to protect some components of objects
from external entities
4. Inheritance – the ability for a class to extend or over ride functionality of
another class (sub class)
5. Interface – the ability to defer the implementation of a method
6. Polymorphism – the ability to take more than one form (different
behavior in different instances)
48
OOA (Object oriented Analysis)
• New analysis method that integrates data and processes.
• Used for 2 purposes:
1. Used to study existing system objects and analyze the reusability of
those objects for proposal system
2. Defines new/ modified object that will be combined with existing
objects into a useful business application
Definition: According to Booch “OOA is a method of analysis that
examines requirements from the perspective of the classes and objects
found in the vocabulary of the problem domain”.
49
Activities in OOA
• OOA techniques used in 3 main things:
1. Study existing objects
2. Define new or modified objects
3. Define responsibilities or operations for
each object
50
Object Oriented Design (OOD)
• Refers to the objects that make up that business
Designing concepts:
1. Defining objects, creating class diagram from conceptual diagram
2. Identifying attributes
3. Use design pattern
4. Define application framework
5. Identify persistent objects/data
6. Identify and define remote objects
51
• Inputs - OOD
1. Conceptual model
2. Use CASE
3. System sequence diagram
4. User interface diagram
5. Relational data model
• Output – OOD
1. Sequence diagram
2. Class diagram
52
Advantages or benefits
1. Fosters the use of modern software engineering methodologies
2. It promotes and facilitates software re-usability
3. Facilitates inter-operability
4. Produces solutions that resemble real world problems
5. Facilitates modification, extension and maintenance of software
6. Reduces problems faces
7. Improves traceability of the system
8. Results in smooth transition between analysis, design and
implementation
9. Reduces the overall time taken to develop the system
10. Improves the quality of the system
53
Process of OOAD
• 3 reasons for using OOAD are:
1. The analysis model is not formal enough to be
implemented directly in an programming language
2. The analysis model has to be transformed to design
model
3. The analysis results can be validated using object
oriented design
54
Unified modeling Language (UML)
• UML (Unified modeling Language) – visual modeling
language for modeling system requirement
• Developed by Grady Booch, Jim Rumbaugh and Ivars
Jacobsons at Rational software corp.
• Borrows concepts from other methodologies and is
tailored specifically for OOD
55
Contd…
• UML defines a number of graphical views that
provide different perspective of the system under
development
• UML – one can build “basic building blocks” –
classes, interfaces, collaborations, components, nodes,
dependencies, generalizations and associations
56
UML’s basic building blocks
• -encompasses two kinds of building blocks
1. Things 2. Relationships
Things: abstractions – first class citizens in a model
a. Structural things: static parts a model; representing elements that are
either conceptual or physical
Structural things – “Classifiers”
57
1. Class – set of objects or instances
2. Interface – set of operations
Animal
Size
Eat()
Walk()
Run()
<<Interface>>
Eat()
Walk()
Run()
Contd…
58
Server
3. Collaboration – defines interaction between
objects or elements
4. Use case: description of sequence of action,
perform by a system for a specific goal
5. Components: describes the physical part of a system
6. Node: physical element (i.e.) exist at run time
b. Behavioral things
1. Interaction – comprises a set of messages exchange among elements
accomplish a specific task
2. State Machine – specifies the sequence of states an object or interaction
goes through during its lifetime
c. Grouping things: these are the boxes into which a model can be
decomposed
d. Annotational thing: basic object oriented building blocks of the UML.
59
Package
2. Relationships: tie things together
a. Dependency – relationship between two models elements
one depends on another (independent)
b. Association – basically a set of links that connects elements of UML
model
c. Generalization – defined as a relationship which connects a specialized
element with a generalized element
d. Realization – relationship in which 2 elements are connected
60
realization
Dependency
Employer Employee
generalization
UML diagram
• Graphical representation of a set of elements – connected
graph of vertices (things) and paths (relationships)
Types of UML diagram:
2 types of UML diagram – 1. structural diagram 2.
behavioral diagram
61
1. Structural diagram
- To visualize , specify, construct and document the static aspect of a
system
a. Class diagram – to show the existence of classes and their relationship
in the logical design of a system – includes a concept called cardinality
b. Object diagram – graph of instances that are compatible with a given
class diagram
c. Component diagram – different in terms of nature and behavior -
physical aspects of a system – to visualize the organization and
relationships among components in a system
d. Deployment diagram – shows how the finished system will be deployed
on one or more machines 62
2. Behavioral diagram
- To visualize, specify, construct and document the
dynamic aspect of a system
1. Use case diagram – present a graphical overview of
the functionality provided by a system, in terms of
actors and their goals
- Case diagram depicts 1. Use cases 2. Actors 3.
Associations 4. System boundary boxes 5.Packages
63
Types of Interaction diagram
1. Sequence diagram – shows interaction between
objects. But employee links rather than sequence
2. Collaboration diagram – interaction diagram that
emphasize the relationship of objects rather than
sequential progression
3. State chart diagram – describe the dynamic behavior of
an individual objects as a number of states and
transition between states
64
Contd…
4. Activity diagram – special kind of a state chart diagram that shows
the flow from activity to activity within a system
Elements
65
Initial activity
Activity
Decisions
Input signal
Output signal
Contd…
66
5. Concurrent Activities; occur simultaneously or in parallel
6. Final activity – end of activity – bull’s eye diagram
67
The End

BM322_04.pptx Business Management Integral

  • 1.
  • 2.
    Content • Case tools •System flow chart • Decision table • Data flow diagram (DFD) • Entity relationship (ER) • Object oriented analysis and design (OOAD) • UML diagram 2
  • 3.
    System analysis • Processof gathering and interpreting facts, diagnosing problems and using the information to recommend improvements to the system 3
  • 4.
    System design • Processof planning a new system or one to replace or complement an existing system. • Process by which system analyst, software engineer and programmers build the system – system development life cycle (SDLC) • The main objective of system analysis – to understand current system – and to determine importance, complexity and scope of problems. 4
  • 5.
    Problems/ Issues 1. Paperwork bottlenecks/ lack of systematic procedures 2. Delay in loan approval process 3. Lack of standardized procedures 4. Delay in passing purchasing orders Above listed are some examples of problem in system This cause firm to lose customers and business opportunities 5
  • 6.
    Process of systemanalysis • It is important for the system analyst to: 1. Collect information about procedures and information needs 2. Interviews, questionnaires and work samples 3. Work distribution analyses 4. Systems and procedures analysis Methods of collecting information about current system. 6
  • 7.
    Tools for informationrequirement 1. Interviewing 2. Questionnaires 3. Brainstorming 4. JAD (Joint application development) 7
  • 8.
    Approaches in systemdesign • 2 types of approaches in system design 1. Structured approach 2. Unstructured approach The tools for structured approaches as follows: 3. Data flow diagram (DFD) 4. Structure diagram/structure charts 5. Decision table 6. Decision tree 7. Entity relationship 8
  • 9.
    System design • Consistsof both logical design and physical design and system specification 1. Logical system design: - involves developing general specifications - Basic information system activities of input, processing, output, storage and control - meet end user requirements – feasibility study Contd…9
  • 10.
    2. Physical systemdesign: - involves the detailed design of user interface methods and products, database structures and processing & control procedures - Knowledge of business operations, information processing and hardware and software – to specify the physical design. 10
  • 11.
    Diagrammatic representation of systemdesign Screen, form, report and Data element Program and dialogue design Structure design Procedure design User interface design Data Design Process design 11
  • 12.
    System specifications 1. Userinterface specifications 2. Database specifications 3. Software specifications 4. Network and hardware specifications 5. Personnel specifications 12
  • 13.
    Phases of systemdevelopment 1. Conceptualize, clarify, document and communicate the activities and resources involved 2. Analyze the present business operations, management decision making and information processing 3. Propose and design new or improved information system 13
  • 14.
    System flow chart 1.Terminal - start or stop action here 2. Input/ Output – Take input variables and print output 3. Process - Operational action 4. Entry connector Yes No 5. Decision symbol – if condition and 2 paths Contd… 14
  • 15.
    15 6. Flow lines 7.Connector (transfer) Additional flow chart symbols Printed Documents – Produced in hard copy Display – Displayed on monitor Keyed Input – Input using keyboard, touch point or mouse Manual Input – using input device or manual operations Contd…
  • 16.
    16 Offline storage –data stored in hard disks like offline devices Online storage – data stored in online devices Auxiliary operation – operation performed by machine Magnetic tape – storage data device Magnetic disk – magnetic disk storage device Communication Links – data transmissions from one location to another location Contd…
  • 17.
    17 Annotation – Additionalexplanatory notes Pre-defined process – group of operations from a separate module Merge – Combines two or more set of items Extract – process that separate one or more specific set of items Sort – process that arrange – set of items in sequence Collate- perform both merge and extract operations
  • 18.
    Rules for drawingflow chart 1. First formulate the main line of logic 2. Maintain consistent level of detail 3. Do not give every detail 4. Be consistent in use of names and variables 5. Words – should be easy to understand 6. Flow from left to right or top to bottom 7. Flow chart – should be simple as possible 8. Use connectors appropriately 9. Check the logic and completeness of flow chart 18
  • 19.
    • Advantages: 1. Conveybetter meaning 2. Effective joining of part into system 3. Efficient coding • Disadvantages: 1. Takes more time 2. Difficult to make changes 3. Non-standardized 19
  • 20.
    Example for flowchart diagram – Addition function 20 Start Input x & y Print Z Z=X+Y Stop
  • 21.
    Decision table • Matrixrepresentation of the logic of a decision • Decision possible conditions and resulting actions Decision table – table of contingencies for defining a problem and action to be taken Parts of decision table 1. Stub – 1. Condition stub and 2. Action stub 2. Entry – 1. Condition entry and 2. Action entry 21
  • 22.
    Example for decisiontable • Eligibility check of student 22 If age below 18 Course A First class Completed 10th Indian Y Y Y Then Course B Y N Y Condition stub Action stub Condition Entry Action Entry
  • 23.
    Types of decisiontable 1. Limited entry form – 2 possible states 2. Extended entry form – more than 2 possibilities 3. Else form – all other possibilities 23
  • 24.
    Creating decision table 1.Name conditions and values that each condition can assume 2. Name all possible actions that can occur 3. List all possible rules 4. Define actions for each rule 5. Simplify decision table 24
  • 25.
    • Advantages: 1. Easierto draw 2. Compactness (replacing flow chart) 3. Easy to understand, analyze and interpret 4. Logically complete and consistent 5. Better way of communication • Disadvantages: 1. Not easily translated into computer programs 2. Do not scale up (not quantifiable) 25
  • 26.
    Data flow diagram(DFD) • DFD – a graphical representation of the flow of data through information system • Visualization of data processing • It aims to capture the transformations that take place within a system 26
  • 27.
    Elements of Dataflow diagrams 27 1. Process - 2. Data flow - 3. External entity - 4. Data stores - - transformation of data into information - Flow from one step to another step - Send or receive data from external entity - Inventory of data / database
  • 28.
    Levels of dataflow diagram 1. Context diagram: outlines the information system - Highest level in the data flow diagram, contains only one process – representing the entire system. 2. 0-level diagram: detailed process of information system – more process at this level – difficult to understand 3. Level 1 diagram: next level of 0 level diagram – decomposed and simplified, more explicit version. 28
  • 29.
    Logical data flowdiagram • Concentrates on logical flow of data from one to end to another end of a system 29 Supplier Check delivery note against order Update inventory file Order file Inventory data base Rejected note Delivery note Accepted note
  • 30.
    30 Physical data flowdiagram • Implementation dependent • Depicts the physical flow of data in the existing system 30 Supplier Checking clerk Store clerk Order file Inventory data base Rejected note Delivery note Accepted note
  • 31.
    Steps to developdata flow diagram 1. Make a list of business activities 2. Create a context diagram 3. Draw zero level diagram 4. Create a child diagram of zero level diagram 5. Check the errors 6. Develop logical and physical flow data diagrams 7. Partition the physical flow diagram 31
  • 32.
    DFD (Data flowdiagram) rules 1. Process: -no process can have only inputs -no process can have only outputs -A process has a verb phrase label 2. Data source: -Data must be moved by a process -Data cannot move directly from one data store to another -Data store has a noun phrase label 3. Source/sink: -Data cannot move directly from source to sink -source/sink has a noun phrase label 32
  • 33.
    4. Data flow: -Data flow has only one direction or may be both directions - Fork in data flow : same data flow to different locations - Join in data flow: different sources to same location - Data flow can’t go directly to the same process it leaves - Data flow to data store ; “Update of data” - Data flow from data store; “retrieve or use of data” - Data flow has a noun phrase label 33
  • 34.
    • Advantages: 1. Earlyimplementation 2. Study independence 3. Analysis 4. Tool for communication 5. Reduce costs • Disadvantages: 1. Imprecise 2. Absence of control aspects 3. Highly subjective 34
  • 35.
    Entity – Relationshipdiagram • ER model – proposed by peter in 1976 – to unify the network and relational database views • ER diagram or (data map) – another means of capturing the data and their organization - represents the interrelationships of the database scheme - relationship between table (relation) and ER diagram MSM - MBA Even semster 2020 35
  • 36.
    Objectives of Entity-relationship diagram 1.Straight forward relational representation 2. Easy conversion of ER to other data model 3. Graphical representation – better understanding 36
  • 37.
    Notions for Entity– relationship diagram 37 1. Entity - an entity is an object or concept – store information 2.Weak Entity - a weak entity is dependent on another entity to exist 3. Attributes: attributes are properties or characteristics of an entity 4. Key attributes: unique, distinguishing characteristic of the entity Contd…
  • 38.
    38 Contd… Multi valued attribute– can have more than one value Derived attribute – a derived attribute based on another attribute Illustrates how two entities store information in the database structure Weak relationship - to connect a weak entity with others
  • 39.
    39 - Mandatory onecardinality - Optional one cardinality - Mandatory many cardinality - Optional Many cardinality
  • 40.
    Components of ERdiagram • 3 primary components: 1. Entity – object that exists distinguishable from others 2. Attributes – Each entity has particular properties 3. Relationships – links various components in ER diagrams (1) one to one (2) one to many (3) many to many Example of ER diagram and data flow diagram Admission management system in an educational system 40
  • 41.
    CASE tools (Computer AidedSoftware Engineering) - Case tools - generic term – to denote automated support associated with the software development activities - Supports the development, verification, maintenance and evolution of processes and artifacts - CASE tools – software programs – designed to assist the programmers with the complexity of process 41
  • 42.
    Reasons for usingCASE tools 1. To increase analyst’s productivity 2. Facilitate communication among analysts and users 3. Providing continuity between life cycle phases 4. To assess the impact of maintenance 5. Cost reduction – automation of repetitive tasks 6. Reduce development time of project 7. Develop better quality complex projects 8. Create good quality of documentation 9. Maintenance and controllable system – can be created 42
  • 43.
    Characteristics of CASEtools 1. Standard methodology 2. Flexibility 3. Strong integration 4. Integration with testing software 5. Support for reverse engineering 6. On-line help 43
  • 44.
    Different classes oftools in SDLC • Fischer and Mc Clare list – tools for each classes based on the SDLC 1. Analysis, design and specification tools 2. Data modeling tools 3. Prototyping tools 4. Coding tools 5. Testing tools 6. Implementation tools 7. Upper CASE tools – modeling of an organization’s functional requirements 8. Lower CASE tools – used to generate computer source code, eliminating need for programmers 9. Documentation tools 10. Inter phase design tools 11. Database management tools 12. Quality assurance tools 13. Visual and emerging development tools 44
  • 45.
    Architecture of CASEenvironment 1. User interface layer – standardized interface toolkit 2. Tools layer – incorporates set of tools management services (TMS) with the CASE tools 3. Object Management Layer (OML) – performs the configuration management function 4. Shared repository layer – access control functions that enable the object management layer to interact with the database 45
  • 46.
    • Advantages: 1. Easyrevision of system description and graphic representation 2. Support of system prototyping 3. Capability of producing working source code 4. Provide maintenance support • Disadvantages: 1. Absence of standard levels of methodology 2. Limited functions supported 3. Conflicted use of diagrams 4. Human tasks remains critical 46
  • 47.
    Object oriented analysisand design (OOAD) • OOAD – software engineering approach – models a system as a group of interacting objects • OOAD - real world entities in terms of objects having attributes and events that change the state of objects • OOD – process of planning a system of interacting objects – purpose of solving a software problem • OOA – applies object modeling techniques to analyze the functional requirement for a system • What is an object? An object contains encapsulated data and procedures grouped together to represent an entity 47
  • 48.
    Object oriented concepts •6 basic concepts of OOD 1. Class – a blueprint to create objects (includes attributes and methods) 2. Object – represents a tangible real world entity 3. Information hiding – The ability to protect some components of objects from external entities 4. Inheritance – the ability for a class to extend or over ride functionality of another class (sub class) 5. Interface – the ability to defer the implementation of a method 6. Polymorphism – the ability to take more than one form (different behavior in different instances) 48
  • 49.
    OOA (Object orientedAnalysis) • New analysis method that integrates data and processes. • Used for 2 purposes: 1. Used to study existing system objects and analyze the reusability of those objects for proposal system 2. Defines new/ modified object that will be combined with existing objects into a useful business application Definition: According to Booch “OOA is a method of analysis that examines requirements from the perspective of the classes and objects found in the vocabulary of the problem domain”. 49
  • 50.
    Activities in OOA •OOA techniques used in 3 main things: 1. Study existing objects 2. Define new or modified objects 3. Define responsibilities or operations for each object 50
  • 51.
    Object Oriented Design(OOD) • Refers to the objects that make up that business Designing concepts: 1. Defining objects, creating class diagram from conceptual diagram 2. Identifying attributes 3. Use design pattern 4. Define application framework 5. Identify persistent objects/data 6. Identify and define remote objects 51
  • 52.
    • Inputs -OOD 1. Conceptual model 2. Use CASE 3. System sequence diagram 4. User interface diagram 5. Relational data model • Output – OOD 1. Sequence diagram 2. Class diagram 52
  • 53.
    Advantages or benefits 1.Fosters the use of modern software engineering methodologies 2. It promotes and facilitates software re-usability 3. Facilitates inter-operability 4. Produces solutions that resemble real world problems 5. Facilitates modification, extension and maintenance of software 6. Reduces problems faces 7. Improves traceability of the system 8. Results in smooth transition between analysis, design and implementation 9. Reduces the overall time taken to develop the system 10. Improves the quality of the system 53
  • 54.
    Process of OOAD •3 reasons for using OOAD are: 1. The analysis model is not formal enough to be implemented directly in an programming language 2. The analysis model has to be transformed to design model 3. The analysis results can be validated using object oriented design 54
  • 55.
    Unified modeling Language(UML) • UML (Unified modeling Language) – visual modeling language for modeling system requirement • Developed by Grady Booch, Jim Rumbaugh and Ivars Jacobsons at Rational software corp. • Borrows concepts from other methodologies and is tailored specifically for OOD 55 Contd…
  • 56.
    • UML definesa number of graphical views that provide different perspective of the system under development • UML – one can build “basic building blocks” – classes, interfaces, collaborations, components, nodes, dependencies, generalizations and associations 56
  • 57.
    UML’s basic buildingblocks • -encompasses two kinds of building blocks 1. Things 2. Relationships Things: abstractions – first class citizens in a model a. Structural things: static parts a model; representing elements that are either conceptual or physical Structural things – “Classifiers” 57 1. Class – set of objects or instances 2. Interface – set of operations Animal Size Eat() Walk() Run() <<Interface>> Eat() Walk() Run() Contd…
  • 58.
    58 Server 3. Collaboration –defines interaction between objects or elements 4. Use case: description of sequence of action, perform by a system for a specific goal 5. Components: describes the physical part of a system 6. Node: physical element (i.e.) exist at run time
  • 59.
    b. Behavioral things 1.Interaction – comprises a set of messages exchange among elements accomplish a specific task 2. State Machine – specifies the sequence of states an object or interaction goes through during its lifetime c. Grouping things: these are the boxes into which a model can be decomposed d. Annotational thing: basic object oriented building blocks of the UML. 59 Package
  • 60.
    2. Relationships: tiethings together a. Dependency – relationship between two models elements one depends on another (independent) b. Association – basically a set of links that connects elements of UML model c. Generalization – defined as a relationship which connects a specialized element with a generalized element d. Realization – relationship in which 2 elements are connected 60 realization Dependency Employer Employee generalization
  • 61.
    UML diagram • Graphicalrepresentation of a set of elements – connected graph of vertices (things) and paths (relationships) Types of UML diagram: 2 types of UML diagram – 1. structural diagram 2. behavioral diagram 61
  • 62.
    1. Structural diagram -To visualize , specify, construct and document the static aspect of a system a. Class diagram – to show the existence of classes and their relationship in the logical design of a system – includes a concept called cardinality b. Object diagram – graph of instances that are compatible with a given class diagram c. Component diagram – different in terms of nature and behavior - physical aspects of a system – to visualize the organization and relationships among components in a system d. Deployment diagram – shows how the finished system will be deployed on one or more machines 62
  • 63.
    2. Behavioral diagram -To visualize, specify, construct and document the dynamic aspect of a system 1. Use case diagram – present a graphical overview of the functionality provided by a system, in terms of actors and their goals - Case diagram depicts 1. Use cases 2. Actors 3. Associations 4. System boundary boxes 5.Packages 63
  • 64.
    Types of Interactiondiagram 1. Sequence diagram – shows interaction between objects. But employee links rather than sequence 2. Collaboration diagram – interaction diagram that emphasize the relationship of objects rather than sequential progression 3. State chart diagram – describe the dynamic behavior of an individual objects as a number of states and transition between states 64 Contd…
  • 65.
    4. Activity diagram– special kind of a state chart diagram that shows the flow from activity to activity within a system Elements 65 Initial activity Activity Decisions Input signal Output signal Contd…
  • 66.
    66 5. Concurrent Activities;occur simultaneously or in parallel 6. Final activity – end of activity – bull’s eye diagram
  • 67.